
Abstract
Objective
To examine the association between surgical waiting times (SWTs) and all-cause mortality (ACM) in non-metastatic patients with RCC, in relation to tumour stage.
Patients and methods
This nation-wide population-based cohort study included 9,918 M0 RCC patients registered in the National Swedish Kidney Cancer Register, between 2009 and 2021, followed-up for ACM until 9 December 2021, and having measured SWTs. The associations between primarily SWTs from date of radiological diagnosis to date of surgery (WRS) and secondarily SWTs from date of radiological diagnosis to date of treatment decision (WRT) and date of treatment decision to date of surgery (WTS), in relation to ACM, were analysed using Cox regression analysis, adjusted for clinical and demographic characteristics, stratified and unstratified according to T-stage.
Results
During a mean follow-up time of 5 years (49,873 person-years), 23% (n = 2291) of the patients died. The adjusted hazard ratio (AHR) for WRS (months) for all patients was 1.03 (95% confidence interval [CI] = 1.02–1.04; p < 0.001). When subdividing WRS on T-stage, the AHRs were 1.03 (95% CI = 1.01–1.04; p < 0.001) and 1.05 (95% CI = 1.02–1.08; p = 0.003) for stages T1 and T3, respectively, while non-significant for T2 (p = 0.079) and T4 (p = 0.807). Similar results were obtained for WRT and WTS.
Conclusions
Prolonged SWTs significantly increased the risk of early overall death among patients with RCC. The increased risk of early death from any cause show the importance of shortening SWTs in clinical work of patients with this malignant disease.
Introduction
Surgical waiting times (SWTs) are of particular interest for patients with malignant diseases, where delays in treatment allow disease progression, metastatic spread and ultimately early death. Prolonged SWT has a significant impact on the psychological wellbeing of cancer patients [Citation1]. The natural history of malignancy and effect of SWTs seems to differ between cancers. A reduced survival after delay has been reported for patients with bladder and breast cancer [Citation2–4], but not shown for prostate or colon cancer patients [Citation5–7]. Intuitively, time makes a difference in tumour development, with local growth and distant spread as well as potential supervening genetic changes of the tumour. For patients with renal cell carcinoma (RCC), the impact of shorter tumour growth time is clearly shown by the increased proportion of incidental detection, which has resulted in a stage shift towards smaller tumours, lower stages and improved survival [Citation8].
Although surveillance is an option for patients with small RCCs and reduced life expectancy or significant comorbidities, this is seldom an option in larger and more advanced RCCs [Citation9,Citation10], having a higher rate of locally advanced growth and distant metastases. There are, however, contradicting results regarding the effect of a longer SWT in RCC. A few studies have reported that surgical delay did not result in adverse outcomes [Citation11–13], while other studies found an association between prolonged SWT and in increased all-cause mortality (ACM) among pT3 RCC patients [Citation14], while for T2 RCC patients only SWT of 5–6 months were found to be significantly associated with increased ACM [Citation14,15]. Mano et al. [Citation16] found a significant effect of longer SWT on increased ACM, but no significant effect on cancer-specific mortality (CSM). While it may be argued that CSM is of main interest when studying adverse outcomes among RCC patients, for the individual patient the cause of death is probably of less interest. Moreover, ACM has the advantage that it avoids problems with misclassification bias regarding the true cause of death [Citation17].
There is, thus, a lack of unambiguous evidence regarding the effect of SWT on ACM in RCC patients and potential differences based on tumour stage. Moreover, there are disparate definitions of how SWT are defined. Based on the patient’s perspective the waiting time from radiological diagnosis to surgery (WRS) may be of main interest. This measure may be divided into the waiting times from date of radiological diagnosis to date of treatment decision (WRT) and from date of treatment decision to date of surgery (WTS), which may be of interest from epidemiological and cost-effectiveness perspectives. The National Swedish Kidney Cancer Register (NSKCR) contains the necessary data for examining these relationships.
Aim
The aim of the present study was to examine the associations between SWTs and ACM among non-metastatic RCC patients using data from the NSKCR, considering potential differences between tumour stages. The primary hypothesis was that prolonged WRS is associated with increased risks of early death from any cause, with the secondary hypothesis being that prolonged WRT and WTS are independently associated with increased risks of early death from any cause.
Patients and methods
Study design and participants
The NSKCR [Citation18] was launched in 2005, with the aim to measure and improve the quality of care of Swedish RCC patients by collecting detailed data on diagnosis, tumour characteristics, and treatment of the included patients. Although participation in NSKCR is voluntary, it includes 99% of all RCC patients as compared with the registration in the mandatory national Swedish Cancer Register [Citation18–22]. Further details about inclusion criteria for and content of the NSKCR are given in previously published studies [Citation18,Citation20,Citation23,Citation24].
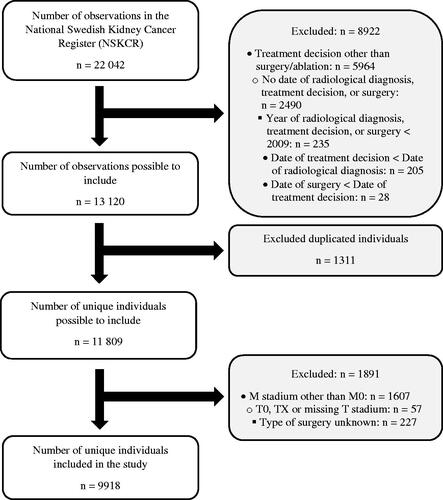
The present study aimed to include surgically treated patients without metastatic disease at primary diagnosis who had known dates of radiological diagnosis, treatment decision, and surgery registered in the NSKCR until 9 December 2021. Date of radiological diagnosis has been registered in the NSKCR since 2007, while dates of treatment decision and surgery have been registered since 2009. A flow chart of the inclusion process is given in . In short, of the 22,042 observations registered in the NSKCR on 9 December 2021, a total of 8,922 observations were excluded due to the decided treatment not being surgery/ablation, not having a date of radiological diagnosis, treatment decision, or surgery, having a date occurring before 2009, or the dates not being in the order of radiological diagnosis followed by treatment decision followed by surgery. Of the resulting 13,120 observations deemed possible to include in the study, 1,311 observations were found to be duplicated individuals included more than once in the NSKCR if bilateral RCCs were treated at different dates and were thus excluded from the study, resulting in 11,809 unique individuals possible to include. Finally, 1,891 individuals with M1, MX, T0, or TX stages, missing values for M or T stadium, or type of surgery unknown, were excluded, resulting in 9,918 unique individuals being included in the study.
Figure 1. Flowchart of the inclusion process.
Data collection
Data are reported to the NSKCR from the hospital treating the patient and checked for errors and inconsistencies by the regional cancer centre. Using the participants’ unique Swedish Personal Identification Number (PIN) [Citation25], the NSKCR is linked to the Population Register, from which information about date of death or emigration is retrieved daily. For the present study, information about the patient’s treatment, TNM stage, RCC type, tumour size, type of surgery, if the finding was incidental (yes/no), as well as the dates of radiological diagnosis, treatment decision, surgery, emigration, and death were extracted from the NSKCR. Sex and date of birth were obtained from the participant’s PIN.
The updated TNM 2017 classification system [Citation26] was used for tumour staging. RCC type was classified as clear cell, papillary, chromophobe, or other. Tumour size was defined as the maximal tumour diameter measured by tomographic imaging. Surgical treatment was dichotomised as open or non-open surgery, with the latter including laparoscopy or robot-assisted laparoscopy. Ablation treatment (n = 425, 4.3%) was classified as a non-open surgical treatment. Age at surgery was calculated as the time from the date of birth to the date of surgery, while the SWTs were calculated as the times from the date of radiological diagnosis to the dates of surgery (WRS) and treatment decision (WRT) and from the date of treatment decision to the date of surgery (WTS), respectively. Time to follow-up was measured as the time from the date of surgery to the date of death or censoring, with the latter occurring if the participant emigrated, changed PIN or was still alive at the end of follow-up on 9 December 2021.
Statistical analyses
All analyses were performed both unstratified and stratified on the tumour stages T1, T2, T3 and T4. Categorical data are presented as frequencies and percentages, n (%), while continuous data are reported as mean values with accompanying standard deviations (SDs). Tests of differences between independent groups were performed using the log-rank test, with comparisons of survival probabilities illustrated with Kaplan-Meier curves. The associations between SWTs (months) and ACM were estimated using Cox regression models, unadjusted as well as adjusted for the confounders male sex (yes/no), incidental finding (yes/no), year of surgery, age at surgery (years), open surgery (yes/no), tumour size (mm), RCC type (clear cell [reference category]/papillary or chromophobe/other) and T-substage (T1a/T1b/T2a/T2b/T3a/T3b/T3c/T4). A month was defined as consisting of 30 days. Since T4 did not have a T substage, this confounder was not used for models estimated separately for stage T4. The primary and secondary hypotheses were examined separately, using two separate models for the adjusted analyses: Model I examined the primary hypothesis by including only WRS, in addition to the confounding variables, in the model, while Model II examined the secondary hypothesis by including both WRT and WTS, in addition to the confounding variables, in the model. The results of the regression models are presented as hazard ratios (HRs) with accompanying 95% confidence intervals (CIs). As a sensitivity analysis against possible extreme values for SWTs, Cox regression analyses were also applied to a trimmed data set constructed by excluding observations below the 5th and above the 95th percentile for WRS. All statistical analyses were performed using R ≥ 4.1.2 (R Foundation for Statistical Computing, Vienna, Austria), with two-sided p-values < 0.05 considered statistically significant.
Ethical approval
The present study was approved by the Ethical Review Board of Northern Sweden (Dnr: 2012-418-31 M) and the Swedish Ethical Review Agency (Dnr: 2019-2579 and 2020-05093).
Results
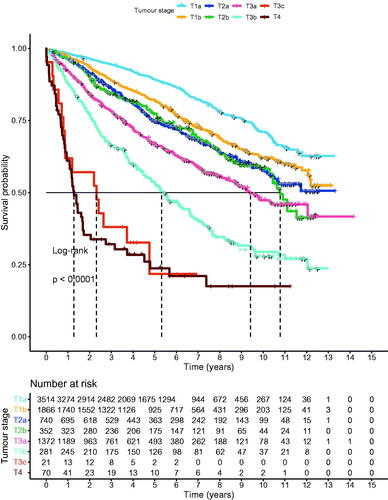
The 9,918 participants were followed for a mean period of 5 years (49,873 person-years). In total, 23% (n = 2,291) of the participants died during the study period, with the proportion of deceased participants varying from 17% (n = 1,094) in the T1 stage to 70% (n = 59) in the T4 stage. The survival probability differed significantly between the T-stages (p < 0.001). Kaplan-Meier curves of the survival probabilities are given in .
Figure 2. Kaplan-Meier curves of survival probability according to tumour stage.
Characteristics of the 9,918 participants are given in . A clear majority (64%; n = 6,364) of the participants were males, with the lowest and highest proportions of males observed in the T1 (64%; n = 4,118) and T4 (70%; n = 59) groups, respectively. For two thirds of the patients (68%; n = 6,587), the tumour was discovered incidentally, with T4 having the lowest proportion (43%; n = 36) and T1 the highest (78%; n = 4,940). At the time of surgery, the participants were at a mean (SD) age of 65.9 (11.6) years and had mean (SD) SWTs of 93.4 (106.4) days and 40.4 (40.3) days for WRS and WTS, respectively. The T1 and T4 stages had the youngest (mean age 65.2 years) and oldest (mean age 69.9 years) patients, respectively, as well as the patients with the longest (mean time 46.5 days) and shortest (mean time 25.0 days) WTS. Most patients (57%; n = 5,670) were treated with open surgery, with the lowest proportion (47%; n = 3,030) occurring in the T1 group and the highest proportion (85%; n = 71) in the T4 group. The overall mean (SD) tumour size was 55.1 (± 34.7) mm. Clear cell RCC was the most common RCC type in all stages, comprising 74% (n = 7,355) of all patients; it was least common (69%; n = 58) in stage T4 and most common (85%; n = 1,736) in stage T3.
Table 1. Characteristics of the n = 9,918 participating patients according to tumour stage.
WRS in relation to ACM
Results for Cox regression analyses of SWTs (months) as predictors of ACM for Models I and II are given in . More detailed results, including the confounding variables for each model, are given in Supplementary Tables S1–S5. Regarding the primary hypothesis, Model I showed that in the unstratified analyses (including all T stages), there was no significant association between WRS and risk of death during follow-up after surgery in the unadjusted analysis, while prolonged WRS was strongly associated with a higher risk of death in the adjusted analysis, with the risk being 3% higher for each additional month of WRS (p < 0.001).
Table 2. Results for Cox regression analyses of waiting time from radiological diagnosis to surgery (WRS; months), waiting time from radiological diagnosis to treatment decision (WRT; months), and waiting time from treatment decision to surgery (WTS; months) as predictors of all-cause mortality (ACM).
In the stratified analyses, WRS was for stages T1–T3 significantly associated with ACM in the unadjusted analyses, with T1 and T3 remaining significant also in the adjusted analyses. In the adjusted analyses, the risks of death during follow-up after surgery were 3% and 5% higher for T1 (p < 0.001) and T3 (p = 0.003), respectively, for each additional month of WRS.
WRT and WTS in relation to ACM
Regarding the secondary hypothesis, Model II overall showed the same pattern as for Model I. In the unstratified analyses (including all T stages), there were thus no significant associations between either WRT or WTS and risk of death during follow-up after surgery in the unadjusted analysis, while both prolonged WRT and prolonged WTS were strongly independently associated with higher risks of death in the adjusted analysis, with the risk being 6% and 2% higher for each additional month of WRT (p = 0.004) and WTS (p = 0.005), respectively.
In the stratified analyses, WRT and WTS were for stages T1–T3 all significantly associated with ACM in the unadjusted analyses, with T1 and T3 again remaining significant also in the adjusted analyses. In the adjusted analyses, the risks of death during follow-up after surgery were 5% and 10% higher for T1 (p = 0.005) and T3 (p = 0.043), respectively, for each additional month of WTS, while the risks were 2% and 4% higher for T1 (p = 0.004) and T3 (p = 0.034), respectively, for each additional month of WRT.
Sensitivity analysis
Results for the sensitivity analyses using Cox regression applied to the trimmed data are given in Supplementary Table S6. Overall, no materially different results could be observed, compared to what was observed for the full data set. All SWTs that were significant in adjusted analyses for the full data set are still significant in adjusted analyses for the trimmed data set. A notable change is, however, that WTS for stage T2 and WRT for stage T4 are significant in the adjusted analyses of the trimmed data, while they were non-significant for the full data set.
Discussion
This large-scale nationwide population-based register study of 9,918 surgically treated non-metastatic RCC patients with 49,873 person-years of follow-up showed that prolonged WRS was associated with increased risks of early death from any cause and prolonged WRT and WTS were independently associated with increased risks of early death from any cause. Overall, the pattern was the same for WRS, WRT and WTS, with prolonged SWTs for all patients being strongly associated with increased risks of early death in adjusted analyses, regardless of the type of SWT analysed. In adjusted as well as in unadjusted stratified analyses significant associations between SWTs and ACM were observed for T1 and T3 RCC patients, irrespective of type of SWT analysed.
Results in perspective
In line with the results of the present study, Kim et al. [Citation12] found no significant associations between SWT and pathological upstaging or cancer-specific survival in unadjusted analyses. In adjusted analyses, Mano et al. [Citation16] found no significant associations between SWT and upstaging, recurrence or CSM. Prolonged SWTs were, however, found to be significantly associated with an increased risk of early death, with an adjusted hazard ratio (AHR) of 1.17 per month [Citation16]. Although this was a considerably larger effect than the present study’s unstratified AHRs of 1.03, 1.02 and 1.06 per month for WRS, WRT and WTS, respectively, it is in line with the results of the present study.
While prolonged SWTs were significantly associated with increased risks of early death for the T1 and T3 stages, in both unadjusted and adjusted analyses, a significant association was for stage T2 found in the unadjusted analyses only. The reasons for this loss of significance for T2 RCCs in the adjusted analyses are unclear. One reason may, however, be that T2 RCCs are tumours that have grown large without being locally invasive, thus having a less malignant behaviour despite their appearance with a large tumour size. Another reason may be relatively fewer events among the T2 patients in the present study, 375, compared with 1,056 and 729 events for stages T1 and T3, respectively, limiting the power of the analyses. With only 58 events in the adjusted analyses for stage T4, a limited power may also explain the absence of a significant impact of SWT on ACM for this stage, together with the overall dismal prognosis in this group.
The results of the present study are in agreement with those reported by Srivastava et al. [Citation27] in a study of 29,746 cT1b-T2bN0M0 RCC patients, who in adjusted analyses found a significant association between prolonged SWTs and early overall death for cT1b but not cT2a or cT2b RCC. However, the latter study included SWT as a categorical variable (< 1 month [reference]/1–3 months/> 3 months) in the analyses, which usually results in a loss of power. Our results are also partly congruent with a study by Ginsburg et al. [Citation14] including 11,848 patients with clinical T2 RCC, which found a significant association between prolonged SWTs and increased risks of early overall death, with AHRs of 1.10 and 1.11 per month in the entire cohort and a sub-cohort of patients with Charlson Comorbidity Index = 0, respectively. Notably, their study had a total of 2,806 events, substantially increasing the power of the study, which may partly explain the observed significant associations, compared with the absent of a significant association for stage T2 in our study.
Strengths and limitations
The main strength of the present study was the large data set with 9,918 patients having 49,873 person-years of follow-up taken form the validated high quality [Citation21] NSKCR, covering 99% of all RCC patients nationwide. The generalizability to Swedish RCC patients of the obtained results should therefore be high. Among limitations, a lower degree of control over the data collection process are inherent to a register study and furthermore reasons for delayed surgery, such as primary surveillance and treatment of comorbidities, were not known. However, only patients treated with surgery were included in the analysis. Although the lack of data on comorbidity is a major limitation of the present study, it should be noted that the observed associations between SWTs and ACM were in general robust to the addition of important confounders to the regression models. A further addition of, e.g. the Charlson Comorbidity Index as a confounder, would probably only have a marginal effect on the magnitude of the observed associations. Finally, while the lack of data on CSM may be viewed as a limitation, it should be noted that the way the Swedish Cause of Death Registry works, it is safe to assume that an overwhelming majority of the ACM deaths would in fact be registered with RCC as a primary or secondary cause of death. Using CSM instead of ACM as an outcome would thus probably have had a negligible effect on the results of the present study.
Conclusions
The present large-scale nationwide population-based cohort study found that prolonged SWTs, resulted in a significantly increased risk of early death among RCC patients. These results elucidate the importance of reducing SWTs for RCC patients, to improve the survival in this malignant disease.
| Abbreviations | ||
| ACM | = | all-cause mortality |
| AHR | = | adjusted hazard ratio |
| CI | = | confidence interval |
| CSM | = | cancer-specific mortality |
| HR | = | hazard ratio |
| IQR | = | interquartile range |
| NSKCR | = | National Swedish Kidney Cancer Register |
| PIN | = | Personal Identification Number |
| RCC | = | renal cell carcinoma |
| SD | = | standard deviation |
| SWT | = | surgical waiting time |
| WRS | = | Waiting time from Radiological diagnosis to Surgery |
| WRT | = | Waiting time from Radiological diagnosis to Treatment decision |
| WTS | = | Waiting time from Treatment decision to Surgery |
Supplemental Material
Download MS Word (48.7 KB)Supplemental Material
Download MS Word (75.5 KB)Acknowledgements
Thanks to the members of the NSKCR steering committee and collaborators at the Regional Cancer Centre, Stockholm for providing data from the NSKCR. The NSKCR is supported by unconditional grants from the Swedish Association of Local Authorities and Regions (SALAR).
Supplementary data
Results for the confounding variables from the Cox regression analyses of waiting times as predictors of ACM as well as results for sensitivity analyses are given in Supplementary Tables S1–S6.
References
- Carr T, Teucher U, Mann J, et al. Waiting for surgery from the patient perspective. Psychol Res Behav Manag. 2009;2:107–119.
- Lee CT, Madii R, Daignault S, et al. Cystectomy delay more Than 3 months From initial bladder cancer diagnosis results in decreased disease specific and overall survival. J Urol. 2006;175(4):1262–1267.
- Gore JL, Lai J, Setodji CM, the Urologic Diseases in America Project, et al. Mortality increases when radical cystectomy is delayed more than 12 weeks: Results From a surveillance, epidemiology, and end Results-Medicare analysis. Cancer. 2009;115(5):988–996.
- Kulkarni GS, Urbach DR, Austin PC, et al. Longer wait times increase overall mortality in patients With bladder cancer. J Urol. 2009;182(4):1318–1324.
- Simunovic M, Rempel E, Thériault M-E, et al. Influence of delays to nonemergent Colon cancer surgery on operative mortality, disease-specific survival and overall survival. Can J Surg J Can Chir. 2009;52:E79–E86.
- Loeb S, Folkvaljon Y, Robinson D, et al. Immediate versus delayed prostatectomy: Nationwide population-based study. Scand J Urol. 2016;50(4):246–254.
- Auffenberg GB, Linsell S, Dhir A, Michigan Urological Surgery Improvement Collaborative, et al. Comparison of pathological outcomes for men with low risk prostate cancer from diverse practice settings: Similar results from immediate prostatectomy or initial surveillance with delayed prostatectomy. J Urol. 2016;196(5):1415–1421.
- Ljungberg B, Albiges L, Abu-Ghanem Y, et al. European association of urology guidelines on renal cell carcinoma: the 2022 update. Eur Urol. 2022; Mar 25:S0302-2838(22)01676-1. Epub ahead of print. PMID: 35346519.
- Finelli A, Ismaila N, Bro B, et al. Management of small renal masses: American society of clinical oncology clinical practice guideline. J Clin Oncol. 2017;35(6):668–680.
- Cheung DC, Finelli A. Active surveillance in small renal masses in the elderly: a literature review. Eur Urol Focus. 2017;3(4-5):340–351.
- Martínez CH, Martin P, Chalasani V, et al. How long can patients with renal cell carcinoma wait for surgery without compromising pathological outcomes? Can Urol Assoc J. 2011;5(6):e148–e151.
- Kim KH, You D, Jeong IG, et al. The impact of delaying radical nephrectomy for stage II or higher renal cell carcinoma. J Cancer Res Clin Oncol. 2012;138(9):1561–1567.
- Shiff B, Breau RH, Patel P, et al. Impact of time to surgery and surgical delay on oncologic outcomes for renal cell carcinoma. J Urol. 2021;205(1):78–85.
- Zeng J, Batai K, Lee B. Nephrectomy delay of more than 10 weeks from diagnosis Is associated with decreased overall survival in pT3 RCC. jkcvhl. 2021;8(2):27–33.
- Ginsburg KB, Curtis GL, Patel DN, et al. Association of surgical delay and overall survival in patients with T2 renal masses: Implications for critical clinical decision-making during the COVID-19 pandemic. Urology. 2021;147:50–56.
- Mano R, Vertosick EA, Hakimi AA, et al. The effect of delaying nephrectomy on oncologic outcomes in patients with renal tumors greater than 4cm. Urol Oncol Semin Orig Investig. 2016;34(5):239.e1-239–e8.
- Black WC, Haggstrom DA, Welch HG. All-cause mortality in randomized trials of cancer screening. J Natl Cancer Inst. 2002;94(3):167–173.
- Thorstenson A, Bergman M, Scherman-Plogell A-H, et al. Tumour characteristics and surgical treatment of renal cell carcinoma in Sweden 2005–2010: a population-based study from the national swedish kidney cancer register. Scand J Urol. 2014;48(3):231–238.
- Thorstenson A, Harmenberg U, Lindblad P, et al. Cancer characteristics and current treatments of patients with renal cell carcinoma in Sweden. Biomed Res Int. 2015;2015:456040–456045.
- Landberg A, Lindblad P, Harmenberg U, et al. The renal cell cancer database Sweden (RCCBaSe) – a new register-based resource for renal cell carcinoma research. Scand J Urol. 2020;54(3):235–240.
- Landberg A, Bruce D, Lindblad P, et al. Validation of data quality in the national Swedish kidney cancer register. Scand J Urol. 2021;55(2):142–148.
- Rosenblad AK, Sundqvist P, Westman B, et al. A psychometric evaluation of the functional assessment of cancer therapy—kidney symptom index (FKSI-19) among renal cell carcinoma patients suggesting an alternative two-factor structure. Qual Life Res. 2021;30(9):2663–2670.
- Guðmundsson E, Hellborg H, Lundstam S, Swedish Kidney Cancer Quality Register Group, et al. Metastatic potential in renal cell carcinomas ≤7cm: Swedish kidney cancer quality register data. Eur Urol. 2011;60(5):975–982.
- Thorstenson A, Harmenberg U, Lindblad P, Swedish Kidney Cancer Quality Register Group, et al. Impact of quality indicators on adherence to national and European guidelines for renal cell carcinoma. Scand J Urol. 2016;50(1):2–8.
- Ludvigsson JF, Otterblad-Olausson P, Pettersson BU, et al. The swedish personal identity number: possibilities and pitfalls in healthcare and medical research. Eur J Epidemiol. 2009;24(11):659–667.
- Brierley J, Gospodarowicz MK, Wittekind C, editors. TNM classification of malignant tumours. Eighth edition. Chichester, West Sussex, UK ; Hoboken, NJ: John Wiley & Sons, Inc; 2017.
- Srivastava A, Patel HV, Kim S, et al. Delaying surgery for clinical T1b-T2bN0M0 renal cell carcinoma: Oncologic implications in the COVID-19 era and beyond. Urol Oncol Semin Orig Investig. 2021;39:247–257.