
ABSTRACT
Glucocorticoid hormones affect gene expression via activation of glucocorticoid receptor NR3C1, causing modulation of inflammation and autoimmune activation. The glucocorticoid Dexamethasone is an important pharmaceutical for the treatment of colitis and other inflammatory bowel diseases. While suppressive effects of glucocorticoids on activated immune cells is significant, their effects upon epithelial cells are less well studied. Previous research shows that the effects of Dexamethasone treatment on polarized Caco-2 cell layer permeability is delayed for >10 treatment days (as measured by transepithelial electrical resistance). In vivo intestinal epithelial cells turn over every 3–5 days; we therefore hypothesized that culture age may produce marked effects on gene expression, potentially acting as a confounding variable. To investigate this issue, we cultured polarized Caco-2 monolayers during a 30-day timecourse with ~15 days of continuous Dexamethasone exposure. We collected samples during the timecourse and tested differential expression using a 250-plex gene expression panel and Nanostring nCounter® system. Our custom panel was selectively enriched for KEGG annotations for tight-junction, actin cytoskeleton regulation, and colorectal cancer-associated genes, allowing for focused gene ontology-based pathway enrichment analyses. To test for confounding effects of time and Dexamethasone variables, we used the Nanostring nSolver differential expression data model which includes a mixturenegative binomial modelwith optimization. We identified a time-associated “EMT-like” signature with differential expression seen in important actomyosin cytoskeleton, tight junction, integrin, and cell cycle pathway genes. Dexamethasone treatment resulted in a subtle yet significant counter-signal showing suppression of actomyosin genes and differential expression of various growth factor receptors.
Introduction
Glucocorticoids (GCs) modulate stress response in tissues throughout the body, including gastrointestinal barrier function associated with intestinal and colorectal inflammation.Citation1 Immunosuppressive effects of GCs make them important pharmacological agents for chronic disorders including inflammatory bowel disease.Citation2,Citation3 Long-term negative side effects of GCs, including endogenous Cortisol in Cushing’s Syndrome, are associated with loss of epithelial integrity.Citation4 Epithelial barrier function is the result of protein–protein interactions between the tight-junction (TJ) complex, actin cytoskeleton, and Rho GTPase signaling pathways.Citation5,Citation6 The molecular structure of TJ includes the trans-membrane protein Occludin (OCLN) which prevents paracellular translocation of macromolecules, and Claudin family members which provide selective permeability for small ionic molecules.Citation7 Important intracellular tight-junction regulatory proteins of the TJ complex include ZO-1 (aka. TJP), TJP2, and TJP3 which act as the structural hub between transmembrane TJ proteins and filaments of the actin cytoskeleton. The TJ and its regulatory milieu are described as the ‘zonular signalsome’ due to crosstalk between TJ, adherens junction (AJ), and RhoGTPase signaling.Citation7–Citation11 ()
Figure 1. Epithelial identity pathways and experimental design. (a) Tight junction and signal transduction pathways regulating epithelial permeability. (b) Permeable membrane culture system and TEER electrical diagram. (c) Experimental timeline.
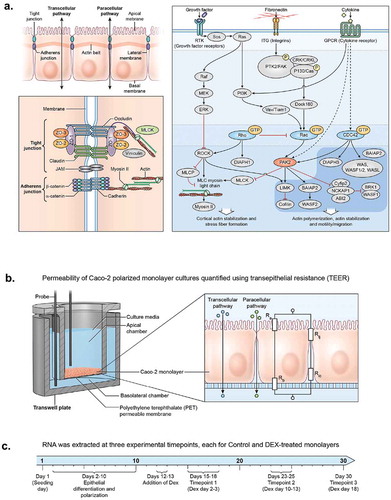
The Caco-2 cell line has a decades-long history of use as in vitro model for pharmacokinetic assays for drug absorption.Citation12 Recent papers use the Caco-2 cell line for investigating regulatory mechanisms of protein and mRNA expression of TJ genes during stimulation with inflammatory cytokines and/or treatment with GCs.Citation13–Citation16 Two reports specifically investigated GC regulatory effects during long-term timecourse on epithelial polarization experiments (>20 days).Citation17,Citation18 These papers showed significant GC-associated effects occurring only at later stages of the timecourse and indicate that GCs may have important biological effects in this system only after weeks of Dexamethasone (DEX) exposure. Caco-2 polarization, which occurs earlier in culture (days 1–10), is also associated with significant differential expression (DE) of TJ proteins in reported microarray data.Citation19–Citation21
We sought to further investigate gene expression and pathway effects associated with this phenomenon, and asked the following questions: 1) During a 30-day timecourse in untreated Caco-2 monolayers, what DE and pathway-associated trends are observed? 2) During a 20-day DEX treatment, what are the relative DEX-associated vs. timeline-associated DE and associated pathway signals? 3) Is signal present from previously reported gut stress/IBS biomarkers? To address these questions, we utilized a 250-plex gene expression assay, and tested RNA collected from Caco-2 polarized monolayers grown on apico-basolateral membrane system, and collected trans-epithelial resistance (TEER) measurements as a readout for permeability during the timecourse (). We grew cells for 30 days, with DEX treatment between days 15–30 (15 days) (). The results are partially confirmatory of previous research, while pathway analysis provides novel inferences of higher-order functional effects associated with culture age and DEX treatment, with good statistical support for observed pathway enrichments. The advanced linear modeling strategy provides a novel indications of relative effects from the respective variables.
Materials and methods
Introduction to the workflow
Our expression assay methodology was implemented as a demonstration as scale-multiplier for a small-laboratory, medium-throughput gene expression workflow. Expression data were obtained with an in-house Nanostring nCounter® system and nSolver™ software, and represents a partially automated, medium-throughput gene expression platform with integrated bioinformatics for DE and gene ontology (GO)-based pathway analyses. The custom probe panel and workflow with pathway scoring and GO enrichment analysis provide novel insights into putative cellular functional effects a set of in vitro cell culture experiments. All raw Nanostring .RCC files are available in the NCBI Gene Expression Omnibus database (GEO accession: GSE132501). Additional metadata on cell cultures and treatments are found in NCBI Bioproject database and its linked biosamples (BioProject accession: PRJNA525237).
Caco-2 cell culture
Caco-2 cell line was purchased from American Type Culture Collection (ATCC# HTB-37), and culturing was performed as described in published best practices from the ATCC manual (https://www.atcc.org/Products/All/HTB-37.aspx?geo_country=us), and as reported in literature.Citation12,Citation22 Cryovials were thawed and cultured in 12 mL media in T75 flasks. Cells were grown to 60–80% confluency, media was aspirated, rinsed with HBSS, harvested with 3 mL .25% Trypsin-EDTA and split 1–2 or 1–3. Viable cell counts were obtained using Nexcelom Bioscience Cellomenter™ Auto T4 cell counter with Trypan Blue assay for viability (BioWhittaker® catalog# 17-942E). Cells were initially thawed from cryopreserved vials with 5 or 6 previous passages and seeded after 3–4 additional passages.
After expansion, cells were seeded onto 24-well insert plates with PET 1.0 uM pore size permeable membrane (Millipore product # PSRP010). Cells were seeded at a density of .4x106 cells/mL in a 300uL volume (120,000 cells/well) in the apical chamber. Cultures were grown at 37°C, 5% CO2 on filter-sterilized Eagle’s Minimum Essential Medium (EMEM) with 20% Fetal Bovine Serum, with Penicillin-Streptomycin (Quality Biological™ cat. # 120–095-671). Media was changed every other day during the timecourse.
Trans-Epithelial Electrical Resistance (TEER)
TEER readings were taken at regular intervals during the DEX timecourse with the Millicell ERS-2 Epithelial Volt-Ohm Meter (cat. # MERS00002). Cultures were equilibrated at room temperature (22°C) before readings were taken, to control for temperature effects on TEER readings.Citation23
Timecourse and DEX treatment
Dexamethasone treatment began ~15 days post-seeding, after Caco-2 monolayers became polarized and cell density remained stable for 2–3 days (). DEX was applied to experimental wells at 10uM, with one set of replicates treated at 100uM. Sigma reagent #D2915 “Dexamethasone-Water Soluble” was used. Water-soluble DEX is compounded with methyl-β-cyclodextrin, product documentation states the dry reagent is 65mg/g DEX by weight. DEX reagent was labeled 392.5g/mol. A stock solution was made by dissolving DEX at 10 g/L. 10-uM Dex in media was obtained by using: 65 mg/g x 10g/L = .65g/L x 1mol/392.5g = .00166mol/L = 1.66 mM = 1660 uM. For 10uM, added .06mL Dexamethasone-Water Soluble stock to 10 mL media. Control cell cultures were grown in standard media without DEX or carrier. As DEX is commonly orally administered in conjugated form, the experimental treatment can be interpreted as a model for cellular action during pharmacokinetic exposure of conjugated DEX per se, rather than generalized to glucocorticoid activity in general. Total RNA was collected from fresh monolayers at multiple timepoints during the full 30-day timecourse and the 15-day DEX treatment; these were analyzed as separate experiments (, , respectively).
Figure 2. Days 1 – Day 30 Caco-2 Timecourse, Cellular Aging Experiment. (a) Histogram of sample numbers by timepoint. (b) Heatmap of pathway scores, using ReactomeDB pathway annotations. (c) Volcano plots showing differentially expressed genes by pathway annotation for significant pathways identified in gene-set analysis.
Figure 2. (Continued).
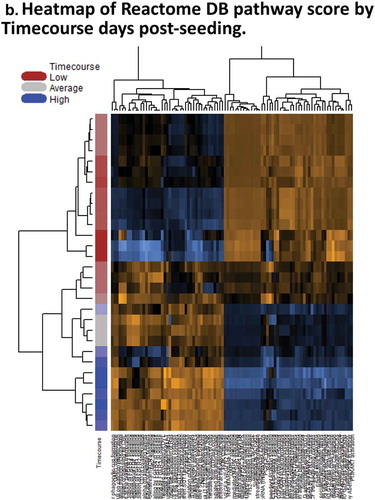
Figure 2. (Continued).
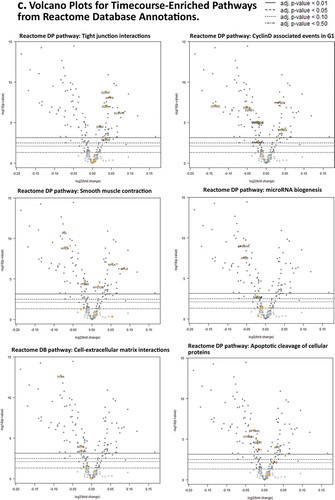
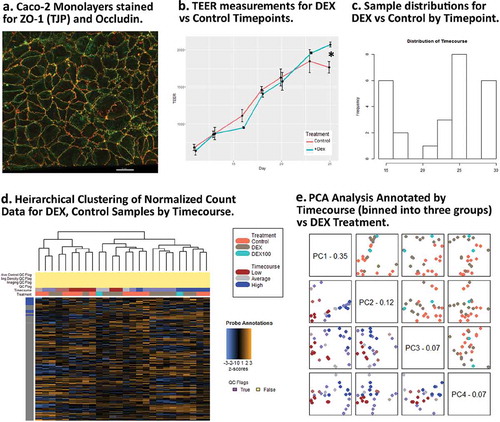
Figure 3. Dexamethasone vs. Controls Timecourse. (a) Confocal image of a representative Caco-2 polarized monolayer at ~10 days with immunofluorescent staining for Occludin (OCLN) and ZO-1 (TJP). (b) TEER (ohms/cm2) for DEX and Control samples during the timecourse. (c) Sample distributions used in DEX vs Control analysis by days post-seeding. (d) Unsupervised clustering of relative gene expression in the full probe panel. (e) PCA results showing PC1 is reasonable predictor for timecourse, PC3 is a marginally effective predictor for DEX treatment.
Experimental replicates
We collected RNA samples for 2–4 replicates per plate, and from 2 to 3 biological replicates for selected timepoints.
RNA extraction
Total RNA including small RNA from Caco-2 monolayers was extracted from individual permeable membrane inserts at the three experimental timepoints using the Qiagen miRNeasy® Micro kit (cat. #217,084) with RNeasy® MinElute® spin columns (cat. #1,026,497). Extracted total RNA was quantified with Thermo Scientific™ NanoDrop™ spectrophotometer. RNA was stored at −80°C and thawed immediately before the Nanostring protocol start.
Nanostring methodology and probe-panel selection
Nanostring methodology utilizes fluorescent barcode-labeled hybridization probes, does not use reverse-transcription but is a single molecule optical counting method which provides some technical advantages over both RNA-seq and qPCR methods.Citation21
Our 250-plex probe panel targeted 250 protein coding mRNAs. Complete probe sequences and isoform coverage for the panel are provided with the supplementary material (Sup. Methods 1.1; GEO Platform GPL26764). Briefly, our panel selection utilized KEGG pathway database to generate a list of genes affecting intestinal-epithelial barrier function and epithelial homeostasis, is also described in terms of a network interaction model for miRNA–mRNA interactions.Citation24 Genes were selected from KEGG Pathways for tight-junction (map04530), regulation of actin cytoskeleton (map04810), colorectal cancer (map05210), most with significant overlapping membership in adherens junction (map04520), focal adhesion (map04510), Wnt (map04310), and other pathways.Citation25 Genes from the initial list were excluded if not expressed in lower GI tissues by referencing against the Human Protein Expression Atlas (which includes tissue-specific RNA expression).Citation26 Additional genes of interest were included on an ad hoc basis:
KEGG microRNA gene targets associated with colorectal cancer (map05206). These include Programmed cell death 4 (PDCD4), DNA methyltransferase 3A (DNMT3A), and others.
Core microRNA biogenesis pathway genes Drosha (RNASEN), Pasha (DGCR8), Dicer, Argonaute2, Exportin5, and the RISC loading complex RNA binding subunit (TRBP).
Putative reported biomarkers for GI dysfunctionCitation27 including chemokine receptor CXCR4, Lysozyme (LYZ) and others.
Histological enterocyte differentiation markers Carbonic Anhydrase I and II (CAI, CA2), Citation28 and cancer stem marker Aldehyde dehydrogenase 18, isoform A1.Citation28,Citation29
Additional genes with high specific expression in gastrointestinal tissue according to Human Protein Expression Atlas, including additional Claudins, heat shock proteins, and others.
Normalization and differential expression
Normalization, DE, and pathway analyses were performed with Nanostring nCounter nSolver™ 4.0 (Nanostring MAN-C0019-08), with Nanostring Advanced Analysis Module 2.0 plugin (Nanostring MAN-10,030–03) following the Nanostring Gene Expression Data Analysis Guidelines (Nanostring MAN-C0011-04). Advanced Analysis Module 2.0 software uses open-source R programs for QC, normalization, DE analysis, pathway scoring, and gene-set enrichment analysis.
Reference genes for DE were obtained from the nSolver implementation of geNorm algorithm, which selects reference probes based on global stability (Mi) of pairwise expression ratio between samples, iteratively identifying genes with the least expression varianceCitation30 from the R-language Bioconductor package NormqPCR.Citation31 We chose 10 most minimum Mi value genes for normalization reference genes (Sup. Methods 1). Normalized probe count data for each experiment are provided (Sup. Results 1.1, Normalized Counts). Normalized counts provided as supplementary data with this submission were analyzed as described in this methods section. Note that normalized count data reported in the GEO: GSE132501 accession utilized a global average normalization method which includes a broader sample set than the current analysis, therefore normalized counts vary between this and the GEO normalized data, although results were tested and remain similar.
The nSolver 4.0 DE data model preferentially applies the optimal statistical method per gene given the variable distribution 1) Mixture negative binomial model, 2) Simplified negative binomial model, 3) Log-linear model, in that order. FDR p-value adjustment was performed with Benjamini–Yekutieli method. Under the data model, time (day post-seeding) was used as a continuous variable for to testing DE during the Day 1 – Day 30 timecourse. As predictor variables for the Day 15 – Day 30 DEX treatment experiment, time (day post-seeding) as a continuous variable, and Control/DEX+/DEX100 were used as categorical variables with Control as the reference category (Sup. Results 1.2, 1.3, 1.4). Analyses were tested with batch and cartridge IDs factored as confounding variables and were observed to exert a minimal effect on the DE determinations.
Pathway scoring and gene-set analyses
Pathway scoring and gene-analysis were performed using the Reactome pathway database annotations.Citation32 Pathway scores are derived by calculating the first principle component of pathway genes’ normalized expression (Sup. Results 2.1, 2.2, Pathway scoring results for experimental comparisons). Gene set analysis is a quantitative summary of DE for gene sets. GSA summarizes the DE for genes from each annotation, then calculates a global differential significance score for each gene set, allowing for some quantitative inference of putative functional effects (Sup. Results 3, GSA global statistics). KEGG pathways were performed with PathviewCitation33 implemented in Nanostring nSolver.
Results and discussion
Our results are divided into three parts with accompanying discussions: A) 30-day timecourse, B) Effects of DEX treatment on DE and TEER measures, and C) ad hoc biomarkers. Compared with the pre-print, these results represent increased sampling and application of pathway scoring and gene set enrichment analyses; results remained very similar to with the previous analyses.Citation34
Differential expression associated with 30-day timecourse
A 30-day timecourse is generally lengthier than most traditional in vitro cell culture experiments. It represents a continuum of biological processes which include epithelial polarization (~D1-10), and cellular senescence (after polarization and at later timepoints). We observed an ‘inflection point’ in pathway scores clustering at around culture Day 10 (). Key epithelial pathways are altered at this point, and are consistent with the previously published data of Halbeib et al. (2007) in their microarray study of Caco-2 polarization.Citation20 Similar expression patterns for key pathway transcripts include increased expression of Claudins 4 and 15, decreased expression of Occludin (OCLN), Beta Catenin 1 (CTNNB1), Fibronectin 1 (FN1), and Cyclin-dependent kinase 4 (CDK4).
Gene set enrichment analysis indicates putative altered cellular functions; these are representative gene expression associated with biological processes of polarization and senescence (, , Supplementary Results). Increased expression of Claudins 3, 4, 7, and 15 (CLDN3, 4, 7, 15) are observed from the ‘Tight junction interactions’ pathway. Decreased expression is seen in Beta-Catenin 1 (CTNNB1) and ZO-1 (TJP), Rho GTPase ROCK1, and others from the ‘Apoptotic cleavage of cellular proteins’ pathway. Decreased expression is also seen in ‘Cyclin-D associated events in G1ʹ pathway including Cyclin D1 and D2 (CCND1, 2) and Cyclin-dependent kinase 4 (CDK4). Actin cytoskeleton genes Actin B (ACTB) and Actinin (ACTN1) have lowered expression, with actomyosin assembly showing variable expression, putatively associated with reorganization of the apical band cytoskeletal structure in epithelia. Also seen is decreased expression in the miRNA biogenesis components Drosha and Exportin 5 (XPO5).
In general summary of the timeline results, increased expression of Claudins, and decreased expression of Cyclin D-associated cell cycle transcripts, AJ and TJP expression are indicative of putative increased functional activation of tight-junction and diminished activation of Cyclin D-mediated G1, ‘zonular signalsome’, and miRNA biogenesis hubs. Further studies should investigate how similar these observed patterns are to in vivo enterocyte differentiation, while the inherent capability for the longevity of Caco-2 vs. primary enterocytesprovides insight into mechanisms of survival for CRC cells.
Differential expression associated with Dexamethasone, with General Linear Modeling (GLM) of covariate timecourse effects
Dex-associated alterations in TEER are observed late in the timecourse
During the DEX treatment, we observed TEER values increase at a steady rate in both Control and DEX treated replicates. Decreasing permeability associated with increased barrier function is expected during maturation of Caco-2 monolayers ().
Between culture days 23–25 (~days 13–15 of DEX continuous exposure), DEX-treated cultures diverged to have higher TEER relative to control cultures (), also consistent with the previously reported observations of Fischer et al. (2014) and Zheng et al. (2017).Citation17,Citation18 At these latest timepoints, TEER in DEX-treated and control cultures becomes significantly different: DEX-treated cultures continue to show increasing TEER, while controls level off. Physiological effects of GC exposure using this system are therefore not measurable until significantly after polarization, even if a distinct gene expression signature can be detected. The phenomenon could represent the accumulation of transcriptional alterations which over time become functional, or another mechanism by which DEX effects on permeability are delayed in the short term, but manifest during long-term exposure.
Covariate GLM modeling resolved DEX-associated DE from culture age-associated DE
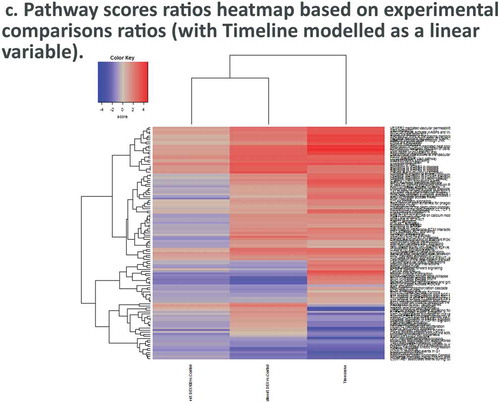
Heirarchical clustering of panel-wide gene expression in DEX-treated samples show clustering most strongly at later timepoints, while at earlier timepoints DEX and Control samples form mixed clusters (). Differential pathway ratios between experimental comparisons showDEX vs. Control and Timecourse variables each have pathway enrichment ratios unique to their respective variables () (–), )).
Figure 4. Dexamethasone vs. Controls Timecourse. (a) Volcano plots for covariates under our GLM-based modeling strategy. (b) Clustering of raw pathway scores. (c) Clustering of differential pathway scores for each experimental comparison.
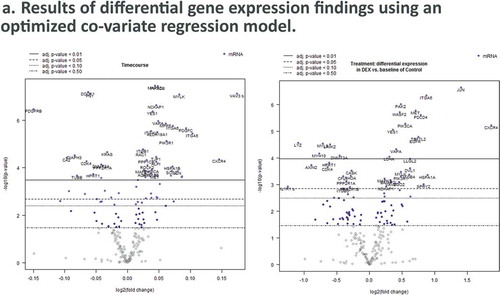
Figure 4. (Continued).
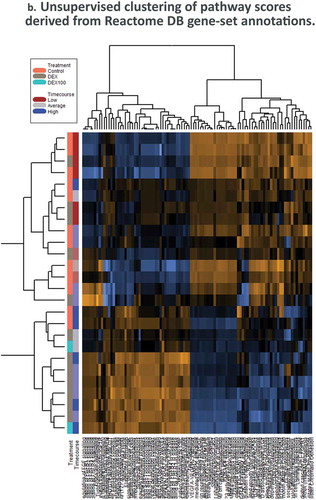
Figure 4. (Continued).
Specific pathways affected include actomyosin stress-fiber assembly and contraction components of the ‘Rho GTPases Activate ROCKs pathway, where transcripts show decreased expression of Myosin 10 (MYH10), regulatory Myosin Light-chain Regulatory Peptide 9 (MYL9), negative regulator of actin stabilization LIM-Domain Kinase 2 (LIMK2), and Calcium/Calmodulin-Dependent Serine/Threonine Kinase (CASK, associated with membrane trafficking and centrosome formation) (,). This decreased expression may represent inhibition of stress-fiber formation and disassembly of the cortical actin cytoskeleton by DEX, resulting in suppression of EMT or ‘partial EMT’ progression.Citation35
Figure 5. Pathway score and GSA results for Dexamethasone vs. Controls Timecourse. (a),(c). Expression of genes associated with RHO GTPases Activate ROCKs ReactomeDB pathway show activity associated with DEX treatment. (b),(d) Expression of genes associated with Apoptotic cleavage of cellular proteins pathway shows activity associated with timecourse, but not with DEX treatments.
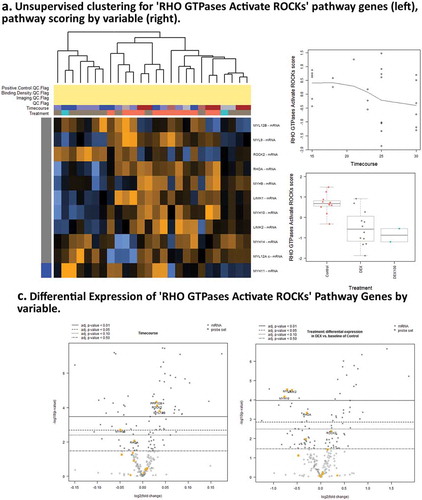
Figure 5. (Continued).
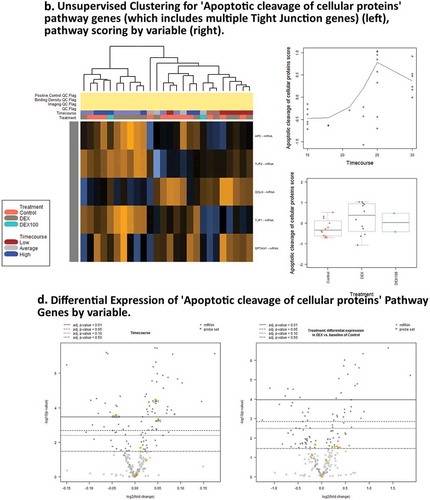
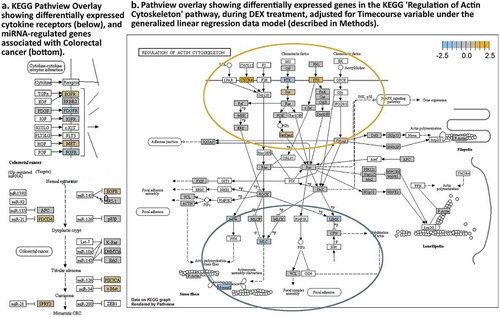
As observed in the full 30-day timecourse, the 15–30-day time variable shows decreased Occludin (OCLN) and increased ZO-1 (TJP) expression, however effects on the tight junction-associated with DEX treatment are insignificant (,). Upstream of the tight-junction pathway, however, significant DE is seen in receptor tyrosine kinases with increased integrins, epithelial growth factor receptor (EGFR) and hepatocyte growth factor receptor (MET) receptor expression, and decreased fibroblast and plasma-derived growth factor receptors (EGFR, PDGFR) ().
Figure 6. KEGG Pathview readouts of DEX vs Control-associated differential gene expression. (a) Differentially expressed cytokine receptors and known miRNA targets in colorectal cancer. (b). KEGG pathway map “Regulation of Actin Cytoskeleton” shows the effects of DEX treatment. (white boxes – not tested).
Ad hoc gene expression biomarker profiles
Differentiation markers
Histological marker for enterocyte differentiation Carbonic Anhydrase 2 (CA2) decreased with time, while colorectal cancer stem marker Aldehyde Dehydrogenase 18A1 (ALDH18A1) increased, indicative of loss of differentiation and increased ‘stemness’ over time.
Putative biomarkers of GI pain and inflammation
Lysozyme (LYZ) is a biomarker for GI inflammation, Citation36 associated with mucous/sodium flux and microbial dysbiosis during stress response. Here LYZ shows showing significantly lowered expression in our DEX-treated cultures (), which in vivo may represent diminished responsiveness to microbiome dynamics. CXCR4 is associated with leukocyte trans-endothelial migration associated cell surface receptor, also previously identified as a putative IBS-associated biomarker.Citation27
Dex-associated c-Jun expression
DEX-associated increase in expression of the pro-survival transcription factor c-JUN () is interesting in light of previous reports that GCR/AP-1 promotor binding suppresses JUN transcription.Citation37 While the observation might result from adenocarcinoma-specific alterations present in the Caco-2 cell line, DEX-associated, Ras-dependent stimulation of c-Jun expression in the rat intestinal epithelial cell line IEC-6 was also reported by Boudreau et al. (1999).Citation38 This provides some indication that DEX-associated c-Jun activation is potentially a general rather than a specific Caco-2 response.
Dexamethasone carrier may contribute significant effects
Dexamethasone is not water-soluble, so is often compounded with a carrier such as a Cyclodextrin molecule which increases the solubility (and bio-availability), of Dexamethasone,Citation39,Citation40 therefore our data should be interpreted as the result of Dexamethasone-Cyclodextrin complex. Beig et al. (2013) and Fine-Shamier et al. (2017) have reported cyclodextrin-based formulations to result in decreased permeability, or pericellular transport, although DEX should remain bioavailable to the epithelial monolayer.Citation41,Citation42 Such carrier effects are an important consideration in pharmacological design and delivery of water-insoluble molecules such as steroid molecules, and understanding the results of Cyclodextrin:Dexamethasone complexes on tissue models isa significant component of GC pharmacokinetics.Citation43
Conclusion
Transcriptomics projects often face noisy data, for which relevant functional signal may be subtle. One common strategy for mitigating noisy signal has been to focus analyses on gene subsets rather a global transcriptome. Here we have implemented an a-priori, pathway-based panel selection, and obtained results relevant to our molecular and cellular pathways of interest. Such dimensionality reduction methods for transcriptome data have proved critical for identifying functional results.Citation44 An expansion for this study should include additional functional cellular tests, for example, protein quantification, cellular proliferation and cell cycle analysis, immunofluorescent imaging of actomyosin and tight-junction protein complexes, and application of higher-throughput data collection methods. Utilization of the cell culture also increasingly includes advanced culture apparatus,Citation45 co-culture systems, organoids, and tissue engineering systems.Citation46 Each of these may have some unique and some general characteristics compared with in vivo tissues, that enhances or limits translational-clinical value of specific findings.
Abbreviations
Author Contributions
Robinson designed the experiments, conceived and designed the custom Nanostring codeset, performed cell cultures, collected TEER data, performed RNA extractions, performed Nanostring protocols and operated the nCounter instrument for each replicate, on-site at the Henderson Lab in the NIH Clinical Center. Robinson performed statistical and bioinformatic analyses using the R-based nSolver™ 4.0 and Advanced Analysis 2.0 software packages, with manual checking of results, and TEER data using R/R-Studio. Robinson wrote the text, provided revisions, and produced figures (see acknowledgments for additional and contributions).
Turkington performed cell culture tasks, RNA extraction, and operation of Nanostring nCounter®.
Abey contributed to development of cell culture workflow and methods, contributed to design of experiments, contributed to Nanostring codeset design and content, and provided comments for the text.
Kenea performed additional cell culture tasks.
Henderson contributed to design of experiments, contributed to the Nanostring codeset design and content, supervised and administered the research, edited and provided revisions to the manuscript.
Supplemental Material
Download Zip (245.2 KB)Acknowledgments
Robinson, Turkington, Kenea were funded through NIH IRTA fellowships. The research was funded to Wendy A. Henderson through 1Z1ANR000018-01-8. Authors acknowledge Ethan Tyler of the NIH Medical Arts Division for his graphic design work on , and Dr Greg Gonye for Nanostring nCounter training.
Disclosure statement
No potential conflict of interest was reported by the authors.
Supplementary material
Supplementary data for this article can be accessed here
Additional information
Funding
References
- Soderholm JD, Perdue MH. Stress and gastrointestinal tract. II. Stress and intestinal barrier function. Am J Physiol Gastrointest Liver Physiol. 2001;280(1):G7–G13. doi:10.1152/ajpgi.2001.280.1.G7.
- Buttgereit F, Burmester G-R, Lipworth BJ. Optimised glucocorticoid therapy: the sharpening of an old spear. The Lancet. 2005;365(9461):801–803. doi:10.1016/S0140-6736(05)17989-6.
- Cain DW, Cidlowski JA. Immune regulation by glucocorticoids. Nat Rev Immunol. 2017;17(4):233–247. doi:10.1038/nri.2017.1.
- Coutinho AE, Chapman KE. The anti-inflammatory and immunosuppressive effects of glucocorticoids, recent developments and mechanistic insights. Mol Cell Endocrinol. 2011;335(1):2–13. doi:10.1016/j.mce.2010.04.005.
- Bruewer M, Hopkins AM, Hobert ME, Nusrat A, Madara JL. RhoA, Rac1, and Cdc42 exert distinct effects on epithelial barrier via selective structural and biochemical modulation of junctional proteins and F-actin. Am J Physiol Cell Physiol. 2004;287(2):C327–35. doi:10.1152/ajpcell.00087.2004.
- Citi S, Guerrera D, Spadaro D, Shah J. Epithelial junctions and Rho family GTPases: the zonular signalosome. Small GTPases. 2014;5(4):1–15. doi:10.4161/21541248.2014.973760.
- Krug SM, Schulzke JD, Fromm M. Tight junction, selective permeability, and related diseases. Semin Cell Dev Biol. 2014;36:166–176. doi:10.1016/j.semcdb.2014.09.002.
- Gonzalez-Mariscal L, Tapia R, Chamorro D. Crosstalk of tight junction components with signaling pathways. Biochim Biophys Acta. 2008;1778(3):729–756. doi:10.1016/j.bbamem.2007.08.018.
- Dorfel MJ, Huber O. Modulation of tight junction structure and function by kinases and phosphatases targeting occludin. J Biomed Biotechnol. 2012;2012:807356. doi:10.1155/2012/807356.
- Schneeberger EE, Lynch RD. The tight junction: a multifunctional complex. Am J Physiol Cell Physiol. 2004;286(6):C1213–28. doi:10.1152/ajpcell.00558.2003.
- Turner JR, Buschmann MM, Romero-Calvo I, Sailer A, Shen L. The role of molecular remodeling in differential regulation of tight junction permeability. Semin Cell Dev Biol. 2014;36:204–212. doi:10.1016/j.semcdb.2014.09.022.
- Hidalgo IJ, Raut TJ, Borchardt RT. Characterization of the human colon carcinoma cell line (Caco-2) as a model system for intestinal epithelial permeability. Gastroenterology. 1989;96(3):736–749. doi:10.1038/nrgastro.2016.142.
- Loren V, Cabré E, Ojanguren I, Domènech E, Pedrosa E, García-Jaraquemada A, Mañosa M, Manyé J, Schneider-Stock R. Interleukin-10 enhances the intestinal epithelial barrier in the presence of corticosteroids through p38 MAPK activity in Caco-2 monolayers: a possible mechanism for steroid responsiveness in ulcerative colitis. PLoS One. 2015;10(6):e0130921. doi:10.1371/journal.pone.0130921.
- Inamochi Y, Mochizuki K, Goda T. Histone code of genes induced by co-treatment with a glucocorticoid hormone agonist and a p44/42 MAPK inhibitor in human small intestinal Caco-2 cells. Biochim Biophys Acta. 2014;1840(1):693–700. doi:10.1016/j.bbagen.2013.10.026.
- Raddatz D, Toth S, Schwörer H, Ramadori G. Glucocorticoid receptor signaling in the intestinal epithelial cell lines IEC-6 and Caco-2: evidence of inhibition by interleukin-1beta. Int J Colorectal Dis. 2001;16:377–383.
- Mochizuki K, Takabe S, Goda T. Changes on histone H3 modifications on the GLUT5 gene and its expression in Caco-2 cells co-treated with a p44/42 MAPK inhibitor and glucocorticoid hormone. Biochem Biophys Res Commun. 2008;371(2):324–327. doi:10.1016/j.bbrc.2008.04.075.
- Zheng G, Victor Fon G, Meixner W, Creekmore A, Zong Y, K. Dame M, Colacino J, Dedhia PH, Hong S, Wiley JW. Chronic stress and intestinal barrier dysfunction: glucocorticoid receptor and transcription repressor HES1 regulate tight junction protein Claudin-1 promoter. Sci Rep. 2017;7(1):4502. doi:10.1038/s41598-017-04755-w.
- Fischer A, Gluth M, Weege F, Pape U-F, Wiedenmann B, Baumgart DC, Theuring F. Glucocorticoids regulate barrier function and claudin expression in intestinal epithelial cells via MKP-1. Am J Physiol Gastrointest Liver Physiol. 2014;306(3):G218–28. doi:10.1152/ajpgi.00095.2013.
- Sääf AM, Halbleib JM, Chen X, Yuen ST, Leung SY, Nelson WJ, Brown PO. Parallels between global transcriptional programs of polarizing Caco-2 intestinal epithelial cells in vitro and gene expression programs in normal colon and colon cancer. Mol Biol Cell. 2007;18(11):4245–4260. doi:10.1091/mbc.e07-04-0309.
- Halbleib JM, Sääf AM, Brown PO, Nelson WJ. Transcriptional modulation of genes encoding structural characteristics of differentiating enterocytes during development of a polarized epithelium in vitro. Mol Biol Cell. 2007;18(11):4261–4278. doi:10.1091/mbc.e07-04-0308.
- Geiss GK, Bumgarner RE, Birditt B, Dahl T, Dowidar N, Dunaway DL, Fell HP, Ferree S, George RD, Grogan T, et al. Direct multiplexed measurement of gene expression with color-coded probe pairs. Nat Biotechnol. 2008;26(3):317–325. doi:10.1038/nbt1385.
- Natoli M, Leoni BD, D’Agnano I, Zucco F, Felsani A. Good Caco-2 cell culture practices. Toxicol In Vitro. 2012;26(8):1243–1246. doi:10.1016/j.tiv.2012.03.009.
- Blume LF, Denker M, Gieseler F, Kunze T. Temperature corrected transepithelial electrical resistance (TEER) measurement to quantify rapid changes in paracellular permeability. Pharmazie. 2010;65:19–24.
- Robinson JM, Henderson WA. Modelling the structure of a ceRNA-theoretical, bipartite microRNA-mRNA interaction network regulating intestinal epithelial cellular pathways using R programming. BMC Res Notes. 2018;11(1):19. doi:10.1186/s13104-018-3126-y.
- Kanehisa M, Goto S. KEGG: kyoto encyclopedia of genes and genomes. Nucleic Acids Res. 2000;28(1):27–30. doi:10.1093/nar/28.1.27.
- Uhlen M, Fagerberg L, Hallstrom BM, Lindskog C, Oksvold P, Mardinoglu A, Sivertsson A, Kampf C, Sjostedt E, Asplund A, et al. Proteomics. Tissue-based map of the human proteome. Science. 2015;347(6220):1260419. doi:10.1126/science.1260419.
- Abey SK, Yuana Y, Joseph PV, Kenea ND, Fourie NH, Sherwin LB, Gonye GE, Smyser PA, Stempinski ES, Boulineaux CM, et al. Lysozyme association with circulating RNA, extracellular vesicles, and chronic stress. BBA Clin. 2017;7:23–35. doi:10.1016/j.bbacli.2016.12.003.
- Bekku S, Mochizuki H, Takayama E, Shinomiya N, Fukamachi H, Ichinose M, Tadakuma T, Yamamoto T. Carbonic anhydrase I and II as a differentiation marker of human and rat colonic enterocytes. Res Exp Med (Berl). 1998;198:175–185.
- Marcato P, Dean CA, Giacomantonio CA, Lee PWK. Aldehyde dehydrogenase: its role as a cancer stem cell marker comes down to the specific isoform. Cell Cycle. 2011;10(9):1378–1384. doi:10.4161/cc.10.9.15486.
- Vandesompele J, De Preter K, Pattyn F, Poppe B, Van Roy N, De Paepe A, Speleman F. Accurate normalization of real-time quantitative RT-PCR data by geometric averaging of multiple internal control genes. Genome Biol. 2002;3(7):RESEARCH0034. doi:10.1186/gb-2002-3-7-research0034.
- Perkins JR, Dawes JM, McMahon SB, Bennett DL, Orengo C, Kohl M. ReadqPCR and NormqPCR: R packages for the reading, quality checking and normalisation of RT-qPCR quantification cycle (Cq) data. BMC Genomics. 2012;13:296. doi:10.1186/1471-2164-13-296.
- Fabregat A, Jupe S, Matthews L, Sidiropoulos K, Gillespie M, Garapati P, Haw R, Jassal B, Korninger F, May B, et al. The reactome pathway knowledgebase. Nucleic Acids Res. 2018;46(D1):D649–D655. doi:10.1093/nar/gkx1132.
- Luo W, Brouwer C. Pathview: an R/Bioconductor package for pathway-based data integration and visualization. Bioinformatics. 2013;29(14):1830–1831. doi:10.1093/bioinformatics/btt285.
- Robinson JM, Abey SA, Kenea N, Henderson WA. A 14-day Dexamethasone timecourse exposure in Caco-2 monolayers results in differential expression of tight-junction and cytoskeleton regulatory pathway genes. bioRxiv. 2018. doi:https://doi.org/10.1101/35552.
- Iden S, Collard JG. Crosstalk between small GTPases and polarity proteins in cell polarization. Nat Rev Mol Cell Biol. 2008;9(11):846–859. doi:10.1038/nrm2521.
- Di Ruscio M, Vernia F, Ciccone A, Frieri G, Latella G. Surrogate fecal biomarkers in inflammatory bowel disease: rivals or complementary tools of fecal calprotectin? Inflamm Bowel Dis. 2017;24(1):78–92. doi:10.1093/ibd/izx011.
- Wei P, Inamdar N, Vedeckis WV. Transrepression of c-jun gene expression by the glucocorticoid receptor requires both AP-1 sites in the c-jun promoter. Mol Endocrinol. 1998;12(9):1322–1333. doi:10.1210/mend.12.9.0158.
- Boudreau F, Caulfield JB, Norton P, Chantler PD, Deziel MR, Slayter HS, Margossian SS. Negative regulation of glucocorticoid-dependent induction of c-fos by ras in intestinal epithelial cells. Mol Cell Biochem. 1999;195(1–2):99–111.
- Tiwari G, Tiwari R, Rai AK. Cyclodextrins in delivery systems: Applications. J Pharm Bioallied Sci. 2010;2(2):72–79. doi:10.4103/0975-7406.67003.
- Muankaew C, Loftsson T. Cyclodextrin-based formulations: a non-invasive platform for targeted drug delivery. Basic Clin Pharmacol Toxicol. 2018;122(1):46–55. doi:10.1111/bcpt.12917.
- Beig A, Agbaria R, Dahan A, Tajmir-Riahi H-A. Oral delivery of lipophilic drugs: the tradeoff between solubility increase and permeability decrease when using cyclodextrin-based formulations. PLoS One. 2013;8(7):e68237. doi:10.1371/journal.pone.0068237.
- Fine-Shamir N, Beig A, Zur M, Lindley D, Miller JM, Dahan A. Toward successful cyclodextrin based solubility-enabling formulations for oral delivery of lipophilic drugs: solubility-permeability trade-off, biorelevant dissolution, and the unstirred water layer. Mol Pharm. 2017;14(6):2138–2146. doi:10.1021/acs.molpharmaceut.7b00275.
- Davis ME, Brewster ME. Cyclodextrin-based pharmaceutics: past, present and future. Nat Rev Drug Discov. 2004;3(12):1023–1035. doi:10.1038/nrd1576.
- Celik S, Logsdon BA, Battle S, Drescher CW, Rendi M, Hawkins RD, Lee S-I. Extracting a low-dimensional description of multiple gene expression datasets reveals a potential driver for tumor-associated stroma in ovarian cancer. Genome Med. 2016;8(1):66. doi:10.1186/s13073-016-0319-7.
- Tan HY, Trier S, Rahbek UL, Dufva M, Kutter JP, Andresen TL, Deli MA. A multi-chamber microfluidic intestinal barrier model using Caco-2 cells for drug transport studies. PLoS One. 2018;13(5):e0197101. doi:10.1371/journal.pone.0197101.
- In JG, Foulke-Abel J, Estes MK, Zachos NC, Kovbasnjuk O, Donowitz M, Hidalgo IJ, Raub TJ, Borchardt RT. Human mini-guts: new insights into intestinal physiology and host-pathogen interactions. Nat Rev Gastroenterol Hepatol. 2016;13(11):633–642. doi:10.1038/nrgastro.2016.142.