
ABSTRACT
Tight junctions between lung alveolar epithelial cells maintain an air–liquid barrier necessary for healthy lung function. Previously, we found that rearrangement of tight junctions from a linear, cortical orientation into perpendicular protrusions (tight junction spikes) is associated with a decrease in alveolar barrier function, especially in alcoholic lung syndrome. Using quantitative super-resolution microscopy, we found that spikes in control cells were enriched for claudin-18 as compared with alcohol-exposed cells. Moreover, using an in situ method to measure barrier function, tight junction spikes were not associated with localized increases in permeability. This suggests that tight junction spikes have a regulatory role as opposed to causing a physical weakening of the epithelial barrier. We found that tight junction spikes form at cell–cell junctions oriented away from pools of β-catenin associated with actin filaments, suggesting that adherens junctions determine the directionality of tight junction spikes. Dynamin-2 was associated with junctional claudin-18 and ZO-1, but showed little localization with β-catenin and tight junction spikes. Treatment with Dynasore decreased the number of tight junction spikes/cell, increased tight junction spike length, and stimulated actin to redistribute to cortical tight junctions. By contrast, Dynole 34–2 and MiTMAB altered β-catenin localization, and reduced tight junction spike length. These data suggest a novel role for dynamin-2 in tight junction spike formation by reorienting junction-associated actin. Moreover, the greater spatial separation of adherens and tight junctions in squamous alveolar epithelial cells as compared with columnar epithelial cells facilitates analysis of molecular regulation of the apical junctional complex.
Introduction
Lung epithelia provide a selective and specific barrier that maintains separation between external airspaces and internal fluid-filled tissues to enable gas exchange to occurCitation1. It also serves as the first line of defense from threats as varied as invading pathogens and direct injury. Disruption of alveolar lung fluid balance can lead to acute respiratory distress syndrome (ARDS), which is characterized by widespread flooding of the alveoli. Chronic alcohol consumption can perturb normal lung fluid balance, increasing the risk of developing ARDS.Citation2,Citation3
Epithelial barrier function is critically regulated by tight junctions, multiprotein complexes integrated into the plasma membrane of cells that act as selectively permeable barriers between neighboring cells.Citation4–6 We have previously observed that alveolar epithelial cells under stress, such as chronic exposure to alcohol, reorganize tight junctions into unidirectional protrusions oriented toward the nucleus, referred to as tight junction spikes.Citation7 There is a correlation between tight junction spikes and deficits in alveolar epithelial barrier function, where monolayer permeability (leak) increases with an increasing number of cells containing spikes.Citation8 However, the molecular composition of tight junction spikes and mechanisms by which spikes are regulated have not been fully characterized.
Here primary rat alveolar epithelial cells were used to further investigate the characteristics of tight junction spikes. Surprisingly, the molecular composition of tight junction spikes was sensitive to chronic alcohol exposure, in that alveolar epithelial cells from alcohol-fed rats showed a more uniform distribution of claudin-18 relative to ZO-1 as compared with unexposed cells that had spikes enriched for claudin-18. Alveolar epithelial cells also provided a unique platform to define the relative orientation of adherens junctions to tight junctions and tight junction spikes, since their squamous morphology provided spatial separation between these different elements of the apical junctional complex that is not readily observed in columnar cells. We also identified novel roles for dynamin-2 in regulating tight junction spike formation. Although dynamin inhibitors have previously been shown to inhibit endocytosis in alveolar epithelial cells,Citation9,Citation10 our findings are consistent with dynamin-regulating tight junction spikes as an actin bundling protein.Citation11–15
Materials and methods
Primary alveolar epithelial cell isolation
All animal protocols were reviewed and approved by the Institutional Animal Care and Use Committee of Emory University and performed with the approval of the Division of Animal Resources. Adult male Sprague Dawley rats (150–200 g, Charles River Laboratory) were used as a source of primary alveolar epithelial cells. In most cases, rats were given standard chow and water ad libitum. For experiments using the chronic alcohol rat model, Sprague Dawley rats (50–100 g, Charles River Laboratory) were pair-fed an ethanol or control isocaloric maltose-dextrin Lieber–DeCarli liquid diet (Research Diets) ad libitum for 6–8 weeks prior to cell isolation.Citation8
Type II AECs were isolated from rats according to Dobbs with modifications.Citation16 Lungs were perfused with PBS with calcium and magnesium, then removed and lavaged with solution II (5.5 mM Dextrose, 10 mM HEPES, 2 mM CaCl2, 1.3 mM MgSO4, 140 mM NaCl, 5 mM KCl, pH 7.4). Elastase (1.6 units/ml, Worthington, LS002292) was instilled and continually circulated in lavaged lungs while incubating in a 37°C water bath for 30–45 minutes. The lungs were then manually dissected into 1 mm3 pieces, taking care to remove the trachea and bronchial tissue. Diced lungs were resuspended in 5 ml fetal bovine serum (FBS) and 5 ml DNase solution (≥400 Kunitz units/ml in solution II, Sigma DN25). Lung suspensions were incubated for 10–20 minutes with gentle rotation in a 37°C water bath. Lung suspensions were then filtered through a 100-µm cell strainer (Greiner Bio-one, 542–000) followed by a 40-µm cell strainer (Greiner Bio-one, 542–040). Filtered cell suspensions were centrifuged at 250 g for 8 minutes. Remaining red blood cells were removed from cell pellets by resuspending in 5 ml of 0.87% ammonium chloride in 10 mM Tris (pH 7.6) for 5 minutes. 10 ml of Dulbecco’s Modified Eagle Media (DMEM; Corning 10–013-CV) containing 10% FBS (Atlanta Biologicals S11550), 100 U/ml penicillin (Sigma P4333), 10 mg/ml streptomycin (Sigma P4333), 0.25 µg/ml amphotericin B (VWR, 0414–1 G), and 50 µg/ml gentamycin (Sigma G1397) were added to the cell suspension, which was then centrifuged at 250 g for 8 minutes. The cells were resuspended in 30 ml of DMEM and biopanned to remove macrophages on rat IgG (0.5 mg IgG/ml 10 mM Tris buffer, pH 9.5, Sigma I8015)-coated cell culture grade petri dishes (Genesee Scientific 25–202) for 1 h at 37°C. Cell isolations using this method routinely obtained 90–95% Type II AECs cell suspensions.
To produce model Type I AEC monolayers, isolated Type II AECs were plated on rat tail Type-I collagen (20 µg/ml, Roche 111791790)- coated 12-mm Transwell-permeable supports (500,000 cells) or 12 mm #1.5 H coverslips (250,000 cells, Electron Microscopy Sciences 72290–01) unless otherwise stated. Cells were plated and refed every other day using DMEM. Cells differentiated into a confluent model Type I AEC monolayer after 4–5 d, and cells were used for experiments on d 5 or 6.
Virus transduction
AECs were transduced with adenovector encoding a NH2-terminal enhanced YFP-claudin-18 or untagged claudin-5 on d 4 or 5 after isolation. Adenovector was added to media at the stated multiplicity before bilaterally dispensing on cells. Cells were analyzed 48 h after virus addition unless otherwise stated.
Localized permeability assay
The XPerT assay was performed according to Dubrovskyi et al. with modifications.Citation17 Bovine skin Type B gelatin (Sigma) was dissolved in 0.1 M bicarbonate buffer (pH 8.3) to a final concentration of 10 mg/ml gelatin. Gelatin was stirred while heated in a water bath at 70°C until completely dissolved. EZ-link NHS-LC-LC-biotin (Thermo) dissolved in DMSO to a concentration of 5.7 mg/ml was added to gelatin to a final concentration of 0.57 mg/ml biotin. Biotin/gelatin solution was aliquoted and frozen until needed. Biotin/gelatin-coated coverslips were prepared by diluting 0.57 mg/ml biotin with 0.1 M bicarbonate buffer (pH 8.3) to a final concentration of 0.25 mg/ml biotin and sterilized using a 0.22-µm Steriflip filter. Diluted biotin/gelatin was then added to coverslips and placed on a rocker at 4°C overnight. Excess biotin/gelatin was removed by washing coverslips twice with warmed PBS with calcium and magnesium before plating cells.
AECs were plated on biotin/gelatin-coated coverslips and allowed to differentiate for 5 d. AECs were incubated with 25 µg/ml FITC-avidin (Invitrogen 434411) in serum-free DMEM media with 100 U/ml penicillin (Sigma P4333), 10 mg/ml streptomycin (Sigma P4333), 0.25 µg/ml amphotericin B (VWR, 0414–1 G), and 50 µg/ml gentamycin (Sigma G1397) for 5 min unless otherwise stated. AECs were then washed and fixed for ZO-1 immunofluorescence as described below.
Paracellular permeability
Transepithelial resistance (TER) and paracellular permeability were measured on model Type I AECs plated on Transwell-permeable supports. Cells were incubated in Ringer’s saline buffer (150 mM NaCl, 2 mM CaCl2, 1 mM MgCl2, 10 mM glucose, and 10 mM HEPES pH 7.4) 15 min prior to TER measurement and dye addition. TER was measured using an Ohmmeter (World Precision Instruments, Sarasota, FL). Paracellular dye permeability was assessed by simultaneous measurement of two different-sized fluorescent dyes, 2 µg/ml Calcein (0.62 kDa) (ThermoFisher) and 50 µg/ml Texas Red Dextran (10 kDa, ThermoFisher), in Ringer’s saline buffer added to the apical chamber. The amount of dye that diffused to the basolateral chamber over a 2-h incubation was measured using a microplate reader (Biotek Winooski, VT).
Dynamin inhibitor treatment
AECs were plated on collagen-coated coverslips and differentiated to a model Type I AEC monolayer as described above. On d 4 after cell plating, AEC media was changed to serum-free DMEM. On d 5, cells were treated for varying amounts of time with 160 µM Dynasore (Abcam ab120192), 10 µM Dynole 34–2 (Abcam ab120463), or 30 µM MiTMAB (Abcam ab120466) in serum-free DMEM. Cells were then prepared for immunofluorescence as described. All inhibitors were dissolved in DMSO (Sigma D2438), with 0.25% DMSO used as a vehicle control.
Cytoskeleton inhibitor treatment
AECs were plated on collagen-coated coverslips and differentiated to a model Type I AEC monolayer as described above. On d 4 after cell plating, AEC media was changed to serum-free DMEM. On d 5, cells were treated for 10, 30, 60 or 120 min with 10 µM Blebbistatin (Sigma B0560), 1 µM Latrunculin A (Sigma L5163), or 1 µM Jasplakinolide (Sigma 4580) in serum-free DMEM. Cells were then prepared for immunofluorescence as described. All inhibitors were dissolved in DMSO (Sigma D2438), and 0.25% DMSO was used as a vehicle control.
Immunoblot
Model Type I AECs were washed twice with PBS containing calcium and magnesium and incubated for 30 minutes on ice with RIPA buffer (Cell Signaling) containing Complete Protease Inhibitor Cocktail (Roche 4693132001). Cells were scraped and collected, then briefly sonicated on ice. Protein pellets were centrifuged for 10 minutes at 13,200 g at 4°C. Protein concentration was determined by BCA assay (Thermo Fisher Scientific 23225). Reducing SDS sample buffer (10% glycerol, 1.25% SDS, 50 mM Tris pH 6.7 and 8.3 mg/ml dithiothreitol) was added to supernatant. SDS sample buffer-protein samples were heated at 70°C for 10 minutes. Proteins were resolved by SDS-PAGE using 4–20% Mini-PROTEAN TGX stain-free gradient SDS-polyacrylamide gels, then transferred to nitrocellulose membranes (Bio-Rad 1704270). The primary antibodies used for protein detection were rabbit anti-dynamin-1 (1:1,500, Abcam ab3465), rabbit anti-dynamin-2 (1:1,500, Abcam ab65556), and mouse anti-β-actin (1:10,000, Sigma A5441). The secondary antibodies used were goat anti-rabbit IgG IRDye 800CW (1:20,000, LI-COR) and goat anti-mouse IgG IRDye 680RD (1:20,000, LI-COR). Membranes were imaged using a Bio-Rad ChemiDoc MP Imaging System. Relative protein quantification was relative to actin. LI-COR fluorescent images of immunoblots were pseudocolored to grayscale images in the figures.
HA-dynamin-1, HA-dynamin-2, and HA-dynamin-3 in expression vectors were obtained from Addgene. Lipofectamine 2000 (Invitrogen 11668–027) was used to transfect HeLa cells with the specified plasmid in Optimem media (Gibco 51985–034) containing 14 µg DNA added to 12 µl Lipofectamine 2000. After 48 h, cells were harvested, pelleted and resuspended in SDS-PAGE sample buffer for analysis by immunoblot.
Immunofluorescence
Cell monolayers were washed twice with PBS containing calcium and magnesium, then fixed for 10 min with 4% paraformaldehyde in PBS. Cells were then washed once with PBS and incubated with 1 M glycine for 5 min. Cells were washed twice with PBS before being permeabilized with 0.5% Triton X-100 (Fisher Scientific BP151-500) in PBS for 5 min. Cells were blocked twice for 5 min with 0.5% Triton-X100 + 3% bovine serum albumin (BSA, Fisher BP1600-100) in PBS. Primary antibodies were prepared in 3% BSA in PBS and incubated overnight at 4°C. Cells were washed three times with 3% BSA in PBS and then incubated with secondary antibodies prepared in 3% BSA in PBS for 1 h at room temperature. Cells were washed three times with 3% BSA in PBS followed by three washes with PBS before mounting slides to coverslips. ProLong Diamond mounting solution (Invitrogen P36961) was used to mount slides. Slides were allowed to dry at room temperature overnight, then were sealed with clear sealant.
The following primary antibodies were used for immunofluorescence: rabbit anti-dynamin-2 (1:200, Abcam ab65556), rabbit anti-claudin-18 (1:200, Thermo Fisher 700178), rabbit anti-claudin-18 (1:125, Thermo Fisher 388100), rabbit anti- β-catenin (1:400, Abcam ab32572), mouse anti-ɑ-catenin (1:250, Invitrogen 13–9700), mouse anti-ZO-1 (1:500, Invitrogen 339100), and rabbit anti-ZO-1 (1:500, Invitrogen 40–2300).
The following secondary stains were used for immunofluorescence: goat anti-rabbit IgG Texas Red (1:500, Jackson 111–075-144), goat anti-mouse IgG Cy2 (1:1000, Jackson 115–225-166), goat anti-rabbit IgG Cy2 (1:1000, Jackson 115–165-166), goat anti-mouse IgG Cy3 (1:1000, Jackson 111–225-144), goat anti-rabbit IgG AlexaFluor 488 (1:500, Abcam ab150073), goat anti-mouse IgG AlexaFluor 594 (1:500, Abcam ab150116), goat anti-rabbit IgG AlexaFluor 594 (1:500, Invitrogen R37117), phalloidin-AlexaFluor-405 (1:40, Thermo A30104).
Slides were blinded before imaging. Widefield images were collected on using an Olympus IX70 microscope with a U-MWIBA filter pack (BP460-490, DM505, BA515-550) or U-MNG filter pack (BP530-550, DM570, BA590-800). Minimum and maximum intensities for images were adjusted in parallel so that the intensity scale remained linear to maximize dynamic range. Spike length measurements were collected using the freehand line drawing tool in ImageJ to trace tight junction spikes. Intensity along tight junction spikes was measured on traced tight junction spikes in merged two-channel images using the BAR plug-in multi-channel plot tool.
Stimulated emission depletion microscopy (STED)
AECs from control-fed and alcohol-fed Sprague Dawley rats were plated on coverslips coated with rat tail Type-I collagen (20 µg/ml, Roche 111791790). Immunolabeling was performed as described above with modifications. Cells were washed with PBS and fixed with 4% PFA as described above, treated with 1:1 methanol/acetone for 3 min at room temperature, permeabilized for 5 min with 0.5% Triton-X100 (Fisher Scientific BP151-500) in PBS, then blocked twice for 5 min with 5% goat serum (Sigma G6767) in PBS containing 0.5% Triton-X100. Primary antibodies were made in 5% goat serum in PBS and incubated on cells overnight at 4°C. Cells were washed three times for 5 min with 5% goat serum in PBS, then incubated with secondary antibodies in 5% goat serum in PBS for 1 h at room temperature. Cells were washed three times for 5 min with 5% goat serum in PBS, three times for 5 min with PBS. Coverslips were then mounted on slides using Abberior TDE mounting media (Abberior). Primary antibodies used were rabbit anti-claudin-18 (1:125, Invitrogen 388000) and mouse anti-ZO-1 (1:200, Invitrogen 339100). Secondary antibodies used were goat anti-rabbit IgG STAR580 (1:100, Abberior) and goat anti-mouse IgG STARRED (1:100, Abberior). Samples were imaged using an Abberior easy3D STED Expert Line system with Olympus IX83 inverted body microscope, Olympus Objective UPlanSApo 100x/1.40NA oil, and Excelitas APD detectors. Data were collected and analyzed using Abberior ImSpector software. Samples were excited with 561 nm and 640 nm pulsed laser lines and depleted with a 775 nm pulsed STED laser line.
Structured illumination microscopy (SIM)
Wild-type AECs were plated on coverslips coated with rat tail Type-I collagen (20 µg/ml, Roche 111791790). Cell fixation with PFA alone, permeabilization and immunolabeling were performed as described above. Primary antibodies used were rabbit anti- β-catenin (1:400, Abcam ab32572) and mouse anti-ZO-1 (1:200, Invitrogen 339100). Secondary antibodies used were goat anti-rabbit IgG AlexaFluor 488 (1:500, Abcam ab150073) and goat anti-mouse IgG AlexaFluor 594 (1:500, Abcam ab150116). Samples were imaged using a Nikon N-SIM system with a Nikon Eclipse Ti inverted body microscope, Apo TIRF 100x/1.49NA oil objective, and Andor iXon3 DU-897 X-6034 EMCCD camera. Samples were excited with 488 nm and 561 nm laser lines. Z-stacks (16 steps/z-series, step-size of 0.1 µm) were collected. Images were taken in 1024 × 1024 with a pixel size of 31.4 nm pixels resolution with excitation laser power of 0.5% (488) and 15.2% (561) to minimize photobleaching. Data were collected and processed using NIS-Elements AR 5.20.01 software (Nikon) and some processing using ImageJ.Citation18 Minimum and maximum intensities for images were adjusted in parallel so that the intensity scale remained linear to maximize dynamic range.
Live-cell imaging
AECs were plated onto glass-bottom chamber slides (Lab-Tek II 155382) coated with rat tail Type I-collagen (20 µg/ml, Roche 111791790). On d 4, cells were transduced with adenovirus encoding YFP-claudin-18 with a multiplicity of infection of 20. Media was changed 24 h after transduction and 1 h before live-cell imaging to phenol red-free DMEM media (Sigma D1145) containing 10% FBS (Atlanta Biologicals S11550), 100 U/ml penicillin (Sigma P4333), 10 mg/ml streptomycin (Sigma P4333), 0.25 µg/ml amphotericin B (VWR, 0414–1 G), and 50 µg/ml gentamycin (Sigma G1397) before being moved to a Tokai Hit STXG stagetop incubator heated at 37°C with 5% CO2. In some samples, cells were treated with 80 µM Dynasore for 10 min prior to imaging. Under those conditions, 2 out of 35 spikes increased in length and none of them became shorter. All images were collected with a Nikon A1R HD25 confocal unit on a Nikon Ti2-E equipped with a Plan Apo λ 20x/0.75NA lens and the Perfect Focus System for maintenance of focus over time. EYFP fluorescence excitation was with the 20 mW 488 DPSS laser in a LU-NV unit (selected with an Acousto-Optic Tunable Filter (AOTF)) and collected with a 525/50 filter. Confocal images were collected with a GaAsP PMT using an 8 kHz resonant scanner with 16× averaging. Data were collected using NIS-Elements AR 5.20.01 software (Nikon). Imaging was performed over a time period of 35.5 min at several multipoint locations with z-stacks (3 z-series/time-point/multipoint position, step-size of 0.85 µm) collected at 30 s intervals using an 8 kHz resonant scanner. Images were taken in 1024 × 1024 with a pixel size of 155 nm pixels resolution with excitation laser power of 1.3% to minimize photobleaching (excitation 488 nm with 525/50 emission filter cube). All z-stacks are displayed as a maximum z-projection image. Images and movies were processed with ImageJ.Citation18 Minimum and maximum intensities for images were adjusted in parallel so that the intensity scale remained linear to maximize dynamic range.
Statistics
All statistics were calculated using GraphPad Prism 8.0. Statistical significance for parametric data was determined using unpaired two-tailed t-test to compare one dependent variable against on independent variable. One-way analysis of variance with Tukey’s multiple comparisons test was used to compare one dependent variable against multiple independent variables. Two-way analysis of variance with Tukey multiple comparisons test was used to compare multiple dependent variables against multiple independent variables. Nonparametric data used the Mann–Whitney U-test. Data in graphs represent average ± SD.
Results
Morphological classification of tight junction spikes
Stimulated emission depletion (STED) super-resolution immunofluorescence microscopy revealed a broad range of tight junction spike morphologies in alveolar epithelial cells (AECs; ). These could be categorized as short triangular protrusions, thinner spikes with triangular bases, and elongated spikes with and without bulbous ends. The range of spike morphologies and lengths observed using STED microscopy suggested that shorter triangular protrusions might lengthen to form spikes. While STED microscopy allowed better resolution to distinguish the range of spike morphologies (Supplemental Figure 1), differences in spikes could also be resolved by standard confocal immunofluorescence microscopy, which enabled us to examine spikes in AECs expressing EYFP-claudin-18 by live cell microscopy. Previously, we used this approach to demonstrate that tight junction spikes are sites of active vesicle budding and fusion.Citation8 However, vesicle budding and fusion mainly occurred on elongated spikes, which, over a 30–40 min time course, did not show obvious changes in length.Citation8 To further investigate changes in spike length, we screened fields from two independent preparations and identified 55 tight junction spikes, of which only two showed an increase in length of at least 2 µm over a ~30 min period of observation (); Supplemental Movie 1). This suggests that spikes are relatively stable structures and that their formation is a rare event.
Figure 1. Morphological diversity of tight junction spikes. (a) AECs isolated from Sprague Dawley rats were cultured on collagen-coated coverslips for 6 d. The cells were then fixed, permeabilized, immunolabeled for claudin-18 and analyzed by stimulated emission depletion (STED) super-resolution microscopy, Bar: 2.5 µm. Images are representative of n = 14 fields collected from three coverslips from N = 2 biological replicates. (b) Diagram showing different morphological profiles of tight junction spikes observed by immunofluorescence. (c) Live-cell imaging of AECs expressing EYFP-cldn-18 showing two examples of tight junction spikes increasing in length over a 30-min period of observation (arrows). Bar: 2.5 µm
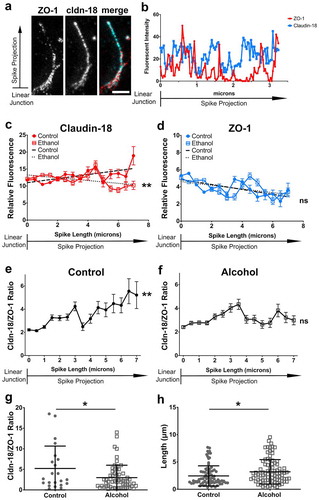
We then used STED microscopy to image claudin-18 and ZO-1 localization in tight junction spikes. Super-resolution microscopy revealed that these tight junction proteins were not uniformly distributed along the length of spikes, since there were regions that were enriched for claudin-18, ZO-1 or showed equivalent amounts of both proteins (). Given these differences, we quantified the distribution of claudin-18 and ZO-1 in line scans of tight junction spikes in AECs isolated from either control-fed rats or from rats fed an alcohol diet, conditions that increase the formation of tight junction spikes and also increase paracellular leak across tight junctions.Citation8 Tight junction spikes from control AECs showed an increase in claudin-18 and a decrease in ZO-1 along the length of spikes (). By contrast, spikes in alcohol-exposed AECs showed a decrease in claudin-18 along spike length, which paralleled the decrease in ZO-1. The difference between spikes in control vs alcohol-exposed AECs was more readily apparent when the claudin-18/ZO-1 ratio was calculated (), where spikes from control AECs had an overall enrichment in claudin-18 relative to ZO-1 along spike length as compared with spikes from alcohol-exposed AECs. The claudin-18/ZO-1 ratio at the end of spikes (7 μm) was significantly higher in control AECs compared with alcohol AECs ()), and the average spike length was longer in alcohol AECs compared with control AECs ()). This supports a model where claudin-18 differentially associates with tight junction scaffold proteins and is impacted by chronic exposure to alcohol, consistent with previous observations,Citation8 where the majority of claudin-18 interacting with ZO-1 was localized to tight junctions themselves and not along tight junction spikes. The functional significance of differences in claudin-18 engagement to scaffold proteins remains an open question, although our data showing that tight junction spikes from control AECs are shorter suggests that one role of enhanced claudin-18 expression is to limit spike growth.
Figure 2. Distribution of claudin-18 and ZO-1 differs along length of tight junction spikes. (a) AECs isolated from control and alcohol-fed Sprague Dawley rats were cultured on collagen-coated coverslips for 6 d. The cells were then fixed, permeabilized, immunolabeled for ZO-1 (red) and claudin-18 (cyan), and analyzed by stimulated emission depletion (STED) super-resolution microscopy. Shown is an example of an individual tight junction spike. Bar: 1 µm. (b) Line scans of the image in (a) show differential distribution of ZO-1 and claudin-18. (c,d) Aggregate intensity data of claudin-18 (c) and ZO-1 (d) calculated as mean ± SD from control AECs (2 biological replicates, 84 spikes) and alcohol-exposed AECs (2 biological replicates, 92 spikes). Trend lines show claudin-18 intensity increased with spike projection length for control AECs and decreased for alcohol-exposed AECs (**p = .0014, simple linear regression with slope comparison);, however, ZO-1 intensity decreased for both classes of AECs (ns – not significant, simple linear regression with slope comparison). (e, f) The claudin-18/ZO-1 ratio increased for spikes in control AEC (** p = .0016, one-way ANOVA with Tukey’s test of multiple comparisons) but not for alcohol-exposed AECs (ns – not significant). (g) The claudin-18/ZO-1 ratio at 7 µm was higher for spikes from control AECs (n = 22) vs alcohol exposed AECs (n = 43) (* p = .021, unpaired two-tailed t-test). (h) The average length of alcohol spikes was longer compared to control spikes, as determined by ZO-1 immunofluorescence. Images are representative of n = 178 spikes imaged across 14 fields from three coverslips from N = 2 biological replicates
Tight junction spikes are not sites of increased paracellular leak
There are several lines of evidence correlating an increase in tight junction spikes with increased barrier permeability.Citation8,Citation19,Citation20 We thus hypothesized that tight junction spikes might correspond to areas which are prone to increased paracellular permeability. To define where AEC monolayers were preferentially permeable to macromolecules, we employed the XPerT assay, which is based on the ability of FITC-avidin (~67 kDa) to have access to biotinylated residues conjugated to the extracellular matrix.Citation17 For this assay, freshly isolated AECs were plated on biotin/gelatin-coated coverslips and allowed to differentiate for into amodel Type I cell monolayer. The monolayers were then incubated with FITC-avidin for 5 minutes, followed by fixation and immunofluorescence staining for ZO-1 as a marker for tight junctions (, Supplemental Figure 2). Control AECs showed little FITC-avidin labeling, consistent with their forming a tight monolayer; however, there were some foci that did show increased permeability ().
Figure 3. Claudin-5 induced paracellular leak is localized. (a–e) AECs isolated from Sprague Dawley rats were cultured on biotinylated gelatin-coated coverslips for 6 d. The live cells were then incubated with FITC-avidin (cyan) for 5 minutes, then fixed and immunolabeled for ZO-1 (red). Two different examples of fields are shown in (a, b). Line scans of representative areas containing a linear tight junction (c), a tight junction spike (d) or a localized area with increased permeability (e) are shown where the blue line represents FITC-avidin and the red line represents ZO-1. Dashed lines in merged images denote where line scans were taken. (f) AECs were cultured on biotinylated gelatin-coated coverslips and transduced at d 2 with claudin-5 (AdCldn-5) at MOI = 25 . AECs were further cultured for a total of 6 d before labeling with FITC-avidin and ZO-1, which revealed several areas of enhanced FITC-avidin permeability. A line scan of an area with enhanced permeability is shown in (g). (h) AdCldn-5 transduced cells were significantly more permeable to FITC-avidin as compared with untreated AECs (* p = .015, unpaired two-tailed t-test). Images are representative of n = 26 control fields and 26 AdCldn-5 fields collected from N = 4 individual coverslips. Bars: 10 µm
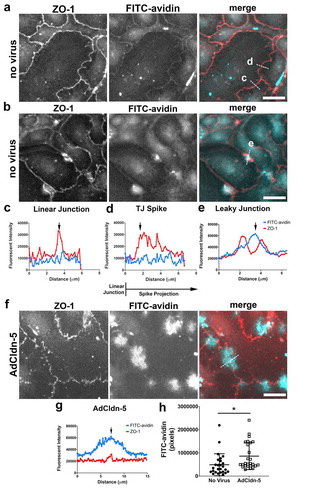
We then performed the XPerT assay on AECs that were transduced with claudin-5, which we previously determined was necessary and sufficient to mimic the effects of chronic alcohol exposure on AECs, namely, increased formation of tight junction spikes, increased paracellular leak and decreased TER.Citation8 As shown in , AECs expressing increased claudin-5 showed increased paracellular leak as compared with control AECs. There were multiple sites labeled with FITC-avidin in claudin-5 expressing AECs; however, these sites corresponded to areas with significant discontinuities in ZO-1 localization, as opposed to sites containing tight junction spikes. These data suggest that spikes in and of themselves are not prone to paracellular leak to macromolecules, and instead more likely to have a different, as yet undetermined role in regulating AEC barrier function.
Adherens junctions are asymmetrically opposed to tight junction spikes
Adherens junctions associate closely with tight junctions as part of the apical junctional complex and regulate tight junction formation.Citation21–23 Since tight junction spikes orient asymmetrically from cell–cell junctions, we examined the localization of the adherens junction protein β-catenin to determine where it was localized relative to claudin-18 and ZO-1 containing tight junction spikes. Immunostaining of AECs demonstrated that β-catenin was asymmetrically localized, relative to tight junctions, and only partially overlapped with ZO-1 and claudin-18 (), consistent with our previous qualitative analysis.Citation19
Figure 4. Asymmetric localization of β-catenin relative to tight junction spikes. (a) AECs isolated from control Sprague Dawley rats were cultured on collagen-coated coverslips for 6 d. The cells were then fixed, permeabilized, immunolabeled for β-catenin (red) and ZO-1 (cyan) and imaged by immunofluorescence microscopy. The majority of β-catenin preferentially localized to areas opposed to sites containing tight junction spikes. Squares indicate magnified areas. Most β-catenin localized at the opposing side of tight junction spikes at bicellular junctions (arrows), but some β-catenin localized adjacent to tight junction spikes (arrowheads). There was occasional β-catenin localized at or near the ends of tight junction spikes, but most spikes did not contain β-catenin. (b) The number of regions containing β-catenin opposed to tight junction spikes was significantly higher than the number of β-catenin regions coincident with tight junction spikes (**** p < .0001; 5 biological replicates, n = 751 regions of interest; unpaired two-tailed t-test, average ± SD). (c) β-catenin (red) predominantly localized opposite to spike-associated Claudin-18 (cyan) (arrows) and occasionally adjacent to Claudin-18 (arrowheads). Images are representative of four independent experiments. Bars: 10 µm
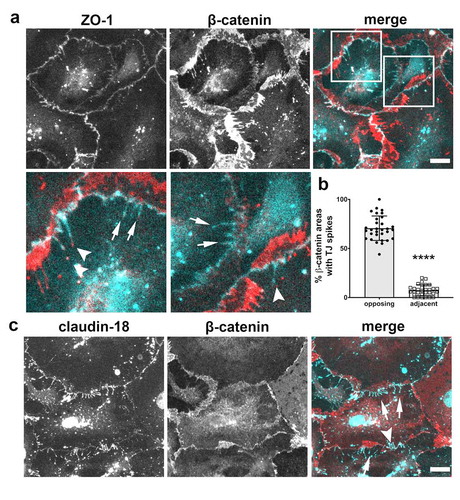
We then quantified the orientation of β-catenin in areas where it was adjacent to tight junction spikes from four independent preparations ()). Of 751 identified sites with a high concentration of β-catenin, 582 were localized at areas adjacent to sites where tight junction spikes containing ZO-1 were present. Interestingly, β-catenin containing plaques were overwhelmingly oriented away from tight junction spikes, with an average of 71% of them protruding away from β-catenin. β-catenin showed a similar pattern of localization adjacent to tight junction spikes labeled for claudin-18 ()) and, by contrast, colocalized with α-catenin (Supplemental Figure 2).
This analysis benefitted from the squamous morphology of AECs, which showed good separation between adherens junctions and tight junctions. Whether these morphological hallmarks also occur in columnar epithelial cells remains an open question, primarily since adherens junction and tight junction proteins imaged in the x-y plane of focus normally appear as a continuous overlapping band demarking the circumference of each cellCitation24,Citation25 and the x-z plane is more difficult to resolve in columnar cells.
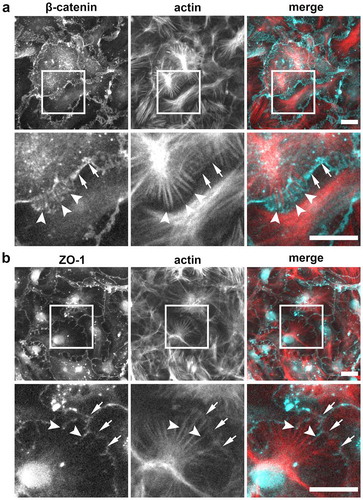
Adherens junctions and tight junctions both interact with the actin cytoskeleton, specifically through scaffold proteins such as catenins and ZO-1, respectively.Citation26–29 To visualize co-localization of these proteins with the actin cytoskeleton, we double labeled AECs with Alexa 405-phalloidin, labeling actin, along with either anti-β-catenin or anti-ZO-1 (). AECs had prominent actin filaments that radiated from a central point in the interior of the cell, that co-localized with β-catenin at the terminal ends ()). Tight junction spikes also co-localized with radiating actin filaments, with spikes projecting along actin filaments toward the cell interior ()). In addition to actin filaments, we observed faintly visible cortical actin that co-localized with ZO-1 at AEC tight junctions as previously described.Citation19
Figure 5. Localization of β-catenin and ZO-1 relative to actin stress fibers. (a) AECs isolated from Sprague Dawley rats were cultured on collagen-coated coverslips for 6 d. The cells were then fixed, permeabilized, and immunolabeled for β-catenin (cyan) and actin (red). Squares show position of magnified regions below. Arrows indicate β-catenin at intercellular linear junctions. Actin filaments appear to terminate in regions containing high levels of β-catenin (arrowheads). (b) AECs double labeled with ZO-1 (cyan) and actin (red) show tight junction spikes aligning along actin filaments (arrowheads) distinct from ZO-1 at linear intercellular junctions (arrows). Images are representative from three independent experiments. Bars: 10 µm
We further verified that actin filaments play a role in organizing the orientation of adherens junctions and tight junctions by analyzing the effect of the Blebbistatin,Citation30 Jasplakinolide,Citation31 or Latrunculin ACitation32 on β-catenin and ZO-1 (Supplemental Figure 4). Despite the different mechanisms of action for each of these drugs, in each case the organization of β-catenin in large plaques was disrupted. Of note, the non-muscle myosin inhibitor Blebbistatin altered the distribution of β-catenin while maintaining filamentous actin, suggesting that cytoskeletal tension is required to maintain the relative orientation of β-catenin to tight junction spikes in AECs.
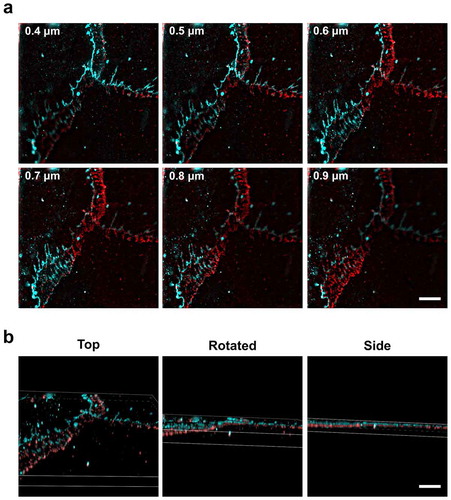
As squamous cells, overlap of AECs in culture is common. Given that AECs are squamous and very thin (~1–2 µm), we developed a 3D imaging approach using structured illumination microscopy (3D-SIM) which can resolve 0.1 µm sections in the x-z dimension. As shown in ), ZO-1 could be distinguished from β-catenin in images taken at different z-axis sections, where ZO-1 was above β-catenin. The 3D reconstruction ()) illustrates how ZO-1 and β-catenin are differentially localized suggesting the formation of adherens junctions in the overlap zone between AECs beyond the site of tight junction formation.
Figure 6. Lateral organization of ZO-1 above β-catenin revealed by 3D structured illumination microscopy. (a) AECs isolated from Sprague Dawley rats were cultured on collagen-coated coverslips for 6 d. The cells were then fixed, permeabilized, and immunolabeled for β-catenin (red) and ZO-1 (cyan). Individual slices from z-stacks using 3D structured illumination microscopy (SIM) revealed z-stack separated tight junctions and adherens junctions at asymmetrical β-catenin areas between overlapping AECs. Numbers in (a) represent distance from the top of the cells. (b) 3D volume images of the reconstructed z-stack slices were rotated along the x-axis to show the z-separation of ZO-1 and β-catenin. Bars: 5 µm
Dynamin-2 regulates tight junction morphology
The alcoholic lung phenotype is associated with increased paracellular permeability both in vitro and in vivo and correlates with an increase in tight junction spikes.Citation19,Citation20,Citation33 Dynamin has previously been shown to induce membrane bending (including vesicle fission) and also interacts with actin,Citation14,Citation34–36 suggesting dynamin as a candidate regulator of tight junction spikes. We previously found that a dynamin inhibitor, Dynasore, decreased the number of AECs containing tight junction spikes.Citation8 Thus, we measured expression of two isoforms of dynamin in AECs by immunoblot. Consistent with other epithelial cells, dynamin-2 was the dominant isoform present,Citation37,Citation38 however there were low levels of dynamin-1 detectable by immunoblot (). Antibody validation is shown in Supplemental Figure 5.
Figure 7. Dynamin-2 localizes to tight junctions. (a, b) AECs isolated from Sprague Dawley rats were cultured on collagen-coated Transwell permeable supports for 6 d and then collected as protein lysates for immunoblot analysis (n = 3 biological replicates). ** p = .004, one-way ANOVA with Tukey’s test of multiple comparisons, average ± SD. (c,d) AECs on collagen-coated coverslips were fixed and immunolabeled for (c) ZO-1 (red) and dynamin-2 (cyan) or (d) β-catenin (red) and dynamin-2 (cyan). (e) AECs transduced with EYFP-claudin-18 (red) at MOI 25 on d 2 were fixed and immunolabeled for dynamin-2 (cyan). Dashed lines in (c–e) merged images denote where line scans were taken. Dynamin-2 showed sharp localization with tight junctions, (arrows), but only partially localized with β-catenin (d). Images are representative from three independent experiments
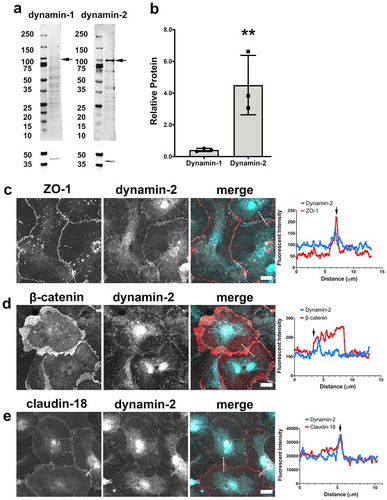
Localization of dynamin-2 was determined by immunofluorescence microscopy, where AECs were double-labeled with anti-dynamin-2 and anti-β-catenin, anti-claudin-18, or anti-ZO-1 (). Dynamin-2 strongly localized to linear cell–cell junctions including areas with tight junction spikes, co-localizing with the tight junction proteins claudin-18 and ZO-1. Slight dynamin-2 staining was visible co-localizing with some tight junction spikes, however, dynamin-2 was predominantly localized at linear intercellular tight junctions. In areas with asymmetrical β-catenin, line scans show that dynamin-2 is predominantly localized at one edge of β-catenin near the linear cell–cell junction with fainter dynamin-2 staining visible throughout areas containing β-catenin.
To determine whether dynamin has a role in regulating tight junctions and adherens junctions, we investigated localization of ZO-1, β-catenin, and actin with and without exposure to the dynamin inhibitor Dynasore (4 h, 160 μM). Dynasore treatment decreased actin stress fiber formation, and concurrently increased the appearance of cortical actin. Cortical actin co-localized with ZO-1 staining at linear junctions, suggesting that when Dynasore treatment decreases tight junction spikes, ZO-1 and actin were reabsorbed back into intercellular linear tight junctions. Conversely, para-junctional regions enriched for β-catenin remained present in Dynasore-treated cells.
We then measured the effects of Dynasore on AEC barrier function of cells from either control-fed or alcohol-fed rats (Supplemental Figure 6). Consistent with our previous analysis, we found that AECs from alcohol-fed rats were leakier than control AECs, based on measurements of TER, and paracellular flux of calcein and Texas Red Dextran (10 kDa). Surprisingly, AEC monolayers showed a decrease in TER in response to Dynasore, suggesting an increase in paracellular leak, regardless of whether the AECs were from control or alcohol-fed rats. We also measured the effect of Dynasore on paracellular flux of calcein through control and alcohol-fed AEC monolayers, which also increased. Although Dynasore increased calcein permeability, Texas Red Dextran (10 kDa) permeability decreased in both control and alcohol-exposed AECs. These data support a model where Dynasore alters paracellular flux by simultaneously increasing ion and small molecule leakage and decreasing large molecule permeability. This differential pattern of changes in tight junction permeability is not without precedent, since claudin-5-deficient mice show a similar preferential increase in small molecule permeability to the blood–brain barrier.Citation39,Citation40
Since we were concerned about off-target effects of Dynasore,Citation37 we also examined the effect of two other dynamin-2 inhibitors, Dynole 34–2 and MiTMAB,Citation41 on junction morphology. In contrast to Dynasore, Dynole 34–2 (2 h, 10 µM) and MiTMAB (2 h, 30 µM) did not decrease the number of tight junction spikes/cell; however, spike length was significantly reduced (). Both Dynole 34–2 and MiTMAB altered the localization of β-catenin to be more closely aligned with ZO-1. These two inhibitors also had a profound effect on actin, which no longer organized into stress fibers or a cortical pattern. The effects of these inhibitors on actin were seen as early as 10 minutes after treatment (not shown), but quantification of spikes was conducted at 2 h. Since Dynole 34–2 and MiTMAB had comparable effects on AECs and more specifically target dynamins than Dynasore,Citation41 these data suggest that their effects on tight junction spikes and β-catenin are likely due to their effect on dynamin-2. By contrast, the effects of Dynasore on tight junction spikes are more likely an off-target effect, perhaps by altering the organization of peripheral/cortical actin.Citation37 In this light, it is worth noting that in dynamin triple knockout fibroblasts, Dynasore treatment enhanced the formation of clathrin-coated pits connected to the plasma membrane by long, narrow tubular necks,Citation37 structures that resemble tight junction spikes. This is consistent with our observation that Dynasore increased average tight junction spike length, despite decreasing spike number (). Taken together, these data suggest a model where dynamin-2 acts as an intermediary between adherens junctions and linear tight junctions that plays multiple roles to regulate the formation of tight junction spikes ().
Figure 8. Differential effects of dynamin inhibitors on spike formation, length and actin. (a) AECs isolated from Sprague Dawley rats were cultured on collagen-coated coverslips for 6 d. The cells were then treated with vehicle control, Dynasore (160 µM, 4 h), Dynole 34–2 (10 µM, 2 h), or MiTMAB (30 µM, 2 h), then fixed and triple labeled with AlexaFluor405-phalloidin (actin, red), β-catenin (cyan), and ZO-1 (white). (b, c) The inhibitors differentially affected the number of tight junction spikes and average spike length as determined by ZO-1 immunofluorescence, comparing control AECs (5 biological replicates, 9494 total spikes) with AECs treated with either Dynasore (2 biological replicates, 365 total spikes), Dynole 34–2 (2 biological replicates, 6928 total spikes), or MiTMAB (2 biological replicates, 5185 total spikes). * p = .021, # p = .012, two-way ANOVA with Tukey’s test of multiple comparisons, average ± SD. Images are representative of n = 6 fields from two independent experiments. Bars: 10 µm
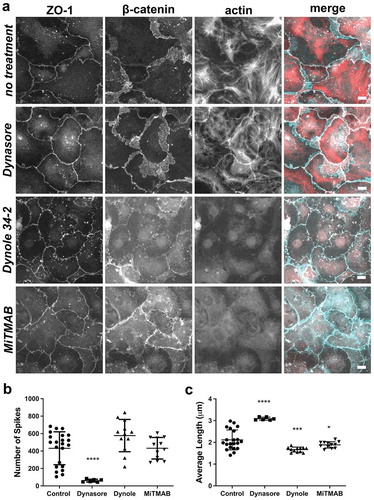
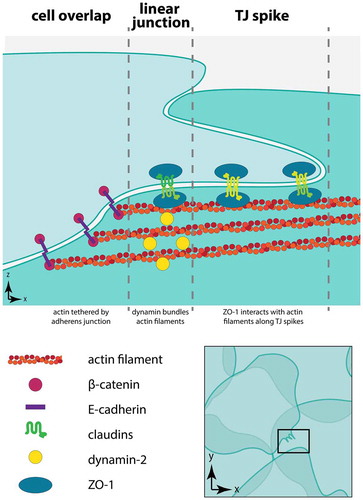
Figure 9. Organization of dynamin, actin, and junctions at tight junction spikes. This model represents three regions in squamous rat alveolar epithelial cells present near tight junction spikes. The region of overlap between neighboring cells is depicted with adherens junctions tethering actin filaments at cell–cell junctions. Dynamin localized to linear tight junctions bundles actin filaments, facilitating interactions with ZO-1 to enable formation of tight junction spikes
Discussion
In this study, we defined the molecular composition of tight junction spikes and investigated their role in barrier function in AECs. There was a distinct, asymmetrical separation of tight junction spikes and adherens junctions. Despite the striking separation of adherens junctions and tight junction spikes, we found that these regions were not prone to increased paracellular permeability using a local permeability immunofluorescence assay. For the first time, we found that dynamin-2 localized to AEC tight junctions. Consistent with this observation, the dynamin inhibitors we used affected tight junction spike length and altered the organization of filamentous and cortical actin. Since the effect of Dynasore on AEC junctions differed from Dynole 34–2 and MiTMAB, it is difficult to precisely determine a role for dynamin-2 in regulated AEC junction morphology, although this does reaffirm that the use of pharmacologic agents to study dynamin-2 should be interpreted with caution. However, our data in aggregate suggest a model where cytoskeletal rearrangement is involved in tight junction spike formation.
We observed a unique orientation of lateral junctions at AEC cell–cell interfaces. Unlike cuboidal polarized epithelia, which form closely opposed tight junctions and adherens junctions, AECs are squamous and have overlapping areas of cell–cell contact.Citation42 Though often portrayed in models as forming junctions at non-overlapping cell–cell interfaces, the asymmetrical staining pattern we observed of β-catenin relative to ZO-1 suggests that tight junctions form at the edge of overlapping cells and adherens junctions form along the majority of the overlapping cell–cell interface. In support of this model, 3D SIM showed that junctions formed at sites of AEC overlap (). This is consistent with overlap zones between AECs that have been noted in EM sections of intact alveoli.Citation24,Citation42
Squamous AECs afforded the unique viewpoint of the lateral junction interface that facilitated visualization of crosstalk between the actin cytoskeleton, tight junctions, and adherens junctions. Specifically, we can better observe associations between tight junction spike formation and changing actin morphology at junctions. This orientation of the cell–cell interface provides an optimal view of lateral junction interactions especially with the actin cytoskeleton. The asymmetrical localization of β-catenin relative to tight junctions, particularly at areas with tight junction spikes, and the association with actin stress fibers suggests that cytoskeletal orientation of tension could be partly responsible for the asymmetrical localization of β-catenin and tight junction spikes. Moreover, changes in tension between cells can be sensed and regulated by adherens junctions.Citation43,Citation44 The asymmetrical distribution of β-catenin at junction interfaces, as well as the change in distribution due to Blebbistatin treatment, suggests an asymmetry in cytoskeletal forces at the junction. The opposing orientations of tight junction spikes and asymmetrical β-catenin staining suggest opposing cytoskeletal-mediated tension pulling separately at the tight junction and adherens junction, such as contractile forces exerted by actomyosin. Consistent with this, myosin II regulatory light-chain phosphorylation, a marker of actomyosin contraction, has been correlated with an increase in tight junction permeability.Citation45,Citation46
Alternatively, actin filaments could be propelling tight junction spike formation through actin polymerization similar to the construction of other cell appendages like filopodia and lamellipodia, with asymmetrical adherens junctions perhaps representing the starting point of the apical junctional complex prior to tight junction spike formation. This scenario hints at a lack of opposing forces countering tight junction formation. One notable example in MDCK cells demonstrated aberrant apical membrane expansion enriched in F-actin and dysregulated microvilli structures occurring with ZO-1 knockdown, in addition to an increase in cortical actin staining.Citation47 Interestingly, Dynasore treatment of ZO-1-depleted cells rescued these phenotypes, suggesting that in addition to its role as a cytoskeletal organizer, ZO-1 could play a role in regulating membrane traffic.Citation15,Citation27 It is possible that dissociation of ZO-1 from the actin cytoskeleton could lead to dysregulation of membrane trafficking and an increase in tight junction spikes. This supports a model of tight junction spike formation through asymmetric cytoskeletal force distribution, but further work is needed to determine whether this is the case.
Previous work demonstrated that ZO-1 and claudin-18 labeled vesicles budded from and fused with tight junction spikes, suggesting that spikes could be areas of increased tight junction turnover and trafficking.Citation8,Citation48,Citation49 Dynamin is a large GTPase that primarily plays a role in clathrin-mediated endocytosis that facilitates endocytic vesicle formation by dimerizing and wrapping around the neck of a budding vesicle. The hydrolysis of GTP causes dynamin to cinch the neck of the budding vesicle, effectively merging the plasma membrane to release the vesicle.Citation50 It also is possible that incomplete scission by dynamin or friction-induced elongation of vesicles during endocytosis plays a role in tight junction spike formation.Citation51
Alternatively, dynamin has more recently been shown to interact with the actin cytoskeleton to create actin filament bundles. One particularly relevant example in a drosophila cell line revealed that dynamin was able to facilitate invadasome structures through assembly with actin filaments.Citation35 Similarly, in a rat glioma-derived cell line, inhibition of dynamin-1 resulted in decreased actin bundling and stunted filopodia and lamellipodia formation.Citation34 Considering that dynamin colocalized with ZO-1 at cell–cell junctions, partially overlapped with β-catenin, and that three different drugs that inhibit dynamin-2 induced cytoskeletal rearrangement and had an effect on tight junction spikes, it is likely that dynamin is facilitating tight junction spike formation through association with actin filaments. However, these results should be interpreted with caution. In particular, the effects of Dynasore on tight junction spikes are likely to be influenced by off-target effects such as inhibiting cell motility and cholesterol perturbation.Citation37,Citation52 On the other hand, the finding that tight junction spikes were shorter in AECs treated with either Dynole 34–2 or MiTMAB, in combination with the observation that spikes were longer in Dynasore treated cells supports a model where dynamin-2 is involved in regulating spike length.
We found that tight junction spikes themselves were not the sites of increased leak, suggesting an indirect role for them in controlling paracellular barrier function. For instance, it is possible that tight junctions respond to changes in tension that result in increased leakiness.Citation53–55 The rearrangement of cortical actin structures with Dynasore treatment correlated with a decrease in tight junction spikes and a recovery of large molecule permeability, suggesting that the formation of spikes is coupled with tensile-actin forces, which can induce leak at stress points in cell monolayers, as has been demonstrated for focal adherens junction formation.Citation56 Interestingly, when rat Type I AECs were stretched to a 25% change in surface area (equivalent to 100% total lung capacity), rearrangement of actin into more cortical structures was observed without changes to tight junction morphology.Citation57
The association of tight junction spikes with leaky alveolar monolayer phenotypes (i.e. chronic alcohol models, increased claudin-5 expression) suggested that tight junction spikes could be areas of increased paracellular leak. However, we directly tested this hypothesis and found that this was not the case. Instead, the presence of vesicles at tight junction spikes suggests that these spikes are areas of increased tight junction turnover, which also could be associated with increased leak. Similar spike structures have been visualized at desmosomes in keratinocytes treated with Pemphigus vulgaris antisera and more generally associated with endocytosis of junctional proteins.Citation58–60 It is also possible that these spikes are pools of tight junction proteins that are separate from strand-incorporated tight junctions. Previous data surveying tight junction proteins in cells from alcohol-fed rats saw a significant increase in claudin-5, but not a significant increase in other claudins or ZO-1. This suggests that the lengthening of tight junctions through the formation of tight junction spikes is not being compensated with an increase in tight junction proteins, and therefore the stoichiometry of tight junction proteins in the apical junctional complex could be affected.
There is considerable heterogeneity in the intracellular distribution of junction proteins and only a subset of cells within a monolayer have tight junction spikes. Our data demonstrate that the impact of chronic alcohol use on barrier function is also heterogenous across the alveolar monolayer. Here we found that tight junction spikes were not sites prone to paracellular leak of macromolecules. Whether they are prone to increased paracellular ion flux remains an open question that requires localized electrophysiological analysis.Citation61,Citation62 However, another possibility is that tight junction spikes represent a signaling platform, where the exchange of ZO-1 for other scaffold proteins (e.g. YAPCitation63) could influence the behavior of cells under stress. This would be analogous to similar structures identified in Sertoli cells, tubulobulbar complexes, that organize tight junction proteins, actin interacting proteins, dynamins and proteins involved in calcium-mediated signal transduction.Citation64 Further work defining how interactions between adherens junctions and tight junctions are affected by alcohol and other stresses at a molecular level will help determine their impact on alveolar barrier function and susceptibility to acute lung injury.
Disclosure of potential conflicts of interest
No potential conflict of interest was reported by the author(s).
Supplemental Material
Download PDF (1.2 MB)Supplemental Material
Download Zip (1.7 MB)Acknowledgments
We thank members of the Koval laboratory for critical reading of the manuscript and to William Giang and Laura Fox-Goharioon for their microscopy assistance. Supported by NIH grants R01-AA025854 (MK), F31-HL139109 (KSL) and the Emory University Integrated Cellular Imaging Microscopy Core (NIH S10-OD028673).
Supplementary material
Supplemental data for this article can be accessed on the publisher’s website.
Additional information
Funding
References
- Matthay MA, Robriquet L, Fang X. Alveolar epithelium: role in lung fluid balance and acute lung injury. Proc Am Thorac Soc. 2005;2(3):1–20. doi:https://doi.org/10.1513/pats.200501-009ac.
- Guidot DM, Hart C. Alcohol abuse and acute lung injury: epidemiology and pathophysiology of a recently recognized association. J Investig Med. 2005;53(5):235–245. doi:https://doi.org/10.2310/6650.2005.53506.
- Moss M, Bucher B, Moore F, Moore E, Parsons P. The role of chronic alcohol abuse in the development of acute respiratory distress syndrome in adults. JAMA. 1996;275(1):50–54. doi:https://doi.org/10.1001/jama.1996.03530250054027.
- Koval M. Claudin heterogeneity and control of lung tight junctions. Annu Rev Physiol. 2013;75(1):551–567. doi:https://doi.org/10.1146/annurev-physiol-030212-183809.
- Li G, Flodby P, Luo J, Kage H, Sipos A, Gao D. Knockout mice reveal key roles for claudin 18 in alveolar barrier properties and fluid homeostasis. Am J Resp Cell Mol. 2014;51:210–222. doi:https://doi.org/10.1165/rcmb.2013-0353oc.
- Schlingmann B, Molina SA, Koval M. Claudins: gatekeepers of lung epithelial function. Semin Cell Dev Biol. 2015;42:47–57. doi:https://doi.org/10.1016/j.semcdb.2015.04.009.
- Lynn KS, Peterson RJ, Koval M. Ruffles and spikes: control of tight junction morphology and permeability by claudins. Biochim Biophys Acta Biomembr. 2020;1862(9):183339. doi:https://doi.org/10.1016/j.bbamem.2020.183339.
- Schlingmann B, Overgaard CE, Molina SA, Lynn KS, Mitchell LA, White SD. Regulation of claudin/zonula occludens-1 complexes by hetero-claudin interactions. Nat Commun. 2016;7(1):12276. doi:https://doi.org/10.1038/ncomms12276.
- Ikehata M, Yumoto R, Kato Y, Nagai J, Takano M. Mechanism of insulin uptake in rat alveolar type II and type I-like epithelial cells. Biol Pharm Bull. 2009;32(10):1765–1769. doi:https://doi.org/10.1248/bpb.32.1765.
- Fazlollahi F, Sipos A, Kim YH, Hamm-Alvarez SF, Borok Z, Kim K-J-J. Translocation of PEGylated quantum dots across rat alveolar epithelial cell monolayers. Int J Nanomed. 2011;6:2849–2857. doi:https://doi.org/10.2147/IJN.S26051.
- Mears JA, Ray P, Hinshaw JE. A corkscrew model for dynamin constriction. Structure. 2007;15(10):1190–1202. doi:https://doi.org/10.1016/j.str.2007.08.012.
- Hinshaw JE. Dynamin and its role in membrane fission1. Cell Dev Biol. 2000;16(1):483–519. doi:https://doi.org/10.1146/annurev.cellbio.16.1.483.
- Sauvonnet N, Dujeancourt A, Dautry-Varsat A. Cortactin and dynamin are required for the clathrin-independent endocytosis of γc cytokine receptor. J Cell Biol. 2005;168(1):155–163. doi:https://doi.org/10.1083/jcb.200406174.
- Mooren OL, Kotova TI, Moore AJ, Schafer DA. Dynamin2 GTPase and cortactin remodel actin filaments. J Biol Chem. 2009;284(36):23995–24005. doi:https://doi.org/10.1074/jbc.m109.024398.
- Chua J, Rikhy R, Lippincott-Schwartz J. Dynamin 2 orchestrates the global actomyosin cytoskeleton for epithelial maintenance and apical constriction. Proc National Acad Sci. 2009;106(49):20770–20775. doi:https://doi.org/10.1073/pnas.0909812106.
- Dobbs LG, Gonzalez R, Williams MC. An improved method for isolating type II cells in high yield and purity 1–3. Am Rev Respir Dis. 2015;134:141–145. doi:https://doi.org/10.1164/arrd.1986.134.1.141.
- Dubrovskyi O, Birukova AA, Birukov KG. Measurement of local permeability at subcellular level in cell models of agonist- and ventilator-induced lung injury. Lab Invest. 2013;93(2):254–263. doi:https://doi.org/10.1038/labinvest.2012.159.
- Schindelin J, Arganda-Carreras I, Frise E, Kaynig V, Longair M, Pietzsch T. Fiji: an open-source platform for biological-image analysis. Nat Methods. 2012;9(7):676–682. doi:https://doi.org/10.1038/nmeth.2019.
- Ward C, Schlingmann B, Stecenko AA, Guidot DM, Koval M. NF-κB inhibitors impair lung epithelial tight junctions in the absence of inflammation. Tissue Barriers. 2015;3(1–2):e982424. doi:https://doi.org/10.4161/21688370.2014.982424.
- Overgaard CE, Schlingmann B, White SD, Ward C, Fan X, Swarnakar S. The relative balance of GM-CSF and TGF-β1 regulates lung epithelial barrier function. Am J Physiol Lung Cell Mol Physiol. 2015;308(12):L1212–23. doi:https://doi.org/10.1152/ajplung.00042.2014.
- Capaldo CT, Macara IG. Depletion of E-cadherin disrupts establishment but not maintenance of cell junctions in Madin-Darby canine kidney epithelial cells. Mol Biol Cell. 2007;18(1):189–200. doi:https://doi.org/10.1091/mbc.e06-05-0471.
- Rajasekaran AK, Hojo M, Huima T, Rodriguez-Boulan E. Catenins and zonula occludens-1 form a complex during early stages in the assembly of tight junctions. J Cell Biol. 1996;132(3):451–463. doi:https://doi.org/10.1083/jcb.132.3.451.
- Liu Y, Nusrat A, Schnell FJ, Reaves TA, Walsh S, Pochet M. Human junction adhesion molecule regulates tight junction resealing in epithelia. J Cell Sci. 2000;113(Pt 13):2363–2374. doi:https://doi.org/10.1242/jcs.113.13.2363.
- Schneeberger EE, Lynch RD. The tight junction: a multifunctional complex. Am J Physiol Cell Physiol. 2004;286(6):C1213–28. doi:https://doi.org/10.1152/ajpcell.00558.2003.
- Quiros M, Nusrat A. RhoGTPases, actomyosin signaling and regulation of the epithelial apical junctional complex. Semin Cell Dev Biol. 2014;36:194–203. doi:https://doi.org/10.1016/j.semcdb.2014.09.003.
- Hartsock A, Nelson WJ. Adherens and tight junctions: structure, function and connections to the actin cytoskeleton. Biochim Biophys Acta Biomembr. 2008;1778(3):660–669. doi:https://doi.org/10.1016/j.bbamem.2007.07.012.
- Fanning AS, Jameson BJ, Jesaitis LA, Anderson JM. The tight junction Protein ZO-1 establishes a link between the Transmembrane Protein Occludin and the Actin Cytoskeleton. J Biol Chem. 1998;273(45):29745–29753. doi:https://doi.org/10.1074/jbc.273.45.29745.
- Buckley CD, Tan J, Anderson KL, Hanein D, Volkmann N, Weis WI. The minimal cadherin-catenin complex binds to actin filaments under force. Science. 2014;346(6209):1254211. doi:https://doi.org/10.1126/science.1254211.
- Desai R, Sarpal R, Ishiyama N, Pellikka M, Ikura M, Tepass U. Monomeric α-catenin links cadherin to the actin cytoskeleton. Nat Cell Biol. 2013;15(3):261–273. doi:https://doi.org/10.1038/ncb2685.
- Straight AF, Cheung A, Limouze J, Chen I, Westwood NJ, Sellers JR. Dissecting temporal and spatial control of cytokinesis with a myosin II inhibitor. Science. 2003;299(5613):1743–1747. doi:https://doi.org/10.1126/science.1081412.
- Bubb MR, Senderowicz AM, Sausville EA, Duncan KL, Korn ED. Jasplakinolide, a cytotoxic natural product, induces actin polymerization and competitively inhibits the binding of phalloidin to F-actin. J Biol Chem. 1994;269(21):14869–14871. doi:https://doi.org/10.1016/S0021-9258(17)36545-6.
- Spector I, Shochet N, Kashman Y, Groweiss A. Latrunculins: novel marine toxins that disrupt microfilament organization in cultured cells. Science. 1983;219(4584):493–495. doi:https://doi.org/10.1126/science.6681676.
- Guidot DM, Modelska K, Lois M, Jain L, Moss IM, Pittet J-F. Ethanol ingestion via glutathione depletion impairs alveolar epithelial barrier function in rats. Am J Physiol Lung Cell Mol Physiol. 2000;279(1):L127–35. doi:https://doi.org/10.1152/ajplung.2000.279.1.l127.
- Abe T, La TM, Miyagaki Y, Oya E, Wei F-Y, Sumida K. Phosphorylation of cortactin by cyclin-dependent kinase 5 modulates actin bundling by the dynamin 1-cortactin ring-like complex and formation of filopodia and lamellipodia in NG108-15 glioma-derived cells. Int J Oncol. 2018;54(2):550–558. doi:https://doi.org/10.3892/ijo.2018.4663.
- Zhang R, Lee DM, Jimah JR, Gerassimov N, Yang C, Kim S. Dynamin regulates the dynamics and mechanical strength of the actin cytoskeleton as a multifilament actin-bundling protein. Nat Cell Biol. 2020;22(6):674–688. doi:https://doi.org/10.1038/s41556-020-0519-7.
- Kusumi N, Watanabe M, Yamada H, Li S-A, Kashiwakura Y, Matsukawa T. Implication of amphiphysin 1 and dynamin 2 in tubulobulbar complex formation and spermatid release. Cell Struct Funct. 2007;32(2):101–113. doi:https://doi.org/10.1247/csf.07024.
- Park RJ, Shen H, Liu L, Liu X, Ferguson SM, Camilli PD. Dynamin triple knockout cells reveal off target effects of commonly used dynamin inhibitors. J Cell Sci. 2013;126(22):5305–5312. doi:https://doi.org/10.1242/jcs.138578.
- Cao H, Garcia F, McNiven MA. Differential distribution of dynamin isoforms in mammalian cells. Mol Biol Cell. 1998;9(9):2595–2609. doi:https://doi.org/10.1091/mbc.9.9.2595.
- Nitta T, Hata M, Gotoh S, Seo Y, Sasaki H, Hashimoto N. Size-selective loosening of the blood-brain barrier in claudin-5-deficient mice. J Cell Biol. 2003;161(3):653–660. doi:https://doi.org/10.1083/jcb.200302070.
- Sonoda N, Furuse M, Sasaki H, Yonemura S, Katahira J, Horiguchi Y. Clostridium perfringens Enterotoxin fragment removes specific claudins from tight junction strands: evidence for direct involvement of claudins in tight junction barrier. J Cell Biol. 1999;147(1):195–204. doi:https://doi.org/10.1083/jcb.147.1.195.
- Harper CB, Popoff MR, McCluskey A, Robinson PJ, Meunier FAA. Targeting membrane trafficking in infection prophylaxis: dynamin inhibitors. Trends Cell Biol. 2013;23:90–101. doi:https://doi.org/10.1016/j.tcb.2012.10.007.
- LaFemina MJ, Sutherland KM, Bentley T, Gonzales LW, Allen L, Chapin CJ. Claudin-18 deficiency results in alveolar barrier dysfunction and impaired alveologenesis in mice. Am J Resp Cell Mol. 2014;51(4):550–558. doi:https://doi.org/10.1165/rcmb.2013-0456OC.
- Huveneers S, Rooij JD. Mechanosensitive systems at the cadherin-F-actin interface. J Cell Sci. 2013;126(2):403–413. doi:https://doi.org/10.1242/jcs.109447.
- Nishida K, Brune KA, Putcha N, Mandke P, O’Neal WK, Shade D. Cigarette smoke disrupts monolayer integrity by altering epithelial cell-cell adhesion and cortical tension. Am J Physiol Lung Cell Mol Physiol. 2017;313(3):L581–91. doi:https://doi.org/10.1152/ajplung.00074.2017.
- Turner JR, Rill BK, Carlson SL, Carnes D, Kerner R, Mrsny RJ. Physiological regulation of epithelial tight junctions is associated with myosin light-chain phosphorylation. Am J Physiol Cell Physiol. 1997;273(4):C1378–85. doi:https://doi.org/10.1152/ajpcell.1997.273.4.c1378.
- Yuhan R, Koutsouris A, Savkovic S, Hecht G. Enteropathogenic Escherichia coli-induced myosin light chain phosphorylation alters intestinal epithelial permeability. Gastroenterology. 1997;113(6):1873–1882. doi:https://doi.org/10.1016/s0016-5085(97)70006-4.
- Odenwald MA, Choi W, Kuo W-T-T, Singh G, Sailer A, Wang Y. The scaffolding protein ZO-1 coordinates actomyosin and epithelial apical specializations in vitro and in vivo. J Biol Chem. 2018;293(45):17317–17335. doi:https://doi.org/10.1074/jbc.RA118.003908.
- Gehne N, Lamik A, Lehmann M, Haseloff RF, Andjelkovic AV, Blasig IE. Cross-over endocytosis of claudins is mediated by interactions via their extracellular loops. PLoS One. 2017;12(8):e0182106. doi:https://doi.org/10.1371/journal.pone.0182106.
- Fletcher SJ, Poulter NS, Haining EJ, Rappoport JZ. Clathrin-mediated endocytosis regulates occludin, and not focal adhesion, distribution during epithelial wound healing. Biol Cell. 2012;104(4):238–256. doi:https://doi.org/10.1111/boc.201100004.
- Antonny B, Burd C, Camilli PD, Chen E, Daumke O, Faelber K. Membrane fission by dynamin: what we know and what we need to know. EMBO J. 2016;35(21):2270–2284. doi:https://doi.org/10.15252/embj.201694613.
- Simunovic M, Manneville J-B, Renard H-F, Evergren E, Raghunathan K, Bhatia D. Friction mediates scission of tubular membranes scaffolded by BAR proteins. Cell. 2017;170(1):172–184.e11. doi:https://doi.org/10.1016/j.cell.2017.05.047.
- Preta G, Cronin JG, Sheldon IM. Dynasore - not just a dynamin inhibitor. Cell Commun Signal. 2015;13(1):24. doi:https://doi.org/10.1186/s12964-015-0102-1.
- Turner JR. ‘Putting the squeeze’ on the tight junction: understanding cytoskeletal regulation. Semin Cell Dev Biol. 2000;11(4):301–308. doi:https://doi.org/10.1006/scdb.2000.0180.
- Madara JL, Moore R, Carlson S. Alteration of intestinal tight junction structure and permeability by cytoskeletal contraction. Am J Physiol Cell Physiol. 1987;253(6):C854–61. doi:https://doi.org/10.1152/ajpcell.1987.253.6.c854.
- Ma TY, Hollander D, Tran LT, Nguyen D, Hoa N, Bhalla D. Cytoskeletal regulation of Caco-2 intestinal monolayer paracellular permeability. J Cell Physiol. 1995;164(3):533–545. doi:https://doi.org/10.1002/jcp.1041640311.
- Dorland YL, Malinova TS, Stalborch A-MD-MV, Grieve AG, Geemen DV, Jansen NS. The F-BAR protein pacsin2 inhibits asymmetric VE-cadherin internalization from tensile adherens junctions. Nat Commun. 2016;7(1):12210. doi:https://doi.org/10.1038/ncomms12210.
- Cavanaugh KJ, Oswari J, Margulies SS. Role of stretch on tight junction structure in alveolar epithelial cells. Am J Resp Cell Mol. 2001;25(5):584–591. doi:https://doi.org/10.1165/ajrcmb.25.5.4486.
- Stahley SN, Saito M, Faundez V, Koval M, Mattheyses AL, Kowalczyk AP. Desmosome assembly and disassembly are membrane raft-dependent. PLoS One. 2014;9(1):e87809. doi:https://doi.org/10.1371/journal.pone.0087809.
- Aberle H, Bauer A, Stappert J, Kispert A, Kemler R. β-catenin is a target for the ubiquitin–proteasome pathway. EMBO J. 1997;16(13):3797–3804. doi:https://doi.org/10.1093/emboj/16.13.3797.
- Ladoux B, Nelson WJ, Yan J, Mège RM. The mechanotransduction machinery at work at adherens junctions. Integr Biol (Camb). 2015;7(10):1109–1119. doi:https://doi.org/10.1039/c5ib00070j.
- Shi W, Zeng Y, Zhu C, Xiao Y, Cummins TR, Hou J. Characterization of membrane Patch‐Ion channel probes for scanning ion conductance microscopy. Small. 2018;14(18):1702945. doi:https://doi.org/10.1002/smll.201702945.
- Weber CR, Liang GH, Wang Y, Das S, Shen L, Yu ASL. Claudin-2-dependent paracellular channels are dynamically gated. Elife. 2015;4:e09906. doi:https://doi.org/10.7554/elife.09906.
- Zhou B, Flodby P, Luo J, Castillo DR, Liu Y, Yu F-X-X. Claudin-18-mediated YAP activity regulates lung stem and progenitor cell homeostasis and tumorigenesis. J Clin Inv. 2018;(3). doi:https://doi.org/10.1172/jci90429.
- Lyon K, Adams A, Piva M, Asghari P, Moore ED, Vogl AW. Ca2+signaling machinery is present at intercellular junctions and structures associated with junction turnover in rat sertoli cells. Biol Reprod. 2017;96(6):1288–1302. doi:https://doi.org/10.1093/biolre/iox042.