
ABSTRACT
Due to a lower survival rate in patients with advanced clinical stages of oral cancer, discovering a biomarker that could diagnose and predict disease progression is vital. Cell–cell junctional proteins play a crucial role in the maintenance of tissue architecture but are often deregulated in different cancer. The present study investigates the expression of cell–cell junctional proteins viz: e-cadherin (E-cad) and zonula occludens-1 (ZO-1) in oral precancerous (OED) and cancerous (OSCC) patients to monitor if they can serve as practicable molecular markers. The ultrastructural junctional complex was studied by transmission electron microscopy, and the expression of proteins was performed by immunohistochemistry. The relationship between the expression of protein and clinicopathological features of the patients was checked by Pearson’s correlation test. Furthermore, the survival curve of the follow-up data was estimated by the Kaplan–Meier method. We observed a disrupted junctional complex and a significantly decreased immunoexpression of E-cad and ZO-1 in OED and OSCC when compared to the adjacent non-cancerous tissues. The expression of ZO-1 was associated with TNM stages, whereas E-cad was associated with histological grades as well as TNM stages. A positive correlation was observed between the expression of ZO-1 and E-cad proteins in OED and OSCC. Further, follow-up studies revealed that high ZO-1 and E-cad expressing patients survived longer than their low expressed counterparts. The present study shows disruption of junctional complex and alteration of junctional proteins expression that could draw the attention of health professionals to explore junctional proteins as a possible therapeutic target in oral cancer.
1. Introduction
Despite extensive worldwide research and improvements in the field of surgery, radiation, and chemotherapy, the treatment of oral cancer still remains a major challenge. The incidence of oral squamous cell carcinoma (OSCC) is increasing worldwide and is most frequent in South Asian countries, with the highest incidence rate globally in both sexes.Citation1 Prolonged efforts have been made to wrestle the disease; however, due to lower survival index and delayed clinical detection, this hard work has yielded minimum improvements. Therefore, discovering a biomarker capable in predicting disease progression can play a crucial role to help cure the disease. Even though OSCC has been extensively studied,Citation2 the molecular characteristic associated with this malignancy remains to be identified. Studies have explored several genes/proteins that are transformed, amplified, or dysregulated in expression or deleted during epithelial–mesenchymal transition (EMT) which finally gets involved in the initiation of metastasis.Citation3–5 One of the characteristic features associated with tumor development is the deregulation of cell–cell adhesion.Citation6 Progression of carcinoma and expression of mesenchymal genes are often associated with increased cellular motility and decreased cell–cell adhesion. These features are observed not only in cancerous (OSCC) but precancerous conditions i.e. oral epithelial dysplasias (OED) as well.Citation7,Citation8 Loss of cellular contact promotes detachment of cancer cells from their site of origin and invades the adjacent tissues and finally metastasizes.Citation9
Epithelial cell sheets form cell–cell adhesion that mainly involves tight junctions (TJs) and adherens junctions (AJs). Deregulation of these TJ and AJ proteins results in loss of cellular adhesion and leads to uncontrolled growth of cells.Citation4,Citation10 TJ complex consists of various families of protein such as zonula occludens (ZO), junctional adhesion molecule-A (JAM-A), occludin, and claudins. Among them, the ZO family is the one involved in maintaining epithelial cell structure and function. Its family consists of ZO-1, ZO-2, and ZO-3.Citation11 Out of all the tight junction proteins, ZO-1 is the first to be reported in epithelial cells. It belongs to the membrane-associated guanylic acid protein and is the major structural and functional protein of tight junction to be associated with regulating the cell polarity as well as the permeability of epithelial cells.Citation12
Cadherins are major components of AJs and serve a key role in the maintenance of epithelial tissue integrity.Citation13 E-cadherin (E-cad) is a 120 KD transmembrane glycoprotein belonging to AJs and a major calcium-dependent cell surface adhesion molecule.Citation14 It is encoded by the CDH1 gene located on chromosome 16q-22Citation4 and is restricted to the surface of the epithelial cells.Citation15 It is a widely distributed, intercellular adhesion moleculeCitation16 that through its cytoplasmic tail, associates with various intracellular proteins.Citation17 It functions in cellular crosstalk and mediates cell-to-cell communication by protein interactions on the cytoplasmic membrane surfaces. Reports suggest the role of E-cad as a biomarker in detecting gene expression and predicting disease progression.Citation18 Therefore, investigation of E-cad might be a promising area of interest and could be a potential biological marker.
Both ZO-1 and E-cad are considered as the major components of the junctional assembly. The role of E-cad has been studied in oral precancerous and cancerous conditions but reports on the role of ZO-1 are limited. However, their combined role in OED and OSCC remains to be validated. Therefore, the present study monitors the ultrastructural changes within the junctional complex during the progression of oral cancer followed by an immunohistochemical approach to examine changes in the expression level of E-cad and ZO-1 in OED and OSCC. Additionally, Pearson’s correlation χ2 test was performed to examine any possible association between the protein–protein expression and protein-clinicopathological features.
2. Material and methods
2.1. Study population
The characteristics of the variables are presented in . Experiments were undertaken with the understanding and written consent of each patient and in accordance with the ethical standards of the ethics committee of Assam University, Silchar and Silchar medical college and hospital, Silchar, Assam, India. Tissue samples have been collected from individuals suffering from OED and OSCC comprising 20 participants in each group. Samples were selected after the clinical and histopathological examination () of the patient. Clinical staging of lesions and classification of OED and OSCC was performed based on the guidelines proposed by the American Joint Committee on Cancer and International Agency for Research on Cancer, WHO respectively.Citation19,Citation20 Control samples were collected from adjacent oral gingival tissue of OED and OSCC patients (10 cases each) who were not subjected to field change cancerization. The control samples from OED and OSCC patients have been merged as “control” given that no variation in any study parameter was observed.
Table 1. Socio-demographic and clinicopathological features of OED and OSCC patients
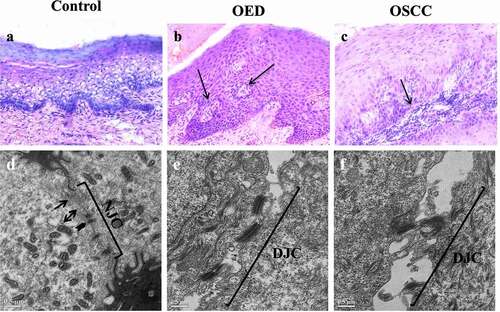
Figure 1. Histological and Transmission electron microscopic (TEM) images of control, oral epithelial dysplasia (OED) and Oral squamous cell carcinoma (OSCC). Histological sections of control tissues (1a) shows gingival epithelium characterized by an intact basement membrane. OED (1b) represents severe dysplasia demonstrated by abnormal cells occupying more than two-thirds of the epithelium, and pearl formation (arrow). OSCC (1 c) shows poorly differentiated epithelium characterized by tumor cells (arrow) infiltrating the sub epithelium (×20). TEM images of control tissue (1d), OED (1e) and OSCC (1 f). Arrows represents tight junctions (TJ), arrowheads represents adherens junctions (AJ) and arrowhead on both ends represents desmosomes, NJC: normal junctional complex, DJC: disrupted junctional complex (scale bar 0.5 µm).
2.2. Transmission electron microscopy
Primary fixation of tissue samples (0.5–1.0 mm) was performed in karnovsky’s fixative for 4–12 hours at 4°C followed by a secondary fixation in osmium tetraoxide for 1 hr. After dehydration and embedding in araldite, the polymerized specimen was sectioned at approximately 90 nm thickness in an ultramicrotome and finally stained using uranyl acetate and lead citrate. Sections were viewed on JOEL 2100 transmission electron microscope at an accelerating voltage of 120 kV. The junctional structure amid adjoining cells was observed from multiple sites that were clearly identified.
2.2.1. Immunohistochemical staining
Paraffin-embedded tissues sections were taken on poly-L-lysine coated slides and incubated for approximately 2 hours at 56°C. An immunohistochemical process was executed using an IHC Detection kit (Cell Marque, Rocklin, CA, USA), which is a three-step indirect immunoperoxidase technique. Antigen retrieval was carried out by using the tris-EDTA buffer in a microwave oven at pH 9. This was followed by blocking in an endogenous peroxidase solution (PeroxFreeTM block). Sections were incubated at room temperature in humidifying chamber for 60 minutes with primary antibodies obtained from Santa Cruz Biotechnology, USA, viz: ZO-1 (Rabbit ZO-1) and E-cad (Rabbit E-cadherin) prepared in 3% BSA (1:100). This was followed by washing the slides three times with IHC wash buffer and incubating with HiDef Detection TM Amplifier (known to universally detect mouse and rabbit primary antibodies) for 30 minutes. This was followed by incubation with polymer HiDef Detection TM HRP Label for 30 minutes. Subsequently, a substrate chromogen solution known as 3,3ʹ-diaminobenzidine tetrahydrochloride (DAB Substrate Kit) was added to the slides and counterstained with hematoxylin for approximately 10 minutes. Thereafter, sections were washed, dehydrated, and mounted with DPX, and observed under Leica DMLS light microscope.
2.2.2. Immunohistochemical scoring
Ten random fields were selected and a hundred cells were counted in each field making 1000 numbers of cells counted per slide. Two independent examiners scored the slides in a blinded fashion. Staining intensity (I) was ranged as weak (1), moderate (2), and high (3). The frequency of positive cells (F) was categorized as follows: 0, <10% positive cells; +1, ≥ 10-<25%; +2, ≥ 25-<50%; +3, ≥ 50-<75% and +4, ≥75%. Final scores were calculated by multiplying the frequency of positive cells (F) and the staining intensity (I) i.e. (FxI). Cases with a final expression score less than or equals to 6 were considered to be low expressed and greater than 6 were considered to be highly expressed for both the proteins.
2.3. Statistical analysis
Expression scores were expressed as mean ± SEM. Analyses were executed using IBM SPSS statistics version 22 (IBM Corporation) for windows. A one-way analysis of variance (ANOVA) was used to determine the significance and post hoc analysis was performed for multiple comparisons among groups using Tukey’s multiple-comparison tests. Correlation between potential markers and categorical analysis of patient’s clinicopathological parameters was analyzed by Pearson’s correlation χ2 test. Survival analysis was carried out by the Kaplan–Meier method and the log-rank test was employed to establish significant differences set at p < .05.
3. Results
3.1. Patient characteristics
Histopathological examination of tissues was performed where 25% of OED cases were categorized as mild dysplasia, 55% moderate dysplasia, and 20% severe dysplasia. In the case of OSCC, 45% of cases were graded as poorly differentiated, 40% moderately differentiated, and, 15% well differentiated ().
3.2. Ultrastructural changes in the junctional complexes
Ultrastructural microphotographs of control, OED, and OSCC tissues are shown by transmission electron microscope (). The presence of electron-dense material (arrow) on the apical region of the adjoining cells represents TJ’s. AJ’s are located between TJ and desmosomes. The control population displayed an intact structure with distinct TJ, AJ, and normal junctional complex () whereas, in the case of OED () and OSCC (), disrupted junctional complex is evident as the cells proceed from normal to malignancy.
3.3. Immunohistochemical assessment
3.3.1. ZO-1 protein expression in OED and OSCC
Differences in expression of ZO-1 were observed between all groups. Localization of ZO-1 was membranous in 50% (10/20) of the control population and the expression was homologous all over the epithelium () while in the case of OED only 35% (7/20) cases exhibited ZO-1 predominantly on the cell–cell border (). It is interesting to note that none of the OSCC samples exhibited membranous staining that indicates that its localization is disturbed as the cells proceed toward malignancy (). Low ZO-1 expression was observed in 25% (5/20) cases of control and 35% (7/20) cases of OED. However, OSCC exhibited 60% (12/20) cases low expressed ZO-1. We observed that the ZO-1 protein level was significantly lower in OSCC (p < .001) than in the adjacent non-cancerous gingival tissues. Pair-wise comparison between groups showed a significant decrease in ZO-1 expression in OSCC (p < .05) when compared to OED ().
Figure 2. Expression of ZO-1 and E-cad in control, OED and OSCC tissues. ZO-1 immunoexpression (a-f): a-b: ZO-1 expression in control sample, c-d: ZO-1 expression in OED, e-f: representing ZO-1 expression in OSCC. E-cad immunoexpression (g-l): g-h: E-cad expression in control sample, i-j: E-cad expression in OED and k-l: E-cad expression in OSCC.
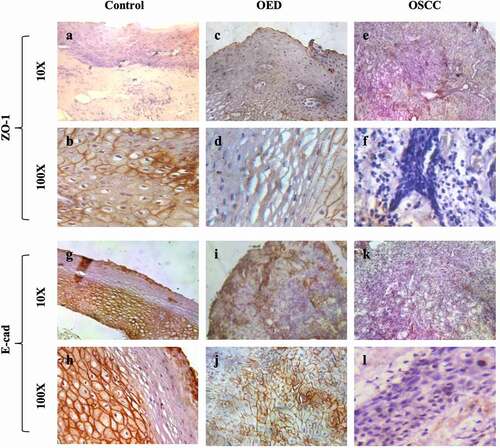
Figure 3. Expression score of ZO-1(3a) and E-cad (3b) in control, OED and OSCC. Values are significantly different from control: ***p < .001. Values having similar superscripts are significantly different from each other: a p < .05.
Bivariate analysis () showed that the intensity of ZO-1 immunoexpression was associated with tumor node metastasis (TNM) stage (p = .047) and male gender (p = .002) in OSCC. However, no statistically significant relationship was observed with other studied and clinical variables like age, lifestyle, pathological grade.
Table 2. Relationship between expression of proteins and clinicopathological parameters of OED and OSCC patients
3.3.2. E-cad protein expression in OED and OSCC
In the control gingival mucosa, the expression of E-cad was observed only on the basal and parabasal layers, while the marking was absent on the upper third of the epithelium (). Expression of E-cad was continuous and homologous, featuring well-ordered junctional integrity () in 80% (16/20) of control tissues. In the OED group, a significant reduction in E-cad expression was observed in all the epithelial layers (). Moreover, only 35% (7/20) cases show membrane staining patterns (). A complete disruption of the junctional complex was observed in the OSCC group (). A higher magnified image shows a discontinuous or absence of E-cad expression () which demonstrates that as the cells proceed toward malignancy, the expression of E-cad junctional protein as well as junctional complex gets disrupted. Low E-cad expression was observed in 30% (6/20) of control cases, whereas OED exhibited 55% (11/20) cases of low expressed E-cad. In the case of OSCC, 75% (15/20) cases showed low expressed E-cad. Expression score shows a significant decrease in expression of both OED and OSCC (p < .001) when compared to control. Pairwise comparison between groups resulted in a significant decrease in OSCC (p < .05) when compared to OED tissues ().
When compared E-cad immunoexpression with clinicopathological parameters, we found that expression of E-cad was significantly associated with TNM stages (p = .007) and histological severity (p = .005) ().
3.3.3. The relationship between E-cad and ZO-1 immunoexpression
A positive correlation was observed between the expression level of E-cad and ZO-1 in OED (r = 0.385, p = .085) and OSCC (r = 0.471, p = .036) () which demonstrates that both the proteins have similar expression patterns among variables.
Table 3. Correlation analysis between expression of ZO-1 and E-cad in OED and OSCC
3.4. Survival analysis
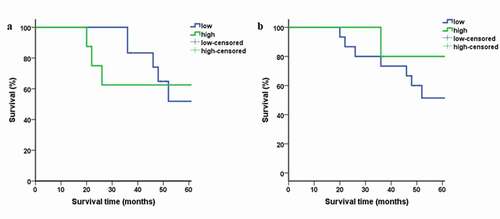
The participants were followed up for more than 60 months. Plots for high and low expression of ZO-1 and E-cad are shown in . The log-rank test was carried out on the followed up participants. 2 (10%) patients were lost to follow up and the remaining 18 (90%) were alive in OED cases. Eight (40%) patients died of OSCC during the end of the follow-up period. Three (15%) patients were lost for follow-up and the remaining 9 (45%) patients were alive. Kaplan–Meier survival curves in OSCC patients demonstrated that the overall survival rate in patients with low ZO-1 () and E-cad expression was lower than their highly expressed counterparts studied longitudinally ().
Figure 4. Kaplan-Meier survival plots for high vs. low expression of ZO-1(4a) and E-cad (4b) in OSCC patients.
4. Discussion
Oral cancer severely threatens and affects the quality of life by rigorously disturbing major functions of the body and leading to a lower survival rate that gets worsens with the advancement of clinical stages.Citation21 Therefore, this demands the development of novel biomarkers for the diagnosis and prediction of disease progression. Theoretically, any distinctive change in the biological structure and function can serve as a biomarker or a therapeutic target. We have earlier reported that certain TJ proteins like claudin-1 and Junctional adhesion molecule-A are deregulated during precancerous and cancerous conditions.Citation22 ZO-1 is reported to have barrier and adhesive functions.Citation23 Apart from that, ZO-1 participates in the building of cellular coupling, forms major closely connected structural and functional protein through interconnecting its PDZ domain and actin.Citation24,Citation25 In this study, reduced expression of ZO-1 protein in OED and OSCC tissues was observed when compared to control, although statistically significant difference was observed only in OSCC. Our results are in concordance with Qiu et al. where expression of ZO-1 on laryngeal squamous cell carcinoma (LSCC) tissues was reported to be significantly lower than their corresponding noncancerous tissues.Citation26 A high degree of LSCC differentiation in their study was associated with high expression of ZO-1 protein but we did not observe any correlation between the degree of differentiation and expression of ZO-1 in both OED and OSCC. However, we could show the association of ZO-1 immunoexpression with TNM stages in OSCC. Studies report that the rate of oral cancer is significantly higher in males than femalesCitation27 and interestingly, we observed a correlation between downregulated ZO-1 immunoexpression and male gender in OSCC. These findings depict that the gender-specific expression of E-cad could also serve as an independent factor affecting the prognosis of OSCC. However, more extensive work is required to confirm our observations.
E-cad has been the major focus of cancer studies as its alteration has been observed in OSCC, ovarian cancer, early-stage cervical carcinoma, and colorectal cancer.Citation28–31 Our study supports the previous study in OED and OSCC tissues that reported the reduction in E-cad expression as the severity increases.Citation28 Reduction in E-cad expression is in line with the observation of earlier studies that reported downregulation of E-cad in the precancerous stageCitation32 and significantly decreased expression in OSCC.Citation33 Several epigenetic mechanisms proposed for E-cad loss are chromatin-mediated effects and alteration in expression and function of a trans-acting factor that regulates CDH1 gene transcription.Citation34 Downregulation of E-cad with increasing grade of a tumor can be explained by the fact that E-cad acts as a tumor suppressor gene and its downregulation enhances invasion of cancer in adjacent normal tissues.Citation35 We observed that reduced expression of E-cad was associated with the histological grades and TNM stages in OSCC which demonstrates that E-cad could be a potential marker of aggressive histological characteristics and might be involved in the progression of cancer. Further, its low expression in poorly and moderately differentiated OSCC () features its character as an epithelial marker, therefore, suggesting its role as an indicator for the degree of epithelial differentiation. Kaplan–Meier analysis shows that low ZO-1 and E-cad expression in our study relates to lower survival time for the patients, which indicates that both the proteins may be a favorable prognostic marker and a monitoring indicator in patients with OSCC. In addition to ZO-1 and E-cad, other tight junctional proteins, viz. claudin-4 and claudin-1 were also reported to correlate with poor prognosis and disease recurrence, respectively, in OSCC patients.Citation36 Association of Claudin-4 with high histological grade was observed by de Vicente et al., 2015 which is consistent with our E-cad studies.Citation36 These suggest that not only E-cad and ZO-1, but other tight junctional proteins could also serve as biomarkers for OSCC. Besides, our previous study shows upregulation of claudin-1 in OSCC,Citation22 also reported by other research groups,Citation37,Citation38 while our current study shows downregulation of ZO-1 and E-cad in the precancerous and OSCC patients, thereby implying an inverse relationship between these proteins. In fact, there are studies that show overexpression of claudin-1 could induce epithelial–mesenchymal transition and eventually down-regulate the expression of E-cad in metastatic cancer colon cells.Citation39 Further investigation correlating ZO-1 and E-cad with different classes of claudins in OSCC patients at the molecular level is an utmost topic of interest that will be explored in the future.
The electron microscopy images support the protein immunoexpression data by demonstrating poorly visualized or disrupted junctional complexes (TJ and AJ) in OED and OSCC compared to the control tissues (). Immunohistochemical results show an imbalance in the expression of TJ and AJ protein expression that ultimately resulted in the loss of the barrier integrity. Loss of junctional integrity of TJ and AJ can consequently encourage the EMT rate of cancer cells that can lead to loss of the cell polarity, therefore reducing intercellular adhesion, alter the epithelial morphology and as a result strengthen the invasiveness of cancer cells. Malfunction in the permeability barrier helps the tumor cells to absorb nutrients and encourage their abnormal proliferation thereby increasing the invasion and metastatic ability of cancer cells.Citation40 Downregulated expression of ZO-1 and E-cad and disrupted junctional complex in oral cancer can be considered as an early phenomenon and that loss of epithelial cohesion may be an indicator of epithelial to mesenchymal transition in cells. Our results confirm the role of ZO-1 and E-cad as a biomarker for the detection of OSCC. A positive correlation between ZO-1 and E-cad expression in OED and OSCC suggests that both the proteins together might act as a biomarker in the detection of OSCC.
Disclosure of interest
The authors report no conflicts of interest.
Acknowledgments
The authors thank the patients for their contribution to the study. The authors are also thankful to the Sophisticated Analytical Instrument Facility, North-Eastern Hill University, for the TEM (JOEL 2100) facility.
Disclosure statement
No potential conflict of interest was reported by the author(s).
Additional information
Funding
References
- Bray F, Ferlay J, Soerjomataram I, et al. Global cancer statistics 2018: GLOBOCAN estimates of incidence and mortality worldwide for 36 cancers in 185 countries. CA Cancer J Clin. 2018;68:1–10.
- Nagpal JK, Das BR. Oral cancer: reviewing the present understanding of its molecular mechanism and exploring the future directions for its effective management. Oral Oncol. 2003;39(3):213–221. doi:https://doi.org/10.1016/S1368-8375(02)00162-8.
- González-Mariscal L, Lechuga S, Garay E. Role of tight junctions in cell proliferation and cancer. Prog Histochem Cytochem. 2007;42:1–57.
- Hartsock A, Nelson WJ. Adherens and tight junctions: structure, function and connections to the actin cytoskeleton. Biochimica Et Biophysica Acta (Bba)-biomembranes. 2008;1778(3):660–669. doi:https://doi.org/10.1016/j.bbamem.2007.07.012.
- Jankowski JA, Bruton R, Shepherd N, Sanders DS. Cadherin and catenin biology represent a global mechanism for epithelial cancer progression. Molecular Pathology. 1997;50(6):289. doi:https://doi.org/10.1136/mp.50.6.289.
- van Dijk M, Göransson SA, Strömblad S. Cell to extracellular matrix interactions and their reciprocal nature in cancer. Exp Cell Res. 2013;319(11):1663–1670. doi:https://doi.org/10.1016/j.yexcr.2013.02.006.
- Chaw SY, Majeed AA, Dalley AJ, Chan A, Stein S, Farah CS. Epithelial to mesenchymal transition (EMT) biomarkers–E-cadherin, beta-catenin, APC and Vimentin–in oral squamous cell carcinogenesis and transformation. Oral Oncol. 2012;48(10):997–1006. doi:https://doi.org/10.1016/j.oraloncology.2012.05.011.
- Smith J, Rattay T, McConkey C, Helliwell T, Mehanna H. Biomarkers in dysplasia of the oral cavity: a systematic review. Oral Oncol. 2009;45(8):647–653. doi:https://doi.org/10.1016/j.oraloncology.2009.02.006.
- Schmalhofer O, Brabletz S, Brabletz T. E-cadherin, β-catenin, and ZEB1 in malignant progression of cancer. Cancer and Metastasis Reviews. 2009;28(1–2):151–166. doi:https://doi.org/10.1007/s10555-008-9179-y.
- Martin TA, Jiang WG. Loss of tight junction barrier function and its role in cancer metastasis. Biochimica Et Biophysica Acta (Bba)-biomembranes. 2009;1788(4):872–891. doi:https://doi.org/10.1016/j.bbamem.2008.11.005.
- Bazzoni G, Martı́nez-Estrada OM, Orsenigo F, Cordenonsi M, Citi S, Dejana E. Interaction of junctional adhesion molecule with the tight junction components ZO-1, cingulin, and occludin. Journal of Biological Chemistry. 2000;275(27):20520–20526. doi:https://doi.org/10.1074/jbc.M905251199.
- Stevenson BR, Siliciano JD, Mooseker MS, Goodenough DA. Identification of ZO-1: a high molecular weight polypeptide associated with the tight junction (zonula occludens) in a variety of epithelia. J Cell Biol. 1986;103(3):755–766. doi:https://doi.org/10.1083/jcb.103.3.755.
- Munshi HG, Ghosh S, Mukhopadhyay S, Wu YI, Sen R, Green KJ, Stack MS. Proteinase suppression by E-cadherin-mediated cell-cell attachment in premalignant oral keratinocytes. Journal of Biological Chemistry. 2002;277(41):38159–38167. doi:https://doi.org/10.1074/jbc.M202384200.
- Takeichi M. Morphogenetic roles of classic cadherins. Curr Opin Cell Biol. 1995;7(5):619–627. doi:https://doi.org/10.1016/0955-0674(95)80102-2.
- Downer CS, Speight PM. E-cadherin expression in normal, hyperplastic and malignant oral epithelium. Eur J Cancer B Oral Oncol. 1993;29(4):303–305. doi:https://doi.org/10.1016/0964-1955(93)90053-H.
- Takeichi M. Cadherin cell adhesion receptors as a morphogenetic regulator. Science. 1991;251(5000):1451–1455. doi:https://doi.org/10.1126/science.2006419.
- Nagafuchi A. Molecular architecture of adherens junctions. Curr Opin Cell Biol. 2001;13(5):600–603. doi:https://doi.org/10.1016/S0955-0674(00)00257-X.
- Scanlon CS, Van Tubergen EA, Inglehart RC, D’Silva NJ. Biomarkers of epithelial-mesenchymal transition in squamous cell carcinoma. J Dent Res. 2013;92(2):114–121. doi:https://doi.org/10.1177/0022034512467352.
- Greene FL, Balch CM, Fleming ID, Fritz A, Haller DG, Morrow M, Page DL, editors. AJCC cancer staging handbook: TNM classification of malignant tumors. Springer Science & Business Media; 2002.
- Ramadas K, Lucas E, Thomas G, et al. A digital manual for the early diagnosis of oral neoplasia. Lyon, France: international Agency for Research on Cancer. 2008. https://screening.iarc.fr/atlasoral.php
- SEER Cancer Stat Facts: Oral cavity and pharynx cancer. National Cancer Institute. Bethesda, MD, https://seer.cancer.gov/statfacts/html/oralcav.html
- Upadhaya P, Barhoi D, Giri A, Bhattacharjee A, Giri S. Joint detection of claudin‐1 and junctional adhesion molecule‐A as a therapeutic target in oral epithelial dysplasia and oral squamous cell carcinoma. J Cell Biochem. 2019;120(10):18117–18127. doi:https://doi.org/10.1002/jcb.29115.
- Tsukita S, Yamazaki Y, Katsuno T, Tamura A, Tsukita S. Tight junction-based epithelial microenvironment and cell proliferation. Oncogene. 2008;27(55):6930–6938. doi:https://doi.org/10.1038/onc.2008.344.
- Meerschaert K, Tun MP, Remue E, De Ganck A, Boucherie C, Vanloo B, Degeest G, Vandekerckhove J, Zimmermann P, Bhardwaj N, et al. The PDZ2 domain of zonula occludens-1 and-2 is a phosphoinositide binding domain. Cellular and Molecular Life Sciences. 2009;66(24):3951–3966. doi:https://doi.org/10.1007/s00018-009-0156-6.
- Yu D, Marchiando AM, Weber CR, et al. MLCK-dependent exchange and actin binding region-dependent anchoring of ZO-1 regulate tight junction barrier function. Proceedings of the National Academy of Sciences. 2010;107:8237–8241.
- Qiu X, Wu Z, Wang X, et al. Expression of ZO-1 in laryngeal squamous cell carcinoma and its prognostic value. Int J Clin Exp Pathol. 2016;9:11615–11622.
- National Institute of Dental and Craniofacial Research. Oral cancer incidence (new cases) by age, race, and gender. https://www.nidcr.nih.gov/research/data-statistics/oral-cancer/incidence [accessed February 2021]
- Yuwanati MB, Tupkari JV, Avadhani A. Expression of E-cadherin in oral epithelial dysplasia and oral squamous cell carcinoma: an in vivo study. Journal of Clinical & Experimental Investigations/Klinik Ve Deneysel Arastirmalar Dergisi. 2011;2:4.
- Rosso M, Majem B, Devis L, Lapyckyj L, Besso MJ, Llauradó M, Abascal MF, Matos ML, Lanau L, Castellví J, et al. E-cadherin: a determinant molecule associated with ovarian cancer progression, dissemination and aggressiveness. PloS One. 2017;12(9):e0184439. doi:https://doi.org/10.1371/journal.pone.0184439.
- Fadare O, Reddy H, Wang J, Hileeto D, Schwartz PE, Zheng W. E-cadherin and β-catenin expression in early stage cervical carcinoma: a tissue microarray study of 147 cases. World J Surg Oncol. 2005;3(1):1. doi:https://doi.org/10.1186/1477-7819-3-38.
- Christou N, Perraud A, Blondy S, Jauberteau M-O, Battu S, Mathonnet M. E-cadherin: a potential biomarker of colorectal cancer prognosis. Oncol Lett. 2017;13(6):4571–4576. doi:https://doi.org/10.3892/ol.2017.6063.
- Sridevi U, Jain A, Velpula Nagalaxmi UV, Kumar UV, Goyal S. Expression of E-cadherin in normal oral mucosa, in oral precancerous lesions and in oral carcinomas. Eur J Dent. 2015;9(3):364. doi:https://doi.org/10.4103/1305-7456.163238.
- Kaur G, Carnelio S, Rao N, Kaur G. Expression of E-cadherin in primary oral squamous cell carcinoma and metastatic lymph nodes: an immunohistochemical study. Indian Journal of Dental Research. 2009;20(1):71. doi:https://doi.org/10.4103/0970-9290.49075.
- Kudo Y, Kitajima S, Ogawa I, Hiraoka M, Sargolzaei S, Keikhaee MR, Sato S, Miyauchi M, Takata T. Invasion and metastasis of oral cancer cells require methylation of E-cadherin and/or degradation of membranous β-catenin. Clinical Cancer Research. 2004;10(16):5455–5463. doi:https://doi.org/10.1158/1078-0432.CCR-04-0372.
- Christofori G, Semb H. The role of the cell-adhesion molecule E-cadherin as a tumour-suppressor gene. Trends Biochem Sci. 1999;24(2):73–76. doi:https://doi.org/10.1016/S0968-0004(98)01343-7.
- de Vicente JC, Fernandez-Valle A, Vivanco-Allende B, et al. The prognostic role of claudins-1 and-4 in oral squamous cell carcinoma. Anticancer Res. 2015;35:2949–2959.
- Dos Reis PP, Bharadwaj RR, Machado J, MacMillan C, Pintilie M, Sukhai MA, Perez-Ordonez B, Gullane P, Irish J, Kamel-Reid S, et al. Claudin 1 overexpression increases invasion and is associated with aggressive histological features in oral squamous cell carcinoma. Cancer: Interdisciplinary International Journal of the American Cancer Society. 2008;113(11):3169–3180. doi:https://doi.org/10.1002/cncr.23934.
- de Aquino AR, de Carvalho CH, Nonaka CF, Freitas RDA, de Souza LB, Pinto LP. Immunoexpression of claudin-1 and Nm23-H1 in metastatic and nonmetastatic lower lip squamous-cell carcinoma. Applied Immunohistochemistry & Molecular Morphology. 2012;20(6):595–601. doi:https://doi.org/10.1097/PAI.0b013e3182505c22.
- Dhawan P, et al. Claudin-1 regulates cellular transformation and metastatic behavior in colon cancer. J Clin Invest. 2005;115(7):1765–1776. doi:https://doi.org/10.1172/JCI24543.
- Xu J, Kausalya PJ, Phua DC, Ali SM, Hossain Z, Hunziker W. Early embryonic lethality of mice lacking ZO-2, but Not ZO-3, reveals critical and nonredundant roles for individual zonula occludens proteins in mammalian development. Mol Cell Biol. 2008;28(5):1669. doi:https://doi.org/10.1128/MCB.00891-07.