
ABSTRACT
Desmosomes are macromolecular cell-cell junctions critical for maintaining adhesion and resisting mechanical stress in epithelial tissue. Desmosome assembly and the relationship between maturity and molecular architecture are not well understood. To address this, we employed a calcium switch assay to synchronize assembly followed by quantification of desmosome nanoscale organization using direct Stochastic Optical Reconstruction Microscopy (dSTORM). We found that the organization of the desmoplakin rod/C-terminal junction changed over the course of maturation, as indicated by a decrease in the plaque-to-plaque distance, while the plaque length increased. In contrast, the desmoplakin N-terminal domain and plakoglobin organization (plaque-to-plaque distance) were constant throughout maturation. This structural rearrangement of desmoplakin was concurrent with desmosome maturation measured by E-cadherin exclusion and increased adhesive strength. Using two-color dSTORM, we showed that while the number of individual E-cadherin containing junctions went down with the increasing time in high Ca2+, they maintained a wider desmoplakin rod/C-terminal plaque-to-plaque distance. This indicates that the maturation state of individual desmosomes can be identified by their architectural organization. We confirmed these architectural changes in another model of desmosome assembly, cell migration. Desmosomes in migrating cells, closest to the scratch where they are assembling, were shorter, E-cadherin enriched, and had wider desmoplakin rod/C-terminal plaque-to-plaque distances compared to desmosomes away from the wound edge. Key results were demonstrated in three cell lines representing simple, transitional, and stratified epithelia. Together, these data suggest that there is a set of architectural programs for desmosome maturation, and we hypothesize that desmoplakin architecture may be a contributing mechanism to regulating adhesive strength.
Introduction
Cell junctions play critical roles including mediating cell-cell and cell-matrix adhesion, facilitating communication between neighboring cells, acting as signaling hubs, and regulating barrier permeability.Citation1 Desmosomes are specialized cell junctions found in cardiac and epithelial tissues including the lining of the urinary and digestive tract, cornea, and skin where they maintain adhesion between cells and are essential in resisting mechanical stress. Dysregulation of desmosomal proteins and desmosome function occurs in genetic and acquired diseases of the heart and skin and is implicated in cancer progression, highlighting the important role that these junctions play.Citation2,Citation3
Desmosomes are macromolecular complexes composed of transmembrane desmosomal cadherins, which mediate cell-cell interactions, and cytoplasmic plaque proteins that anchor the complex to the intermediate filament cytoskeleton. The desmosomal cadherins are structurally similar to classical cadherins found in adherens junctions.Citation4 Ca2+ mediates an extended conformation of the cadherin extracellular domain and is required for junction assembly.Citation5–7 Cadherin tails bind to plakoglobin and plakophilins proximal to the plasma membrane in the outer dense plaque. Desmoplakin is an obligate dimer with an N-terminal domain that binds to plakoglobin and plakophilins, a central coiled-coil rod domain that mediates dimerization, and a C-terminal domain that binds intermediate filaments and contributes to the inner dense plaque. There are two major desmoplakin splice isoforms which are expressed in a tissue-specific manner: desmoplakin I is full-lengthand desmoplakin II has a truncated rod domain.Citation8 Desmosomes are disk-shaped structures with a diameter of approximately 500 nm in the plane of the plasma membrane. They span across two cells and reach several hundred nanometers into the cytoplasm of each cell where they interact with intermediate filaments. While desmosomes are often described as spot welds, they have many dynamic features. Desmosomes are unique cell junctions in that they have two biochemically defined functional states, Ca2+-dependent and hyperadhesive, which can be modulated by PKCα-driven phosphorylation of desmoplakin junctions.Citation9,Citation10 Cadherins and plaque proteins can exchange in and out of Ca2+-dependent desmosomes.Citation11 Additionally, desmosomes are disassembled and reassembled throughout development and wound healing to accommodate tissue remodeling and cell migration.
Although the desmosome ultrastructure and protein architecture have been characterized by electron microscopy,Citation12 cryoelectron tomography,Citation13,Citation14 and super-resolution microscopy,Citation15 these studies looked only at static mature junctions and not dynamic architecture. This lack of dynamic information is most acute in our understanding of desmosome assembly. Although there is a characterization of the proteins essential for desmosome formation, proteins that minimally constitute a desmosome,Citation16–18 and the temporal dynamics of protein trafficking during assembly,Citation19–21 not much is known about the structural dynamics of how desmosomes are built, desmosome architecture, or the arrangement of proteins within desmosomes during assembly and maturation.
Our previous work investigated the molecular architecture of desmosomes in the weaker Ca2+-dependent and stronger hyperadhesive states using super-resolution direct stochastic optical reconstruction microscopy (dSTORM). This revealed a change in the position of the desmoplakin C-terminal and rod domains but not the N-terminal domain between adhesive states, indicating a rearrangement of desmoplakin correlating with the function.Citation15 During assembly, desmoplakin is recruited to desmosomes within the first 15 minutes.Citation20 Together, this makes desmoplakin an attractive candidate for potential architectural changes during assembly.
Here, we used dSTORMCitation22 to quantify changes in desmosome architecture during maturation and assembly. We utilized cell lines from three epithelial types: simple (Madin-Darby Canine Kidney; MDCK), transitional (Human Urothelial Cells; HUC), and stratified (Normal Human Epidermal Keratinocytes; NHEK) to identify universal features of assembly. Using dSTORM, we systematically mapped desmosome architecture during assembly and maturation. We elucidated changes in desmoplakin arrangement that correlated with E-cadherin enrichment and adhesive strength. A unique desmoplakin architecture correlated with nascent desmosomes in multiple assays. These findings suggest that desmosome architecture is modulated during assembly and maturation and could play a key role in regulating desmosome function and adhesive strength.
Results
Nanoscale architecture of desmoplakin changes during desmosome maturation
We first wanted to evaluate if there were changes in desmoplakin architecture during desmosome assembly. To address this question, a Ca2+-switch assay was utilized to coordinate desmosome assembly within a cell population. MDCK cells were cultured in low Ca2+ medium (0.01 mM) overnight, which is not favorable for desmosome maintenance or formation. The cells were switched to normal Ca2+ medium (1.8 mM) to initiate desmosome assembly and fixed after 3, 6, 8, 12, or 36 hours. To analyze the nanoscale architecture of individual desmosomes during the assembly and maturation process, the cells were immunostained for the desmoplakin rod/C-terminal domain and E-cadherin. (Initially, only desmoplakin was assessed; for E-cadherin analysis, see Figure.) Desmoplakin was labeled with an antibody specific for the last 50 AA of the rod domain (the rod/C-terminal junction), which is unique to desmoplakin I.
In widefield microscopy, desmoplakin appeared punctate and architectural features including discrete desmosomal plaques were not discernable. In contrast, super-resolution dSTORM revealed individual plaques contributed by each cell, revealing a railroad track morphology (). This mirror symmetry allowed us to identify individual desmosomeswith their axes in the x-y focal plane for analysis. The architectural features of individual desmosomes that we quantified were plaque length and plaque-to-plaque distance (). A line scan of fluorescence intensity along the axis perpendicular to the adhesive interface was created for each desmosome. The axial distribution of proteins, or plaque-to-plaque distance, was automatically measured using a custom MATLAB program as the distance between peaks from the line scan (). The plaque length was determined as the extent of fluorescence parallel to the adhesive interface. We found a progressive decrease in the average plaque-to-plaque distance with time in normal Ca2+ medium, 242 ± 30 nm (mean ± SD) at 3 h to 185 ± 41 nm at 36 h (, c). The plaque length increased between 3 and 12 h (210 ± 55 nm to 280 ± 79 nm) (, d).
Figure 1. Desmoplakin architecture changes as desmosome mature. (a) Images of desmosomes (MDCK cells labeled for desmoplakin rod/C-terminal domain) illustrating the improved resolution of direct stochastic optical reconstruction microscopy (dSTORM) compared to widefield microscopy. The region of interest shows a single desmosome and illustrates the measurements obtained from dSTORM images. The plaque-to-plaque distance is quantified as illustrated in the plot of fluorescence intensity as a function of distance for a line scan through the desmosome. Scale bar = 0.5 μm. (b-d) MDCK cells were stained for the desmoplakin rod/C-term junction following Ca2+ switch for 3, 6, 8, 12, and 36 h as indicated. (b) Representative dSTORM images of cell-cell borders at each timepoint. (c) Plaque-to-plaque distance and (d) plaque length at each timepoint (mean ± SD; datapoints are individual desmosomes). (e) HUC dSTORM images at 3 and 12 h, (f) plaque-to-plaque distance, and (g) plaque length at each timepoint (mean ± SD). (e) NHEK dSTORM images at 3 and 12 h, (f) plaque-to-plaque distance, and (g) plaque length at each timepoint (mean ± SD). (b, e and h) Scale bars = 1 μm. (ns, not significant, * P ≤ .05, ** P ≤ .01, *** P ≤ .001, and **** P ≤ .0001 by (c, d) ANOVA with post hoc Tukey’s test or f, g, i and j) Student’s t-test. (c and d) (MDCK 3 h n = 16, 6 h n = 19, 8 h n = 19, 12 h n = 37, and 36 h n = 23) and (f and g) (HUC 3 h n = 16 and 12 h n = 16); and (i and j) (NHEK 3 h n = 13 and 6 h n = 31). Experiments were performed in triplicate.
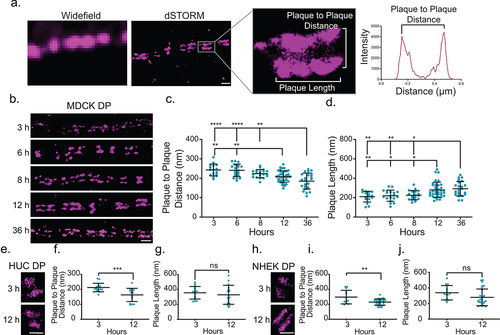
We next asked if the changes in desmoplakin architecture in the simple epithelial cell line MDCK were conserved in cells derived from transitional epithelia (HUC) and stratified epithelia (NHEK). HUCs and NKEKs were fixed at 3 and 12 hours following a Ca2+ switch and immunostained for the desmoplakin rod/C-terminal junction. In HUCs, the plaque-to-plaque distance of the desmoplakin rod/C-term junction significantly decreased from 3 to 12 hours (212 ± 28 to 163 ± 44 nm). However, there was no significant change in the plaque length (). Similarly, in NHEKs, the desmoplakin rod/C-terminal plaque-to-plaque distance decreased from 3 to 12 h (296 ± 91 to 230 ± 42 nm), while changes in the plaque length were insignificant (). Overall, we found that a decrease in the desmoplakin rod/C-terminal junction plaque-to-plaque distance during desmosome assembly was consistent across the cell types examined. These results suggest that the overall changes in desmoplakin organization during desmosome assembly are conserved, while the desmosome length may be differentially regulated between epithelial cell types.
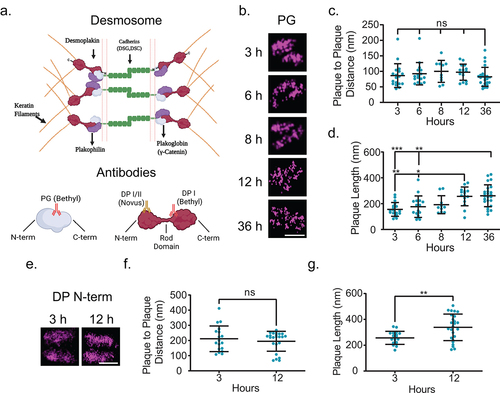
There are several possible factors that could be underlying the decrease in the plaque-to-plaque distance of the desmoplakin rod/C-terminal junction such as an isoform switch, a decrease of intercellular space, an overall movement of desmoplakin, or rearrangement of desmoplakin within the desmosomal plaque (). The rod/C-terminal domain antibody we utilized for dSTORM was raised against a region specific to desmoplakin I. Therefore, we do not consider a shift in desmoplakin isoforms to be an underlying mechanism for our results. Next, to address if other plaque proteins also underwent an architectural rearrangement, we performed a parallel analysis on plakoglobin, another essential desmosomal component (). There was no statistically significant change in the plakoglobin plaque-to-plaque distance across all time points (at 3 h, 86 ± 38 nm) (, c). The plakoglobin plaque length increased during maturation between 3 and 12 h (156 ± 53 to 256 ± 73 nm) (, d). Plakoglobin is located proximal to the plasma membrane in the outer dense plaque. Therefore, our results suggest that there is no change in the width of the extracellular space during maturation. Finally, to scrutinize if there was a movement of the entire desmoplakin protein or only certain domains within the plaque, we imaged cells labeled with an antibody to the desmoplakin N-terminal domain. There was no significant difference in the plaque-to-plaque distance between 3 and 12 h although there was an increase in the plaque length (). Together, these data indicate a domain-specific change in desmoplakin organization during desmosome assembly.
Figure 2. Desmoplakin architecture changes are due to rearrangement of the rod domain. (a) Schematic of protein arrangement in desmosomes and where the antibodies utilized in this study bind. (b-d) MDCK cells were stained for plakoglobin (PG) following Ca2+ switch 3, 6, 8, 12, or 36 h as indicated. (b) Representative dSTORM images, (c) plaque-to-plaque distance, and (d) plaque length. (e-g) MDCK cells were stained for desmoplakin N-terminal domain (DP N-term) 3 or 12 h following Ca2+ switch. (e) Representative dSTORM images, (f) plaque-to-plaque distance, and (g) plaque length. Scale bars = 0.25 μm. (mean ± SD ns not significant, * P ≤ .05, ** P ≤ .01, and *** P ≤ .001 by (c and d) ANOVA with post hoc Tukey’s test or (f and g) Student’s t-test). (b-d)(PG 3 h n = 18, 6 h n = 16, 8 h n = 10, 12 h n = 15, and 36 h n = 25) (e-g) (DP N-term 3 h n = 15 and 12 h n = 38) Experiments were performed in triplicate.
Architectural changes correlate with markers of desmosome maturation
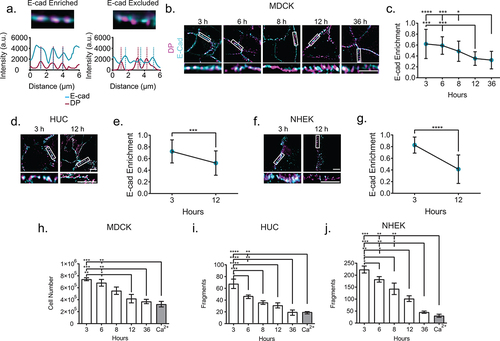
We wanted to know if the desmoplakin architectural changes occurred on the same timeline as desmosome maturation. E-cadherin facilitates desmosome assembly through an interaction with desmoglein 2 and is enriched in nascent desmosomes but excluded from mature desmosomes.Citation23–26 Therefore, we used colocalization of E-cadherin and desmoplakin as an indicator of desmosome maturation. MDCK cells were immunolabeled for desmoplakin and E-cadherin and imaged by widefield microscopy with deconvolution. Desmosomal enrichment of E-cadherin was quantified from intensity line scans along cell borders, where each peak of desmoplakin was assumed to represent a desmosome. Overlapping desmoplakin and E-cadherin peaks were considered to be desmosomes enriched for E-cadherin, while nonoverlapping desmoplakin peaks represent E-cadherin-excluded desmosomes (). More than 50% of desmoplakin puncta were enriched with E-cadherin at 3 and 6 h following the Ca2+ switch (, c). This percentage was significantly reduced at later time points (, c). While the percent of E-cadherin-enriched desmoplakin puncta decreased over time, we observed some puncta that contained E-cadherin present at all time points, indicating the potential presence of nascent desmosomes. We quantified fluorescence intensity to approximate the amount of each protein localized to the puncta at each time point. There was an inverse relationship, where E-cadherin intensity abruptly decreased between 3 and 6 h, while there was a corresponding abrupt increase of desmoplakin intensity between 6 and 8 h (Figure S1). This suggests that there was an increase in desmoplakin recruited to desmosomes as E-cadherin was excluded during assembly and maturation. To see if the decrease in E-cadherin enrichment over time was conserved, we examined HUC and NHEK cells. In both cell lines, we found that there were significantly more desmoplakin puncta enriched with E-cadherin at 3 h compared to 12 h (). To investigate if the observed desmoplakin architectural changes corresponded with desmosome function, we performed a mechanical cell dissociation (dispase) assay. We found reduced fragmentation with the increased time in normal Ca2+ medium, indicating increasing adhesive strength in all cell lines (). This supports the view that desmosomes acquire adhesion progressively during maturation, and that this functional increase corresponds to architectural changes. The timing of E-cadherin exclusion from desmosomes corresponds to that of desmoplakin rearrangement and desmosome lengthening, with 3 and 6 h representing nascent junctions, 12 and 36 h more mature junctions, and 8 h a transitional time in MDCK cells.
Figure 3. E-cadherin is excluded from the mature junction and adhesive function is increased. (a) Example of E-cadherin enrichment analysis. Line scans through at least three desmosomes (indicated by desmoplakin) are performed. If an E-cadherin intensity peak overlaps a desmoplakin intensity peak, as in the first panel, it is considered enrichment, while if a desmoplakin intensity peak does not overlap with a corresponding E-cadherin intensity peak, as in the second panel, it is considered excluded. (b) Representitive images of MDCK cells labeled for desmoplakin (magenta) and E-cadherin (cyan). (c) Quantification of E-cadherin enrichment (3 h n = 21, 6 h n = 21, 8 h n = 21, 12 h n = 21, and 36 h n = 21). (d) Representative images of HUCs and (e) quantification of E-cadherin enrichment (3 h n = 30 and 12 h n = 30). (f) Representative images of NHEKs (g) and quantification of E-cadherin enrichment (3 h n = 15 and 12 h n = 38) (b-g, experiments performed in triplicate.) (h-j) Quantification of dispase fragmentation assay at different time points after Ca2+ switch (mean ± sem) in (h) MDCK, (i) HUC, or (j) NHEK cells. (h) Single MDCK cells were counted using a hemocytometer and (i and j) HUC and NHEK fragments were counted manually under a dissecting microscope. n = 5 wells/timepoint, experiment performed in triplicate. Scale bar = 5 μm. * P ≤ .05, ** P ≤ .01, *** P ≤ .001, and **** P ≤.0001 by ANOVA with post hoc Tukey’s test.
E-cadherin is excluded as desmosome architecture changes
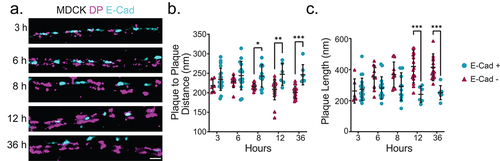
We found architectural changes during desmosome maturation which corresponded to exclusion of E-cadherin at a cell population level. However, E-cadherin enriched desmosomes were identified at all time points following the Ca2+ switch, even those that represent a mature population. Therefore, we wanted to assess if E-cadherin exclusion aligned with desmoplakin architectural changes in individual junctions. To do this, we reanalyzed the MDCK cells presented in labeled for both desmoplakin rod/C-terminal junction and E-cadherin with two-color dSTORM and classified desmosomes as E-cadherin-positive or E-cadherin-negative (). We found that E-cadherin-enriched desmosomes had a similar (wider) desmoplakin rod/C-terminal junction plaque-to-plaque distance regardless of time in normal Ca2+ medium and a similar shorter plaque length (, c). As expected, the proportion of E-cadherin-enriched desmosomes was smaller at later time points. In E-cadherin-negative desmosomes, the desmoplakin plaque-to-plaque distance decreased and plaque length increased in a time-dependent manner (, c). The consistent architecture of E-cadherin-enriched desmosomes regardless of time led us to postulate that nascent desmosomes are present, even at later time points, consistent with desmosome turnover.
Figure 4. Desmosome architectural changes correspond to E-cadherin exclusion in individual junctions. (a) Representative two-color dSTORM images of desmosomes in MDCK cells over time (magenta: desmoplakin rod/C-terminal junction and cyan: E-cadherin). Quantification of the desmoplakin plaque-to-plaque distance (b) and plaque length (c) according to whether E-cadherin was present (cyan) or not (magenta). (3 h n = 25, 6 h n = 25, 8 h n = 25, 12 h n = 25, and 36 h n = 25) Scale bar = 0.5 μm. * P ≤ .05, ** P ≤ .01, and *** P ≤ .001 by ANOVA with post hoc Tukey’s test.
Desmosome architecture is dynamic in migrating cells
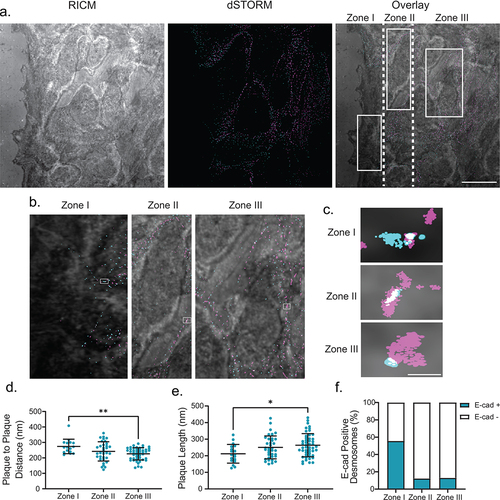
While the synchronization of desmosome assembly by Ca2+-switch assay was pivotal for quantifying architectural changes over time, it is a nonphysiological trigger for assembly. We wanted to see whether the architectural changes reported here occur when the assembly is initiated in a more physiologically relevant way. To address this, we performed a scratch wound assay with MDCK cells to stimulate cell migration, followed by fixation and staining for the desmoplakin rod/C-terminal junction and E-cadherin. For cells to accommodate wound repair, desmosomes are downregulated at the wound edge to allow for migration.Citation27,Citation28 To analyze changes in desmosome architecture in this model, we designated three zones: zone I was the wound edge and front half of cells , zone II was the back half of cells at the wound edge, and zone III was cells removed from the wound edge (). Within zone I, the wound edge contained no desmosomes as indicated by the absence of desmoplakin. The borders between adjacent cells contained desmosomes with a larger plaque-to-plaque distance (274 ± 47 nm) and shorter length (212 ± 56 nm) and over 50% were enriched for E-cadherin: similar to nascent desmosomes in the Ca2+ switch model (). In zone III, removed from the wound edge, desmosomes had a desmoplakin rod/C-terminal plaque-to-plaque distance of 226 ± 40 nm and a longer plaque length and were not enriched with E-cadherin, similar to mature desmosomes at 12 and 36 h in the Ca2+-switch model (). In zone II, desmosomes had intermediate architectural phenotypes and were largely not enriched with E-cadherin. This mixture of nascent and mature characteristics in zone II is reminiscent of desmosomes at the 8 h transitional time point in the Ca2+-switch model. These results show that nascent desmosomes in migrating cells and in the Ca2+-switch assay have similar architectural features regardless of the assembly trigger.
Figure 5. Changing architecture is consistent in migrating cells. (a) The left panel shows a representative RICM image of the scratch, the middle panel shows a two-color dSTORM image of desmosomes at the scratch (magenta: desmoplakin, cyan: E-cadherin), and the right panel shows the overlay of the RICM and dSTORM images. Desmosomes at the first half of the cells at the leading edge of the scratch are defined as Zone 1, the back half of the same cells are defined as Zone 2, and cells behind the leading edge are defined as Zone 3. (b) depicts a representative zoomed in the area of each Zone. (c) depicts a representative single desmosome from each corresponding zone. Quantification of plaque-to-plaque distance (d), plaque length (e), and percent E-cad-positive desmosomes (f) for each zone. (Zone I n = 16, Zone II n = 34, and Zone III n = 47). Scale bar = 5 μm (A) 0.25 μm (b,c). * P ≤ .05, ** P ≤ .01 by ANOVA with post hoc Tukey’s test.
Discussion
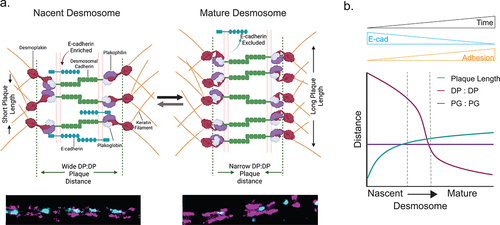
Here, we present changes to desmosome architecture that occur throughout assembly and maturation. We found that desmoplakin nanoscale organization changes at the rod/C-terminal junction, but not the N-terminal, suggesting a conformational change. This organizational change occurred concurrently with the exclusion of E-cadherin from desmosomes, suggesting that it may play a role in the maturation of the junction (). We confirmed these changes in three cell lines with different epithelial types, suggesting that desmoplakin architectural changes are a hallmark of a universal process associated with desmosome maturation.
Figure 6. (a) Model illustrating architectural changes that take place during desmosome assembly and maturation. In nascent desmosomes, E-cadherin is enriched, desmosomes are shorter, and the desmoplakin rod/C-term plaque-to-plaque distance is wider compared to that in mature desmosomes where E-cadherin is excluded, the desmoplakin rod/C-terminal junction plaque-to-plaque distance is narrow, and the plaque length is extended. These structural changes may play important roles in the increased adhesion of mature desmosomes. (b) Schematic of the trends of the plaque length (green), desmoplakin plaque-to-plaque distance (magenta), and plakoglobin plaque-to-plaque distance (purple) as desmosomes mature.
Utilizing the super-resolution imaging technique dSTORM to assess molecular architecture over time is a novel way to study desmosome maturation. While much has been learned about desmosome structure from other imaging approaches like fluorescence microscopy, electron microscopy, and cryoelectron tomography, dSTORM uniquely combines nanometer-scale spatial resolution, protein-specific labeling, and the ability to quantify multiple individual junctions, allowing us to make the discoveries reported here. Investigation of specific protein domains within the plaque revealed that there is a rearrangement of the desmoplakin rod/C-terminal junction. We did not see a change in the desmoplakin N-terminal domain or plakoglobin plaque-to-plaque distance. This suggests that the location of the desmoplakin N-terminal domain, which interacts with plakoglobin and plakophilin in the outer dense plaque, is static within the plaque, while the rod/C-terminal domain is dynamic within the inner dense plaque, moving closer to the plasma membrane during assembly and maturation. It has been postulated that desmoplakin conformation within the plaque may provide some flexibility and play a role in resisting mechanical stress.Citation29,Citation30 Our data stimulate interest in this hypothesis as the desmoplakin conformational changes aligned with the increasing adhesive function. The changes to desmoplakin conformation and overall desmosome architecture could impact antibody accessibility but should not alter specificity. We were able to detect labeling and conduct dSTORM imaging with each antibody at all timepoints, indicating that there was not a total obfuscation of the antibody binding site at any time point. However, we cannot make claims from our data regarding protein number as that would require single-molecule precision and a known antibody-to-protein labeling ratio.
The second architectural feature we quantified from the dSTORM images was desmosome length. There was a cell line-dependent difference in how the desmosome length changed with maturation: the length increased as E-cadherin was sorted out only in MDCK cells. Changes in the length are not unexpected, and an increase in desmosome length has also been observed in plakophilin 1 overexpression-induced hyperadhesion for example.Citation31 However, it is not known how desmosome length is regulated, and cell-type specific differences are possible. When interpreting our data, it is important to note that the doubling time of MDCK cells (~30 h) is approximately half that of NHEK or HUC cells (~60-115 h).Citation32–34 It is conceivable that the increase in the plaque length is a universal feature, which is not correlated with E-cadherin exclusion or adhesion but our timeline was not long enough to capture this in the NHEK and HUC cell lines.
The resolution of dSTORM also allowed identification of individual desmosomes, revealing structural heterogeneity, as compared to traditional studies that look at the bulk population. This allowed us to show that the nascent desmoplakin molecular organization was present in desmosomes enriched with E-cadherin at all time points following the Ca2+ switch. We hypothesize that desmosomes enriched for E-cadherin at later time points represent nascent desmosomes, present either due to basal levels of turnover or perhaps stalled in their assembly and unable to fully mature. It is alternately possible that these ‘mixed’ junctions play a functional role and are fundamentally different – perhaps similar to the area composite in cardiomyocytes where desmosomal proteins and adherens junction proteins comingle.Citation35,Citation36
Considering our data in the context of other epithelial junctions, we note that tight junctions and gap junctions are also known to undergo structural remodeling, although the underlying mechanisms have not been fully elucidated.Citation37,Citation38 The interplay between different cell junctions is complex, and junctions are historically studied in isolation, which makes investigating interactions between different cell junctions difficult.Citation39 Signaling and colocalization have been previously implicated in communication between some junctions. One possible way that desmosomes could impact other junctions is through an interaction between desmoplakin and microtubule binding proteins.Citation40,Citation41 This has been demonstrated by a mutation in desmoplakin, which leads to aberrant targeting of gap junction proteins as a result of misregulation of microtubule dynamics.Citation42 It is possible interactions with microtubule binding proteins that could be transmitted through architectural changes. The nature of junction architecture in different tissue types, and possible implications of architectural interactions between junctions, is a largely unexplored area with potential for great importance in understanding cell adhesion and communication.
The underlying mechanism responsible for regulating the active changes in desmosome architecture during assembly is still unknown. Mature desmosomes are associated with lipid rafts, where E-cadherin and adherens junctions are normally excluded from.Citation43,Citation44 Downregulation of the lipid-regulated kinase protein kinase C alpha (PKCα) leads to hyperadhesion via a loss of desmoplakin phosphorylation.Citation28,Citation45–47 With this in mind, it is possible that the arrangement of desmoplakin is driven by a change in the membrane environment as it is incorporated into the lipid raft and that this rearrangement may contribute to the accessibility of PKCα to further mediate changes in the adhesive state. The PKC family of proteins also regulates the adhesive state of the other cell junctions, presenting a possible opportunity for architectural control of signaling overlap in regulating junctional remodeling.Citation10Citation48–50 Alternately, desmoplakin rearrangement could be mediated by a conformational change in the N-terminal domain, which would confer large changes in the orientation, and plaque-to-plaque architecture, of the rod relative to the plasma membrane.Citation29,Citation51 These possibilities present exciting opportunities for future investigation. Understanding the relationship of how architecture drives assembly and ultimately functions is critical in our understanding of how desmosomes gain function and how it is dysregulated in disease states.
Materials and methods
Cell culture
Madin-Darby canine kidney epithelial cells (MDCK) (ATCC, Manassas, VA) were cultured in Dulbecco’s Modified Eagle’s Medium (DMEM) (Corning, Corning, NY), and SV40 immortalized human urothelial cells (HUC) (ATCC, Manassas, VA) were cultured in F12-K medium (Corning, Corning, NY). Both cell line’s media were supplemented with 10% Fetal Bovine Serum (FBS) (Corning, Corning, NY) and 100 U/mL Pen/Strep (Corning, Corning, NY). Normal human epidermal keratinocytes (NHEK) (Lonza, Walkersville, MD) were cultured in supplemented KBM-Gold (Lonza). All cells were maintained at 37°C and 5% CO2. For imaging, cells were either seeded onto 8-well #1.5 coverslip bottom dishes (Ibidi, Madison, WI) or 25 mm #1.5 coverslips (Electron Microscopy Sciences, Hatfield, PA). For dispase assays, cells were grown in 12-well plates (Corning, Corning, NY).
Calcium switch assay
Low Ca2+ medium for MDCK and SV-HUC cells was made by incubating FBS with 3.8 g of Chelex resin (Bio-Rad, Hercules, CA) for 1 h, rotating at 4°C, followed by sterile filtration and supplementation with 3 mM EGTA (Millipore, Billerica, MA).Citation28 10% low Ca2+ FBS was added to Ca2+ free DMEM or F12K, which was then supplemented with 0.1 mM CaCl2. Normal Ca2+ medium for MDCK and SV-HUC cells was normal Ca2+ DMEM or F12K with 10% FBS. KMB-Gold Ca2+-free medium with 0.1 mM CaCl2 and KMB-Gold normal Ca2+ medium were utilized for NHEK cells. Following plating, all cells were cultured in low Ca2+ medium (~0.1 mM) for 24 h and then switched to normal Ca2+ medium (~1.8 mM) at time = 0 h to initiate desmosome assembly.
Scratch wound assay
MDCK cells were grown to confluency on glass coverslips under normal growth conditions. Once cells reach confluency, a P200 pipette tip was firmly dragged in a straight line down the center of the coverslip. Slides were fixed 24 hours after initial scratch and then prepared for immunofluorescence as detailed below.
Antibodies
Primary antibodies were antidesmoplakin (rod/C-term domain) (A303-356A, Bethyl Labs, Montgomery, TX), antidesmoplakin (N-term) (NBP2-4883, Novus Biologicals, Littleton, CO), antiE-cadherin (610182, BD Biosciences, Franklin Lakes, NJ), and antiplakoglobin (A303-718A, Bethyl Labs) used at concentrations as suggested by the manufacturer. Secondary antibodies were Alexa488-conjugated goat antimouse and Alexa647-conjugated goat antirabbit (Invitrogen, Grand Island, NY) used at a concentration of 1:1000.
Immunofluorescence
Cells were fixed in 1:1 solution of ice-cold methanol and acetone for 10 minutes at 4°C (Fisher Scientific, Waltman, MA) and then washed five times and blocked in 3% Bovine Serum Albumin (BSA), 0.05% Normal Horse Serum (NHS) and 0.05% Normal Goat Serum (NGS). Samples were incubated with primary antibody for 1 h at 37°C, washed 5 times, incubated with secondary antibody for 30 min at 37°C, washed 5 times, and stored at 4°C in PBS.
Microscopy
Widefield images were acquired using a Nikon Ti-2 microscope equipped with a 60 × 1.49NA objective and an ORCA-Flash 4.0 v3 sCMOS camera (Hamamatsu, Hamamatsu City, Japan). Images were deconvolved with Nikon Elements by the Richard-Lucy method for 20 iterations. dSTORM experiments were conducted on a Nikon Ti-2 N-STORM microscope equipped with a 100 × 1.49NA oil immersion objective, 488 and 647 nm lasers, and an iXon ultra EMCCD camera (Andor, Oxford Instruments). 60,000–80,000 frames were collected with subcritical inclined excitation and reconstructed in Nikon Elements. dSTORM imaging buffer included glucose oxidase (Sigma, St Louis, Missouri), glucose (Sigma), catalase (Roche, Penzberg, Germany), and β-mercaptoethanol (Sigma)Citation52, Citation53. A detailed dSTORM protocol has been described previously.Citation15
Image analysis
To determine if desmosomes were E-cad-positive or E-cad-negative, deconvolved widefield images were analyzed with Nikon Elements. Intensity was plotted from line scans at least 5 um long along cell borders with multiple desmosomes. Each desmoplakin peak was considered a desmosome. Desmoplakin peaks that overlapped with E-cadherin peaks were considered E-cadherin-positive, while those that did not were considered E-cadherin-negative. dSTORM images were analyzed as previously described.Citation15,52 In brief, images were analyzed using a semiautomated MATLAB program (Mathworks, Natic, MA). Individual desmosomes were manually identified, then excised, and aligned, so the desmosome axis was horizontal. Intensity was measured along the desmosome axis by averaging all pixels along the desmosome length. Line scans were normalized, smoothed, and the peak finder function (40% intensity peak threshold) identified with two peaks for quantification. Custom MATLAB scripts are available upon request.
Dispase fragmentation assay
Cells were grown to 100% confluence in 12-well plates. Cells were cultured in low Ca2+ overnight and then switched to normal Ca2+ medium accordingly prior to the application of Dispase II (Sigma-Aldrich) at a concentration of 1 U/ml dispase for 30–45 min. Once cells were lifted, they were subjected to mechanical stress by pipetting, fixed in paraformaldehyde, and counted using a dissecting microscope (fragments – HUC and NHEK) or hemocytometer (single cells – MDCK).
Data availibility statement
Raw microscopy image files are available upon request.
Author contributions
Conceptualization: RRB, TCR, APK, and ALM; Data Curation: RRB; Formal Analysis: RRB and TCR; Funding Acquisition: ALM; Investigation: RRB and TCR; Methodology: RRB, TCR, and WFD; Project Administration: RRB, TCR, and ALM; Resources: APK and ALM; Visualization: RRB, TRC; Writing - Original Draft Preparation: RRB; Writing - Review and Editing: RRB, TCR, WFD, APK, and ALM.
Supplemental Material
Download EPS Image (1.6 MB)Acknowledgments
This work was supported by R01AR072697 to ALM and R01AR048266 to APK. RRB was supported by T32CA183926. This research was supported in part by National Cancer Institute Cancer Center Support Grant P30CA013148 and the UAB High Resolution Imaging Facility.
Disclosure statement
No potential conflict of interest was reported by the author(s).
Supplementary material
Supplemental data for this article can be accessed on the publisher’s website
Additional information
Funding
References
- Garcia MA, Nelson WJ, Chavez N. Cell-cell junctions organize structural and signaling networks. Cold Spring Harb Perspect Biol. 2018;10(4):1.
- Broussard JA, Getsios S, Green KJ. Desmosome regulation and signaling in disease. Cell Tissue Res. 2015;360:501–14.
- Stahley SN, Kowalczyk AP. Desmosomes in acquired disease. Cell Tissue Res. 2015;360:439–456.
- Saito M, Tucker DK, Kohlhorst D, Niessen CM, Kowalczyk AP. Classical and desmosomal cadherins at a glance. J Cell Sci. 2012;125:2547–2552.
- Harrison OJ, Brasch J, Lasso G, Katsamba PS, Ahlsen G, Honig B, Shapiro L. Structural basis of adhesive binding by desmocollins and desmogleins. Proc Natl Acad Sci U S A. 2016;113:7160–7165.
- Pokutta S, Herrenknecht K, Kemler R, Engel J. Conformational changes of the recombinant extracellular domain of E-cadherin upon calcium binding. European Journal of Biochemistry. 1994;223:1019–1026.
- Sotomayor M, Schulten K. The allosteric role of the Ca2+ switch in adhesion and elasticity of C-cadherin. Biophys J. 2008;94:4621–4633.
- Angst BD, Nilles LA, Green KJ. Desmoplakin II expression is not restricted to stratified epithelia. J Cell Sci. 1990;97:247–257.
- Garrod D, Tabernero L. Hyper-adhesion: a unique property of desmosomes. Cell Commun Adhes. 2014;21:249–256.
- Hobbs RP, Green KJ. Desmoplakin regulates desmosome hyperadhesion. J Invest Dermatol. 2012;132:482–485.
- Bartle EI, Rao TC, Beggs RR, Dean WF, Urner TM, Kowalczyk AP, Mattheyses AL. Protein exchange is reduced in calcium-independent epithelial junctions. J Cell Biol. 2020;219(6):e201906153.
- North AJ, Bardsley WG, Hyam J, Bornslaeger EA, Cordingley HC, Trinnaman B, Hatzfeld M, Green KJ, Magee AI, Garrod DR. Molecular map of the desmosomal plaque. J Cell Sci. 1999;112:4325–4336.
- Al-Amoudi A, Castano-Diez D, Devos DP, Russell RB, Johnson GT, Frangakis AS. The three-dimensional molecular structure of the desmosomal plaque. Proc Natl Acad Sci U S A. 2011;108:6480–6485.
- Sikora M, Ermel UH, Seybold A, Kunz M, Calloni G, Reitz J, Vabulas RM, Hummer G, Frangakis AS. Desmosome architecture derived from molecular dynamics simulations and cryo-electron tomography. Proc Natl Acad Sci U S A. 2020;117:27132–27140.
- Stahley SN, Bartle EI, Atkinson CE, Kowalczyk AP, Mattheyses AL. Molecular organization of the desmosome as revealed by direct stochastic optical reconstruction microscopy. J Cell Sci. 2016;129:2897–2904.
- Garrod D, Chidgey M. Desmosome structure, composition and function. Biochimica Et Biophysica Acta (BBA) - Biomembranes. 2008;1778:572–587.
- Koeser J, Troyanovsky SM, Grund C, Franke WW. De novo formation of desmosomes in cultured cells upon transfection of genes encoding specific desmosomal components. Exp Cell Res. 2003;285:114–130.
- Kowalczyk AP, Borgwardt JE, Green KJ. Analysis of desmosomal cadherin–adhesive function and stoichiometry of desmosomal cadherin-plakoglobin complexes. Journal of Investigative Dermatology. 1996;107:293–300.
- Aoyama Y, Yamamoto Y, Yamaguchi F, Kitajima Y. Low to high Ca2+ -switch causes phosphorylation and association of desmocollin 3 with plakoglobin and desmoglein 3 in cultured keratinocytes. Exp Dermatol. 2009;18:404–408.
- Godsel LM, Hsieh SN, Amargo EV, Bass AE, Pascoe-mcgillicuddy LT, Huen AC, Thorne ME, Gaudry CA, Park JK, Myung K, et al. Desmoplakin assembly dynamics in four dimensions: multiple phases differentially regulated by intermediate filaments and actin. Journal of Cell Biology. 2005;171:1045–1059.
- Nekrasova O, Green KJ. Desmosome assembly and dynamics. Trends Cell Biol. 2013;23:537–546.
- Heilemann M, van de Linde S, Schüttpelz M, Kasper R, Seefeldt B, Mukherjee A, Tinnefeld P, Sauer M. Subdiffraction-resolution fluorescence imaging with conventional fluorescent probes. Angew Chem Int Ed Engl. 2008;47(33):6172–6176. doi:10.1002/anie.200802376
- Michels C, Buchta T, Bloch W, Krieg T, Niessen CM. Classical cadherins regulate desmosome formation. J Invest Dermatol. 2009;129:2072–2075.
- Shafraz O, Rubsam M, Stahley SN, Caldara AL, Kowalczyk AP, Niessen CM, Sivasankar S. E-cadherin binds to desmoglein to facilitate desmosome assembly. Elife. 2018;7:e37629.
- Shafraz O, Xie B, Yamada S, Sivasankar S. Mapping transmembrane binding partners for E-cadherin ectodomains. Proceedings of the National Academy of Sciences. 2020;117:31157–31165.
- Wheelock MJ, Jensen PJ. Regulation of keratinocyte intercellular junction organization and epidermal morphogenesis by E-cadherin. J Cell Biol. 1992;117:415–425.
- Roberts BJ, Pashaj A, Johnson KR, Wahl JK. Desmosome dynamics in migrating epithelial cells requires the actin cytoskeleton. Exp Cell Res. 2011;317:2814–2822.
- Wallis S, Lloyd S, Wise I, Ireland G, Fleming TP, Garrod D. The alpha isoform of protein kinase C is involved in signaling the response of desmosomes to wounding in cultured epithelial cells. Mol Biol Cell. 2000;11:1077–1092.
- Al-Jassar C, Bernadomicron P, Chidgey M, Overduin M. Hinged plakin domains provide specialized degrees of articulation in envoplakin, periplakin and desmoplakin. PLoS One. 2013;8:e69767.
- Price AJ, Cost A-L, Ungewiß H, Waschke J, Dunn AR, Grashoff C. Mechanical loading of desmosomes depends on the magnitude and orientation of external stress. Nat Commun. 2018;9:5284.
- Tucker DK, Stahley SN, Kowalczyk AP. Plakophilin-1 protects keratinocytes from pemphigus vulgaris IgG by forming calcium-independent desmosomes. J Invest Dermatol. 2014;134:1033–1043.
- Butler M, Burgener A, Patrick M, Berry M, Moffatt D, Huzel N, Barnabe N, Coombs K. Application of a serum-free medium for the growth of Vero cells and the production of reovirus. Biotechnol Prog. 2000;16:854–858.
- Christian BJ, Loretz LJ, Oberley TD, Reznikoff CA. Characterization of human uroepithelial cells immortalized in vitro by simian virus 40. Cancer Res. 1987;47:6066–6073.
- Ma HQ, Feng J, Chyczewski L, Niklinski J. Biological properties of differently-aged human keratinocytes: population doubling time growth curve and cell cycle analysis. Academic Journal of Xi’an Jiaotong University. 2009;21:129–133.
- Borrmann CM, Grund C, Kuhn C, Hofmann I, Pieperhoff S, Franke WW. The area composita of adhering junctions connecting heart muscle cells of vertebrates. II. Colocalizations of desmosomal and fascia adhaerens molecules in the intercalated disk. Eur J Cell Biol. 2006;85:469–485.
- Franke WW, Borrmann CM, Grund C, Pieperhoff S. The area composita of adhering junctions connecting heart muscle cells of vertebrates. I. Molecular definition in intercalated disks of cardiomyocytes by immunoelectron microscopy of desmosomal proteins. Eur J Cell Biol. 2006;85:69–82.
- Musil LS, Le A-CN, VanSlyke JK, Roberts LM. Regulation of connexin degradation as a mechanism to increase gap junction assembly and function *. Journal of Biological Chemistry. 2000;275:25207–25215.
- Varadarajan S, Stephenson RE, Miller AL. Multiscale dynamics of tight junction remodeling. J Cell Sci. 2019;132:jcs229286.
- Franke WW. Discovering the molecular components of intercellular junctions–a historical view. Cold Spring Harb Perspect Biol. 2009;1:a003061.
- Lechler T, Fuchs E. Desmoplakin: an unexpected regulator of microtubule organization in the epidermis. J Cell Biol. 2007;176:147–154.
- Sumigray KD, Chen H, Lechler T. Lis1 is essential for cortical microtubule organization and desmosome stability in the epidermis. J Cell Biol. 2011;194:631–642.
- Patel DM, Dubash AD, Kreitzer G, Green KJ. Disease mutations in desmoplakin inhibit Cx43 membrane targeting mediated by desmoplakin-EB1 interactions. J Cell Biol. 2014;206:779–797.
- Lewis JD, Caldara AL, Zimmer SE, Stahley SN, Seybold A, Strong NL, Frangakis AS, Levental I, Wahl JK 3rd, Mattheyses AL, et al. The desmosome is a mesoscale lipid raft-like membrane domain. Mol Biol Cell. 2019;30:1390–1405.
- Stahley SN, Saito M, Faundez V, Koval M, Mattheyses AL, Kowalczyk AP. Desmosome assembly and disassembly are membrane raft-dependent. PLOS ONE. 2014;9:e87809.
- Albrecht LV, Zhang L, Shabanowitz J, Purevjav E, Towbin JA, Hunt DF, Green KJ. GSK3- and PRMT-1-dependent modifications of desmoplakin control desmoplakin-cytoskeleton dynamics. J Cell Biol. 2015;208:597–612.
- Bass-Zubek AE, Hobbs RP, Amargo EV, Garcia NJ, Hsieh SN, Chen X, Wahl JK 3rd, Denning MF, Green KJ. Plakophilin 2: a critical scaffold for PKC alpha that regulates intercellular junction assembly. J Cell Biol. 2008;181:605–613.
- Kröger C, Loschke F, Schwarz N, Windoffer R, Leube RE, Magin TM. Keratins control intercellular adhesion involving PKC-α-mediated desmoplakin phosphorylation. J Cell Biol. 2013;201:681–692.
- Lewis JE, Jensen PJ, Johnson KR, Wheelock MJ. E-cadherin mediates adherens junction organization through protein kinase C. J Cell Sci. 1994;107:3615–3621.
- Morley M, Jones C, Sidhu M, Gupta V, Bernier SM, Rushlow WJ, Belliveau DJ. PKC inhibition increases gap junction intercellular communication and cell adhesion in human neuroblastoma. Cell Tissue Res. 2010;340:229–242.
- Stuart RO, Nigam SK. Regulated assembly of tight junctions by protein kinase C. Proc Natl Acad Sci U S A. 1995;92:6072–6076.
- Al-Jassar C, Knowles T, Jeeves M, Kami K, Behr E, Bikker H, Overduin M, Chidgey M. The nonlinear structure of the desmoplakin plakin domain and the effects of cardiomyopathy-linked mutations. J Mol Biol. 2011;411:1049–1061.
- Beggs RR, Dean WF, Mattheyses AL. 2020. dSTORM imaging and analysis of desmosome architecture. In: Turksen K, editor. Permeability Barrier. Methods in Molecular Biology. New York (NY): Humana; p. 2367.
- Rust MJ, Bates M, Zhuang X. Sub-diffraction-limit imaging by stochastic optical reconstruction microscopy (STORM). Nat Methods. 2006;3(10):793–795. doi:10.1038/nmeth929.