
Abstract
The expression of miRNA influencing the pathogenesis of OS have been reported previously, however, different samples selection and sequencing platforms made obvious differences in miRNA expression analysis. We aim to identify reliable prognostic and treatment biomarkers for OS by systematic analysis of miRNAs expression data sets from biased data set. Seven miRNA data sets were selected from corresponding articles. Collectively, two miRNAs, hsa-miR-19-3p and hsa-miR106b-3p, and transcription factor SIX3 were identified and may be reliable markers for prognostic and treatment of osteosarcoma.
Introduction
Osteosarcoma (OS) remained the most common and destructive primary bone tumor that affected children and adolescent. It was characterized by malignant osteoid production and osteoblastic differentiation. Although OS have been treated with chemotherapy for decades, patients with recurrent or metastatic OS still had very poor prognosis (Ottaviani and Jaffe Citation2009, Tan et al. Citation2009).
To date, however, the molecular pathogenesis and etiology of OS were still not clearly elucidated. Micro-RNA (miRNA), a short conserved non-coding RNA with 22–24 nucleotides long, was believed to be a promising diagnostic and prognostic tool of malignant neoplasm (Doench and Sharp Citation2004). MiRNA bound to the sufficient target mRNA, which led to mRNA degradation or preventing mRNA from being translated. Therefore, miRNAs regulated target genes expression at post-transcriptional level. Over-expression of miRNAs usually caused the decreased expression of target genes. Evidence showed that 98 miRNAs located at fragile sites and genomic regions involved in cancer, indicating that miRNAs were closely related to tumorigenesis and development (Calin et al. Citation2004). MiRNAs played a critical role in tumor growth, progression, metastasis, and drug resistance through regulating the expression of oncogenes or tumor suppressor genes (Shi et al. Citation2008, Skaftnesmo et al. Citation2007). However, different sample selection and sequencing platform made an obvious discrepancy in miRNA expression analysis.
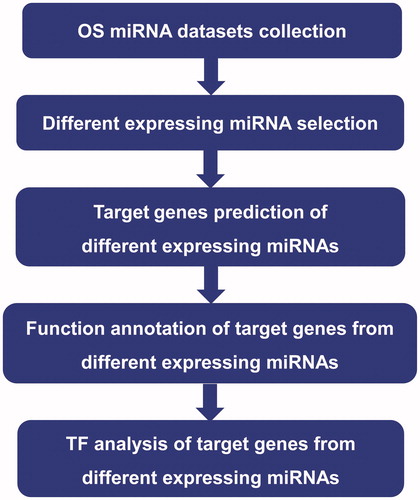
In this study, meta-analysis was used to determine the key miRNA in the process of the onset of OS. Then, target genes corresponding to the differential expression miRNAs (DEMs) were predicted and its functions were annotated. Furthermore, transcription factor analysis was analyzed using Tfacts database. This study demonstrated vital significance of miRNA in prevention and treatment of OS.
Materials and methods
Screening of miRNA expression data sets and DEMs in osteosarcoma
“Oseteosarcoma” and “miRNA” were used as key words to retrieve the existing articles of miRNA expression in OS in the Google academic web site (https://scholar.google.com), and the expression dates were carefully screened. Only articles in which miRNAs sequence of samples with OS and contrast were in detail were selected and subsequently analyzed. In these articles, specific DEMs were extracted, and statistics of up- and down-regulated DEMs compared to the control samples were listed. Number of DEMs was counted in independent data set. Only DEMs appearing at least three separate data sets were reserved. The overall workflow for this study is showed in .
Figure 1. The analysis process of this study.
Target genes of DEMs in osteosarcoma
The sequence information of DEMs were retrieved in miRBase (Griffiths-Jones et al. Citation2008, Kozomara and Griffiths-Jones Citation2011) and collated in fasta files. Target Scan (Lewis et al. Citation2005) software was adopted to predict corresponding target genes of DEMs using the default parameters.
Functional enrichment analysis of the target genes of DEMs in osteosarcoma
Gene Ontology (GO) and Pathway analyses were used to annotate the forecasted DEMs by using DAVID database (Dennis et al. Citation2003). Top ten GO terms of biological processes in GO annotation results were extracted out, and pathways were screened with FDR value less than 0.05.
Transcription factor analysis of up- and down-regulated DEMs in osteosarcoma
Target genes corresponding to up- and down-regulated miRNA were analyzed by using Tfacts database (Essaghir et al. Citation2010) (http://www.tfacts.org/). Only transcription factors predicted with four indexes (P values, q-value, E-value and FDR) less than 0.05 were considered to be reliable transcription factors. Statistics on transcription factors of target genes of up- and down-regulated DEMs were made to select the shared and specific transcription factors between up- and down-regulated DEMs.
Results
Screening of differentially expressed miRNA
After retrieval, seven independent miRNA expression data sets were selected from the existing researched of miRNA expression in OS, in which the data set provided detailed miRNA expression date and up- and down-regulated DEMs compared to the control sample. For convenience, these seven miRNA expression data sets were numbered in detail as follows: data set 1 (Maire et al. Citation2011), data set 2 (Namløs et al. Citation2012), data set 3 (Jones et al. Citation2012), data set 4 (Duan et al. Citation2011), data set 5 (Hu et al. Citation2012), data set 6 (Zhao et al. Citation2013), and data set 7 (Thayanithy et al. Citation2012).
Detailed information including the type, size, the number of sample and the type and number of chip were listed (). Furthermore, DEMs were validated by qPCR in all articles of these seven data sets, indicating the results more reliable.
Table 1. Information of all seven data sets.
Distribution of DEMs in all seven data sets were analyzed using SVG. The results showed that there were big differences in both up- and down-regulated miRNAs between different data sets (). Statistics were further made to demonstrate the number of up- and down-regulated miRNA in each data set ().
Figure 2. Distribution of DEMs alterations in OS as reported by primary studies. Short vertical bars indicate down- or up-regulated miRNA. There were significant differences in both up-regulated and down-regulated miRNAs between different data sets.
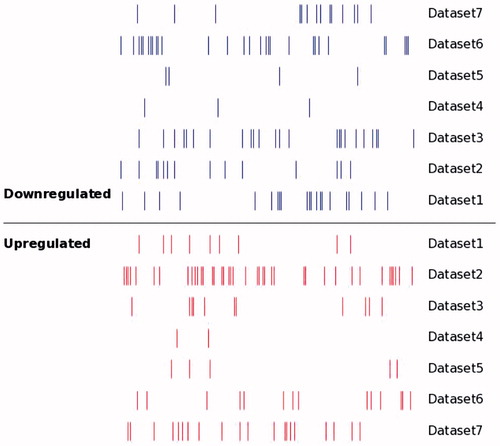
Figure 3. Statistics of the number of up- and down-regulated miRNA in the existing seven independent miRNA expression data set in osteosarcoma the left pillars in each dataset represents the quantity of up-regulated miRNA compared with the normal sample tissue expression; the right pillars in each dataset represents the quantity of down-regulated miRNA.
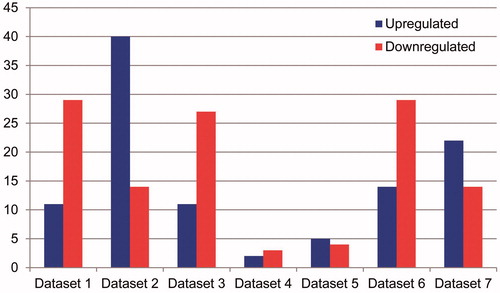
In the seven existing OS miRNA expression data sets, numbers of DEMs were different. Numbers of DEMs in five data sets were more than 30, however, numbers of DEMs in other two data sets were less than 10, that were data set 4 with 5 DEMs and data set 5 with 9 DEMs, respectively. In these seven existing miRNA expression data sets, up-regulated DEMs were most in data set 2 with 40 up-regulated DEMs, followed by the data set 7 with 22 up-regulated DEMs. Data set 2 possessed the least up-regulated DEMs, only 2. The other hand, data set 1 and data set 6 possessed the same and largest number of down-regulated DEMs, 29, followed by data set 3 with 27. In data set 4, the number of down-regulated DEMs was the least, only 3.
Screening and location of DEMs
DEMs were extracted from the corresponding literature compared with the control samples (). In these seven independent data sets, there were 65 non-redundant up-regulated miRNAs and 76 non-redundant down-regulated miRNAs, which corresponded to different data sets. To up-regulated miRNAs, total number of data set specific up-regulated miRNAs was 40, accounting for 61.5% of the total number of non-redundant up-regulated miRNAs. On the other hand, total number of data set specific down-regulated miRNAs was 51, accounting for 67.1% of total down-regulated non-redundant miRNAs. No matter up-regulated or down-regulated miRNA, proportion of data set specific miRNA in non-redundant miRNAs were more than 60%, which indicated that the existing sequencing results in OS miRNA expression profile showed great difference from each other. Therefore, it was significant to analyze the miRNA expression in OS by bioinformatics analysis.
Figure 4. Number of up- and down-regulated miRNA correspond to the seven independent data set.
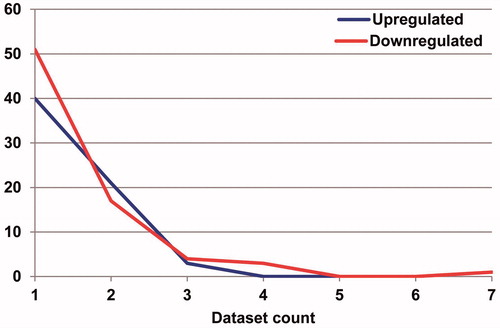
Based on the support of data sets, reliable DEMs were selected, which were supported by 3 data sets at least. According to this standard, 4 up-regulated and 8 down-regulated miRNAs were screened to be high trustworthy miRNAs. Detailed location information of miRNAs was analyzed by using miRBase database (). Of these 12 DEMs, there was 3 miRNAs in chromosome 14 with the largest number of miRNAs, accounting for 25% of DEMs, followed by chromosome 7, chromosome 13 and chromosome 19, with two miRNA. There was one miRNA in chromosome 9, chromosome 17 and chromosome 18, respectively.
Table 2. List of miRNA with meta characteristics in osteosarcoma.
Target gene prediction of DEMs
Target genes of these 12 DEMs were predicted using TargetScan software (Cambridge, MA). Though all parameters used were default, the numbers of predicted target genes were different. Number of predicted target genes by the hsa-miR-19–3p was the most with 1330, followed by hsa-miR106b-3p with 698 target genes. According to the default parameters, the numbers of predicted target genes of the other 10 DEMs were 100. According to the number of predicted target genes, miRNA possessed different conservative. As we all know, the more miRNA were conservative, the more target genes were in the genome. According to the results, hsa-miR-19–3p and hsa-miR106b-3p were highly conservative, but the other 10 miRNAs had the same level of conservatism.
Function analysis of target genes of DEMs
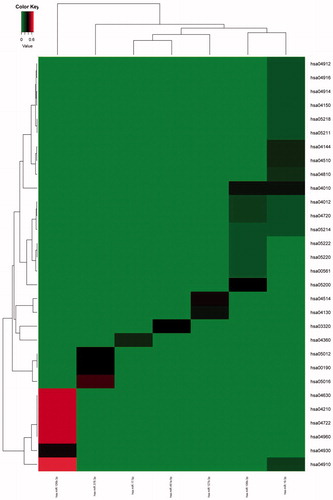
Enriched metabolic pathways of target genes regulated by each specific miRNAs were extracted out (). Pathways enrichment of target genes corresponding to seven of twelve DEMs were established and enrichment level of metabolic pathways were different. According to the analysis, target genes of miR-106-b-3p possessed the most extensive pathway enrichment and the highest pathway enrichment degree.
Figure 5. Metabolic pathways enrichment of target genes of miRNA Target genes of Seven out of 12 DEMs possessed appropriate Pathway enrichment. The gradient from green to red represents the corresponding Pathway proportion (%) of the terms in the miRNA target genes, and the deeper the color, the higher the proportion.
Functional annotations of target genes of up- and down-regulated miRNA were analyzed by DAVID. Top ten of significant difference biological processes and pathways with FDR <0.05 were selected. Significantly enriched processes of up-regulated miRNA were associated with regulating transcription and RNA metabolism in OS (), indicating that target genes of up-regulated miRNA were primarily transcription factor by strengthening the regulation of transcription factor to enhance regulation of gene expression. Target genes of down-regulated miRNA played a role in regulating phosphorus metabolic processes and secretion of tumor necrosis factor, however, the biological significance of them in OS need further study ().
Table 3. GO annotation of target genes of up-regulated miRNA in osteosarcoma.
Table 4. GO annotation of target genes of down-regulated miRNA in osteosarcoma.
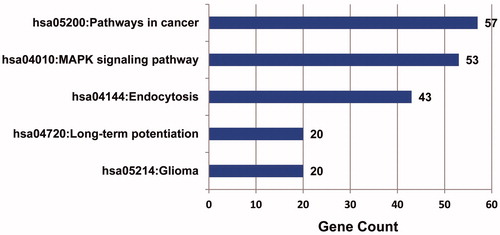
Enriched metabolic pathways of target genes of miRNA were selected with FDR <0.05 (). The results showed that target genes of up-regulated miRNA were mainly associated with six main metabolic pathways, namely endocytosis, MAPK signaling pathways, glioma, long-term potentiation, ErbB signaling pathways and cancer signaling pathways, and the number of genes in cancer signaling pathway enrichment was the largest, suggesting that up-regulated miRNA influenced the pathogenesis of OS through participating in a variety of metabolic pathways to regulate the expression of target genes. Analysis showed that there was no significantly enriched pathway of target genes corresponding to down-regulated miRNA in OS.
Figure 6. Metabolic pathways enrichment analysis of target genes of up-regulated miRNA in osteosarcoma Target genes of up-regulated miRNA were mainly enriched in four pathways, with cancer possessing the highest enrichment degree.
Transcription factors analysis of target genes of DEMs
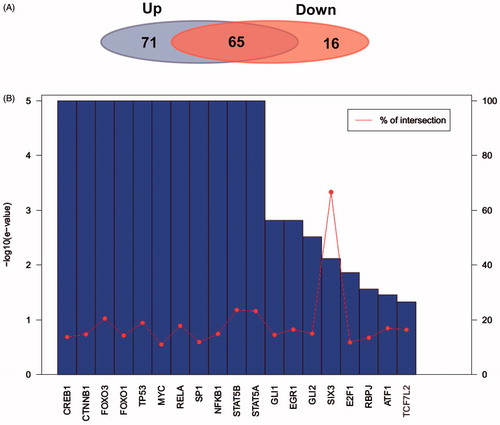
Transcription factors corresponding to target genes of up- and down-regulated miRNA were analyzed, and contrastive analysis was carried out between them. As the results showed, there were 136 transcription factors corresponding to target genes and 622 interactions between transcription factors and target genes in up-regulated miRNA analysis. On the other hand, 81 transcription factors corresponding to target genes and 622 interactions between transcription factors and target genes were involved in down-regulated miRNA (). Contrastive analysis showed that of the total 152 transcription factors, 65 were shared in the two types of target genes, accounted for 42.8% of the total transcription factors. Furthermore, transcription factors corresponding to target genes of up-regulated miRNA showed higher specificity, consistent with the results of GO annotations, in which target genes of up-regulated miRNA enriched in regulating transcription. According to the analysis, main transcription factors with credibility E-value and cross ratio were not greater than 0.05, only transcription factor SIX3 had high cross ratio, indicating that the identification of transcription factors were reliable ().
Figure 7. Transcription factor analysis of target genes of up- and down-regulated miRNAs. (A) Share and specific transcription factor comparison of target genes of up- and down-regulated miRNA. The left background represents number of transcription factors of target genes of up-regulated miRNA. The right background on behalf of number of transcription factors of target genes of down-regulated miRNA. (B) E-value and cross ratio statistics of important regulating transcription factors.
Discussion
In this study, seven independent miRNA expression data sets were selected from the existing researches related to miRNA expression in OS and carried out with bioinformatics analysis. Then up- and down-regulated miRNAs were screened and analyzed. Two miRNA, hsa-miR-19–3p and hsa-miR106b-3p, were identified and might be a predicted signature of osteosarcoma. Target genes of DEMs were certificated, and the functions were analyzed. Finally, transcription factors corresponding to target genes were screened. This study showed a vital significance of miRNA in prevention and treatment of OS.
According to our results, 4 up-regulated and 8 down-regulated miRNAs were screened to be high trustworthy miRNAs. Two miRNAs, hsa-miR-19–3p and hsa-miR106b-3p, were selected as biological markers which might be potential signatures for prevention and treatment of OS. Hsa-miR-19a-3p was the oncogenic component of the mir-17/92 cluster (Olive et al. Citation2009, Ventura et al. Citation2008). When differential expression of microRNAs was detected in plasma of patients with laryngeal squamous cell carcinoma, hsa-miR-19a-3p was confirmed as a potential early-detection marker for laryngeal squamous cell carcinoma (Ayaz et al. Citation2013). Also, hsa-miR-19a-3p was texted in breast cancer grouped by clinicopathological subtypes (Liu et al. Citation2013). Down-regulation of miR-181b promoted apoptosis by targeting CYLD in thyroid papillary cancer, and hsa-miR-19a-3p was detected and played an important role (Li et al. Citation2014). Therefore, hsa-miR-19–3p might play a vital role in OS, and be a potential treatment marker. Hsa-miR106b-3p was only detected as the circulating miRNA in myasthenia gravis. In this study, a total of 698 target genes were highly associated with hsa-miR106b-3p, which indicated that hsa-miR106b-3p might be an important biomarker. However, the exact function in OS need further study.
Significantly enriched processes of up-regulated miRNAs were involved with regulating transcription and RNA metabolism in OS, indicating that target genes of up-regulated miRNAs were primarily transcription factor by strengthening the regulation of transcription factor to enhance regulation of gene expression. As we all know, up-regulation of gene transcription, especially genes related with cell proliferation and carcinogenesis, might lead to cell transform to cancer cell. Regulation of OS oncogenesis process by miRNA was a comprehensive feedback adjustment process. Target genes of down-regulated miRNA played a role in regulating main phosphorus metabolic processes and secretion of tumor necrosis factor the process. Compared to normal cells, choline kinase and phospholipase C were significantly overexpressed, and lysophospholipase 1, phospholipase A2, and phospholipase D were significantly under-expressed, in breast cancer cells (Glunde et al. Citation2004). The overall activity of phosphatidylcholine-specific phospholipase C and phospholipase D was also higher (∼5-fold) in human epithelial ovarian carcinoma cells (EOC), suggesting that both biosynthetic and catabolic pathways of the phosphatidylcholine cycle likely contributed to phosphocholine accumulation. Evidence of abnormal phosphatidylcholine metabolism might have implications in EOC biology and might provide an avenue to the development of noninvasive clinical tools for EOC diagnosis and treatment follow-up (Iorio et al. Citation2005). Collectively, abnormal phosphorus metabolic processes might contribute to the oncogenesis of OS. Researches had shown that cannabinoids induced cancer cell proliferation via tumor necrosis factor alpha-converting enzyme (TACE/ADAM17)-mediated transactivation of the epidermal growth factor receptor (Hart et al. Citation2004). Epidermal growth factor receptor transactivation mediated tumor necrosis factor-induced hepatocyte replication (Argast et al. Citation2004). Therefore, changes of tumor necrosis factor were highly associated with cell proliferation and thus influenced oncogenesis of OS. However, the biological significance of them in OS needed further analysis. Collectively, analyses of target genes further proved that the selected miRNAs were highly associated with the oncogenesis of OS and might be potential biomarker in treatment of OS.
Pathway enrichment analysis showed that target genes of up-regulated miRNA were mainly associated with six main metabolic pathways, namely endocytosis, MAPK signaling pathways, glioma, long-term potentiation, ErbB signaling pathways and cancer signaling pathways, which were consistent with the results of analysis of target genes. However, there was no significantly enriched pathway of target genes of down-regulated miRNA OS.
SIX3 was a human homologue of the highly conserved sine oculis gene family essential during embryonic development in vertebrates, and encoded a homeo-domain containing transcription factor (Mo et al. Citation2013). Researches were reported that the homeotic protein Six3 was a co-activator of the nuclear receptor NOR-1 and a co-repressor of the fusion protein EWS/NOR-1 in human extraskeletal myxoid chondrosarcomas (Laflamme et al. Citation2003). Wnt1 downstream signaling components had been well studied and activated in human cancer. Reports showed that MTA1s and MTA1 as important upstream modifiers of the Wnt1 transcription, and consequently its functions, by directly inhibiting the transcription of Six3, allowed derepression of Wnt1 transcription (Kumar et al. Citation2010). Study showed that SIX3 might play an important role as a novel suppressor in human lung cancer. SIX3 had potential as a novel prognostic biomarker for patients with lung adenocarcinomas (Mo et al. Citation2013). In our study, transcription factor SIX3 had high cross ratio, indicating that the identification of transcription factors were reliable. Collectively, SIX3 might be an important transcription factor in oncogenesis of OS and might be a vital biomarker for prevention and treatment of OS.
Collectively, two miRNAs, hsa-miR-19–3p and hsa-miR106b-3p were screened and might be reliable signatures for prevention and treatment of osteosarcoma. Target genes function annotation analyses showed that the up-regulated miRNA target genes were mainly involved with transcription factors, and down-regulated miRNA were related to phosphorus metabolism regulation and secretion of tumor necrosis factor. Transcription factor SIX3 with high cross ratio was screened and might also be reliable signatures of osteosarcoma. However, all this conclusions were deduced by bioinformatics analysis and need further study to confirm them.
Disclosure statement
All authors declared no conflict of interest.
References
- Argast GM, Campbell JS, Brooling JT, Fausto N. 2004. Epidermal growth factor receptor transactivation mediates tumor necrosis factor-induced hepatocyte replication. J Biol Chem. 279:34530–34536.
- Ayaz L, Görür A, Yaroğlu HY, Ozcan C, Tamer L. 2013. Differential expression of microRNAs in plasma of patients with laryngeal squamous cell carcinoma: potential early-detection markers for laryngeal squamous cell carcinoma. J Cancer Res Clin Oncol. 139:1499–1506.
- Calin GA, Sevignani C, Dumitru CD, Hyslop T, Noch E, Yendamuri S, et al. 2004. Human microRNA genes are frequently located at fragile sites and genomic regions involved in cancers. Proc Natl Acad Sci USA. 101:2999–3004.
- Laflamme C, Filion C, Bridge JA, Ladanyi M, Goldring MB, Labelle Y. 2003. The homeotic protein Six3 is a coactivator of the nuclear receptor NOR-1 and a corepressor of the fusion protein EWS/NOR-1 in human extraskeletal myxoid chondrosarcomas. Cancer Res. 63:449–454.
- Li D, Jian W, Wei C, Song H, Gu Y, Luo Y, Fang L. 2014. Down-regulation of miR-181b promotes apoptosis by targeting CYLD in thyroid papillary cancer. Int J Clin Exp Pathol. 7:7672–7680.
- Dennis G Jr., Sherman BT, Hosack DA, Yang J, Gao W, Lane HC, et al. 2003. DAVID: database for annotation, visualization, and integrated discovery. Genome Biol. 4:P3.
- Doench JG, Sharp PA. 2004. Specificity of microRNA target selection in translational repression. Genes Dev. 18:504–511.
- Duan Z, Choy E, Harmon D, Liu X, Susa M, Mankin H, et al. 2011. MicroRNA-199a-3p is downregulated in human osteosarcoma and regulates cell proliferation and migration. Mol Cancer Ther. 10:1337–1345.
- Essaghir A, Toffalini F, Knoops L, Kallin A, van Helden J, Demoulin JB. 2010. Transcription factor regulation can be accurately predicted from the presence of target gene signatures in microarray gene expression data. Nucleic Acids Res. 38:e120.
- Griffiths-Jones S, Saini HK, van Dongen S, Enright AJ. 2008. miRBase: tools for microRNA genomics. Nucleic Acids Res. 36:D154–D158.
- Hu H, Zhang Y, Cai XH, Huang J-F, Cai L. 2012. Changes in microRNA expression in the MG-63 osteosarcoma cell line compared with osteoblasts. Oncol Lett. 4:1037–1042.
- Iorio E, Mezzanzanica D, Alberti P, Spadaro F, Ramoni C, D'Ascenzo S, et al. 2005. Alterations of choline phospholipid metabolism in ovarian tumor progression. Cancer Res. 65:9369–9376.
- Jones KB, Salah Z, Del Mare S, Galasso M, Gaudio E, Nuovo GJ, et al. 2012. miRNA signatures associate with pathogenesis and progression of osteosarcoma. Cancer Res. 72:1865–1877.
- Kozomara A, Griffiths-Jones S. 2011. miRBase: integrating microRNA annotation and deep-sequencing data. Nucleic Acids Res. 39:D152–D157.
- Glunde K, Jie C, Bhujwalla ZM. 2004. Molecular causes of the aberrant choline phospholipid metabolism in breast cancer. Cancer Res. 64:4270–4276.
- Lewis BP, Burge CB, Bartel DP. 2005. Conserved seed pairing, often flanked by adenosines, indicates that thousands of human genes are microRNA targets. Cell. 120:15–20.
- Liu JF, Xie HJ, Cheng TM. 2013. Lack of any association between insertion/deletion (I/D) polymorphisms in the angiotensin-converting enzyme gene and digestive system cancer risk: a meta-analysis. Asian Pac J Cancer Prev. 14:7271–7275.
- Maire G, Martin JW, Yoshimoto M, Chilton-MacNeill S, Zielenska M, Squire JA. 2011. Analysis of miRNA-gene expression-genomic profiles reveals complex mechanisms of microRNA deregulation in osteosarcoma. Cancer Genet. 204:138–146.
- Mo ML, Okamoto J, Chen Z, Hirata T, Mikami I, Bosco-Clément G, et al. 2013. Down-regulation of SIX3 is associated with clinical outcome in lung adenocarcinoma. PLoS One. 8:e71816.
- Namløs HM, Meza-Zepeda LA, Barøy T, Østensen IH, Kresse SH, Kuijjer ML, et al. 2012. Modulation of the osteosarcoma expression phenotype by microRNAs. PLoS One. 7:e48086.
- Olive V, Bennett MJ, Walker JC, Ma C, Jiang I, Cordon-Cardo C, et al. 2009. miR-19 is a key oncogenic component of mir-17-92. Genes Dev. 23:2839–2849.
- Ottaviani G, Jaffe N. 2009. The epidemiology of osteosarcoma. Cancer Treat Res. 152:3–13.
- Kumar R, Balasenthil S, Manavathi B, Rayala SK, Pakala SB. 2010. Metastasis-associated protein 1 and its short form variant stimulates Wnt1 transcription through promoting its derepression from Six3 corepressor. Cancer Res. 70:6649–6658.
- Hart S, Fischer OM, Ullrich A. 2004. Cannabinoids induce cancer cell proliferation via tumor necrosis factor alpha-converting enzyme (TACE/ADAM17)-mediated transactivation of the epidermal growth factor receptor. Cancer Res. 64:1943–1950.
- Shi XB, Tepper CG, deVere White RW, 2008. Cancerous miRNAs and their regulation. Cell Cycle. 7:1529–1538.
- Skaftnesmo KO, Prestegarden L, Micklem DR, Lorens JB. 2007. MicroRNAs in tumorigenesis. Curr Pharm Biotechnol. 8:320–325.
- Tan ML, Choong PF, Dass CR. 2009. Osteosarcoma: conventional treatment vs. gene therapy. Cancer Biol Ther. 8:106–117.
- Thayanithy V, Sarver AL, Kartha RV, Li L, Angstadt AY, Breen M, et al. 2012. Perturbation of 14q32 miRNAs-cMYC gene network in osteosarcoma. Bone. 50:171–181.
- Ventura A, Young AG, Winslow MM, Lintault L, Meissner A, Erkeland SJ, et al. 2008. Targeted deletion reveals essential and overlapping functions of the miR-17 through 92 family of miRNA clusters. Cell. 132:875–886.
- Zhao H, Li M, Li L, Yang X, Lan G, Zhang Y. 2013. MiR-133b is down-regulated in human osteosarcoma and inhibits osteosarcoma cells proliferation, migration and invasion, and promotes apoptosis. PLoS One. 8:e83571.