
Abstract
In the current study, in vitro biological feature of imatinib-loaded silver nanoparticles (IMAB-AgNPs) on human breast cancer cell line was investigated. The formation of synthesized silver nanoparticles (AgNPs) was characterized by UV–Visible spectroscopy, EDS, TEM imaging, SEM, FTIR, DLS and Zeta potentiometer. The developed IMAB-AgNPs with maximum percentage of loading efficiency was demonstrated in the average of 130 nm and mostly spherical. Additionally, in vitro drug release study showed a slow and continuous release of imatinib over a period of 80 h. We demonstrated that the synthesized IMAB-AgNPs exhibited a dose-dependent cytotoxicity against MCF-7 cell line. Then, real-time PCR method was also applied for the investigation of Bax and Bcl-2 gene expression in the cells. Comparing IMAB-AgNPs to AgNPs and Imatinib revealed the ability of IMAB-AgNPs to up-regulating Bax/Bcl-2 ratio. An induction of apoptosis was evidenced by Annexin–V/PI detection assay. Based on the current obtained data, the IMAB-AgNPs can exhibit inhibitory effect on viability through up regulation of apoptosis in MCF-7 cancer cells, which provides influencing evidence for the green synthesized AgNPs as a promising sustained drug delivery system.
Keywords:
Introduction
Recently, advancement in nanoparticles-mediated drug delivery is a vital significance in medicine and has made the exceptional landscape of pharmaceutical industries for the foreseeable future (Conde et al. Citation2012). Today, targeting cancer with small molecule kinase inhibitors represents a new great promising approach, which is an attractive alternative to the toxic drugs used for chemotherapy of numerous malignant tumors. The large number of these targeted therapies are being investigated for the treatment of cancer (Arora and Scholar Citation2005, Zhang et al. Citation2009). Imatinib mesylate (STI571; Gleevec®; Novartis, Basel, Switzerland) is the first successful member of a new class of kinase inhibitors that acts by inhibiting specific tyrosine kineses like Bcr-Abl fusion oncoprotein in chronic myeloid leukaemia (CML), as well as inhibits the activation of platelet-derived growth factor (PDGF)αβ, colony stimulating factor 1 (CSF1) receptors and c-kit, which regulates major cellular events. It is currently used in research and treatment of several solid tumors (Blay and Rutkowski Citation2014, Sadat Shandiz et al. Citation2016a, Citation2016b, Woo et al. Citation2015). Despite the success in tyrosine kinase inhibitors for the treatment of cancer, the bioavailability of most of the small kinase inhibitors in the physiological environment is extremely poor due to hydrophobic nature (Pawson and Warner Citation2007). In order to bring out a required response in the target cells, high concentration of drug may be desired as initial dose, which, in contrast, increases the risk of side effects. To improve such limitations, design of advanced drug delivery systems is necessary in order to deliver the drug at the target site with the sufficient concentration (Dikpati et al. Citation2012). In this regard, nanotechnology-based therapy for cancer is the most promising field for generating new application in drug delivery with minimal side effects (Hasadsri et al. Citation2009, Rani et al. Citation2012). Various nanovectors and nanoconjugate such as polymeric conjugates, synthetic organic nanoparticles like dendrimers (Karimi et al. Citation2014), lipids such as liposomes and micelle (Dicheva and Koning Citation2014, Gupta et al. Citation2015), carbon nanotubes, inorganic nanoparticles (He et al. Citation2016) are gaining interest as drug delivery platforms (Bhattacharyya et al. Citation2011, Sivasankar and Kumar Citation2010). Nowadays, nanoparticles for controlled local drug delivery are suitable tools to improving serum solubility of the drugs, prolonging the drug release rate, improving the therapeutic index and pharmacokinetics of the drugs in contrast to the free drug counterparts (Mello and Ricci-Júnior Citation2011, Singh et al. Citation2011).
Among different nanoparticles exploited, silver nanoparticles (AgNPs) have been now recognized as developing therapeutic molecule and will surely extend their use as a drug carrier (Nasrabadi et al. Citation2014). AgNPs play a significant role in the field of biology and medicine due to their particular physiochemical properties. In addition, they can be used for both passive and active targeting of drugs and recently revealed as an attractive candidate for delivery of numerous payloads (e.g. small drug molecules or large biomolecules, like proteins, DNA or RNA) into their targets. The AgNPs, through specific sizes and morphologies, can be readily synthesized using chemical and physical methods (Salehi et al. Citation2016). However, because of the AgNPs synthesis employs toxic chemicals like reducing agents, the phyto-synthesis using plant extracts is significantly advantageous due to less biohazard and friendly environment (Kumar et al. Citation2014, Zayed et al. Citation2012). In a recent study, we investigated the green synthesis of AgNPs by using leaves extract obtained from Eucalyptus procera as a reducing and capping agent. The main aim of the current study is development and characterization of high drug loading, IMAB-AgNPs for effective bioavailability and to decrease dose frequency, which is significant in anti-tumor drug delivery to breast cancer cells. The evaluation of physicochemical characteristics such as morphology, particle size, zeta potential, drug loading efficiency, as well as in vitro release study and stability were investigated. The cytotoxicity of nanoparticles on MCF-7 cells and the mechanism were evaluated by MTT assay, the real time PCR and Annexin–V/PI detection assay, respectively.
Materials and methods
Green synthesis of silver nanoparticles
The leaves of E. procera were cultivated from Kashan, Isfahan province, Iran. A voucher specimen of the plant was deposited at the Herbarium of Kashan botanical garden (with voucher specimen number of KBG1342 and recognized by Friedrich Dehnhardt, German Botanist). Fresh E. procera leaves for the extraction of active components were shade dried at room temperature and powdered. Briefly, 50 g of leaves powder was weighed and mixed in 500 mL of boiling deionized water for 2 h. The mixture was filtered through No. 1 Whatman filter paper at room temperature. The solution was then stored in a refrigerator for further nanoparticles synthesis process characterization. For the synthesis of silver nanoparticlea, 6 mL of extract was used as a reducing and capping agent in 100 mL of 0.01 mM AgNO3 (Merck, Darmstadt, Germany) aqueous solution. The reaction flask was subjected to constant mixing in a rotary shaker at 250 rpm. Addition of E. procera extracts to this reaction mixture was kept undisturbed until the colorless solution converted into dirty brown color, which revealed the formation of silver nanoparticles. After the reaction, residual AgNPs solution was centrifuged at 13,000 rpm for a period of 20 min and the resulting suspension were washed three times with distilled water.
Characterization of AgNPs
During the experiment, optical absorption spectra of samples were analyzed using an Epoch UV-Vis spectrophotometer (BioTek, Bad Friedrichshall, Germany) within a range from 300 to 700 nm at room temperature. Furthermore, the presence of elemental silver signal was confirmed through energy-dispersed spectroscopy (EDS) analysis system, which automatically identifies the elements responsible for the peaks in the energy distribution. The particle size and surface morphology of products were measured and characterized by means of scanning electron microscopy (SEM) (Philips, Amsterdam, Netherlands, XL30) and Transmission electron microscopy (TEM). The size distribution profile and charge quantification of synthesized nanoparticles were evaluated by dynamic light scattering particle size analyzer (DLS) and zeta potential analyzer (PSA, Malvern Zetasizer Nano-ZS, Worchestershire, UK), respectively. Fourier transforms infrared (FT-IR) spectrum of Ag nanoparticles was performed by Nicolet 5700 instrument (Nicolet Instrument, Thermo Company, Waltham, MA) with KBr pellet method. The spectrum obtained from the dried sample was carried out in the diffuse reflectance mode at a resolution of 4 cm−1 with the wavelength ranging between 400 and 4000 cm−1.
Formulation of IMAB-AgNPs and loading efficiency
In this approach, different concentrations of imatinib were loaded on to AgNPs. Briefly, 10, 20, 30 and 40 mg of the drug were precisely weighted and added to 20 mL of AgNPs dispersion. The mixture of imatinib and AgNPs solution was stirred at room temperature for a period of 72 h. Then, imatinib-loaded AgNPs (IMAB-AgNPs) was separated by centrifugation at 10,000 rpm for 60 min at 25 °C to separate the free drug in the supernatant. IMAB-AgNPs was washed twice with double distilled water to remove physically adsorbed Imatinib molecules. Drug loading was determined using UV-Vis spectrophotometry by co-measuring the absorbance at 281 nm of a standard imatinib solution and supernatant. Surface adsorption of imatinib on the silver nanoparticles was determined by evaluating the amount of free drug present in the supernatant. Imatinib loading efficiency of nanoparticles was calculated using the relationship in EquationEquation (1)(1) :
(1)
Cumulative drug release
The in vitro cumulative drug release study of maximum IMAB-AgNPs formulation was studied. Briefly, 3 mg of IMAB-AgNPs was dispersed in 4 mL of releasing medium (phosphate buffer pH 7.4) at 37 °C temperature. At predetermined time intervals, resulting solution was centrifuged at 13,000 rpm for 20 min and the released amount of imatinib was determined by absorption at 281 nm obtained from a UV–Visible spectrophotometer. The drug release study was followed with this procedure in a period of 80 h (Dash et al. Citation2010). The cumulative imatinib release was determined according to the EquationEquation (2)(2) :
(2)
Cell lines and culture conditions
Human breast cancer MCF-7 cell line was procured from National Cell Bank of Iran (NCBI), Pasteur Institute of Iran. The cells were grown in RPMI 1640 medium supplemented with 10% heat-inactivated Fetal Bovine Serum, 1.0 mM sodium pyruvate, 2 mM l-glutamine and 1X Pen-Strep (All from Gibco, Paisley, Scotland) at 37 °C in humidified atmosphere containing 5% CO2 and 95% air.
Cell viability assay
The cell viability was determined by 3-(4,5-dimethylthiazol-2yl)-2,5-diphenyltetrazolium bromide (MTT) assay (Rani et al. Citation2012). Briefly, the cells were seeded into 96-well plates with 1 × 10⁴ cells in each well and allowed the cells to attach during 24 h. Then, various concentrations (0, 1.25, 2.5, 5, 10, 20, and 30 μM) of IMAB, AgNPs, and IMAB-AgNPs were added to the wells at least six replicates, and plates were left intact for 24 h. Afterwards, 100 μL of the MTT solution was added to each well, and the plates were incubated for 4 h. The purple formazan crystals were dissolved by an addition of 100 μL dimethyl sulfoxide (DMSO) (Merck, Germany) for 30 min. Finally, the absorbance of the resultant solution was calculated by a microplate reader (Bio-Rad, Hercules, CA) at a wavelength of 570 nm. Cell viability was calculated as follows:
Real-time-PCR
A SYBR Green real-time quantitative PCR was employed to quantify the expression levels of Bax and Bcl-2 mRNAs in MCF-7 cells. The cancer cells were seeded into 6-well plates (5 × 10⁴ cells/well) and incubated for 24 h, and then, the cells were treated with IMAB and IMAB-AgNPs for additional 24 h incubation. Total cellular RNA was extracted from the cells using the RNA-isolation kit (Qiagen, RNeasy Plus Mini Kit 50, Valencia, CA) according to the manufacturer’s instructions. High quality of RNA was isolated for cDNA synthesis by using PrimeScriptTM 1st strand cDNA Synthesis Kit (Takara, Tokyo, Japan) according to the manufactures’ protocol. The primers used for real time PCR were: forward 5′ TTGCTTCAGGGTTTCATCCAG 3′ and reverse 5′AGCTTCTTGGTGGACGCATC3′ for Bax cDNA, forward 5′ TGTGGATGACTGAGTACCTGAACC 3′, and reverse 5′ CAGCCAGGAGAAATCAAACAGAG 3′ for Bcl-2 cDNA. The sequence of the forward primer for housekeeping gene GAPDH was 5′ CGTCTGCCCTATCAACTTTCG 3′ and that of reverse primer was 5′ CGTTTCTCAGGCTCCCTCT 3′. The expression of target gene was performed by using an ABI 7300 real-time PCR system (Applied Biosystems, Foster City, CA). Each PCR amplification reaction was performed in 20 μL reaction mixture containing 10 μL Power SYBR Green PCR Master Mix (2×), 1 μL of each primer (0.4 μM), 2 μL cDNA (100 ng), and 6 μL double-distilled water. After denaturation at 95 °C for 10 min, 40 cycles were followed by 95 °C for 15 s and 60 °C for 1 min in PCR cycling condition. Amplification stage was followed by a melting step; at 95 °C for 20 s, 60 °C for 60 s and 95 °C for 20 s. The gene expression was determined using comparative threshold cycle (Ct). Afterwards, mean threshold cycle (mCt) value of reference gene (GAPDH) was subtracted from mCt value of the target genes (Bax, Bcl2) to obtain ΔCt and ΔΔCt values of each sample were calculated from corresponding Ct values. Finally, target/internal control gene expression ratio was calculated using the ratio formula (Ratio= 2-ΔΔCt).
Flow cytometric analysis of apoptosis
To investigate the apoptosis of the cells, a fluorescein isothiocyanate (FITC)-annexin V and propidium iodide (PI) apoptosis detection kit (Hoffman-La Roch Ltd, Basel, Switzerland) was applied according to the manufacture‘s instruction. The MCF7 cells (1 × 10⁵ cells/well) were incubated with IMAB, IMAB-AgNPs, and AgNPs at the required dose in a 24-well microplate, with an un-treated MCF-7 cells as a positive control.
Statistical analysis
The one-way analysis of variance (ANOVA) followed by a t-test was used for data analysis. All results were expressed as mean ± SEM and p values less than 0.05 were considered to be statistically significant.
Results
Characterization of AgNPs under green synthesis
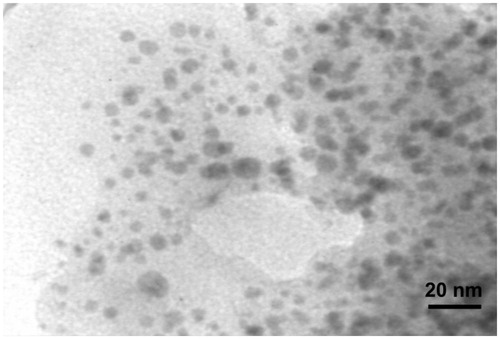
It was observed that based on addition of the plant extract into the Erlenmeyer flask including the AgNO3 aqueous solution, the color of medium changed from colorless to dirty brown within 60 min. The color change is a significant criterion for reduction of silver nitrate to silver nanoparticles. The appearance of reddish color occurred at the end of 30 min during reaction time is the first indication that the nanoparticle formation has been initiated. Further progress in reaction time (1 h) resulted in change in surface plasmon resonance (SRP) from reddish to dirty brown, which could be due to the growth of nano-scale formation of metal particle (Ahluwalia et al. Citation2014). The UV-Visible spectrophotometer proved to be very useful technique for the analysis of some metal nanoparticles. Reduction of AgNPs was further observed based on the surface plasmon resonance peak at 438 nm by using UV-visible spectroscopy (). In addition, the presence of elemental silver signal as the major constituent was confirmed in the sample by energy dispersive spectroscopy (EDS) analysis. The spectrum analysis shows peak in the silver region, which directly confirmed formation of AgNPs in . Generally, the optical absorption peak of metallic silver nanoparticles situated at approximately 3 keV due to the surface plasmon resonance (Bar et al. Citation2009, Magudapathy et al. Citation2001). The appearance of other signals in the micrograph such as carbon, oxygen, and sulfur indicate the presence of organic plant leaves extract, which corresponds to the biomolecules that were capping over the synthesized AgNPs. The table in indicates elemental analysis of the AgNPs that the highest proportion of silver (70.16%) followed by remaining elements. TEM images was performed to characterized the size and morphology of the nanoparticles (); this result showed that the AgNPs are spherical in shape, the particles has an average size of 20 nm.
Figure 1. UV-visible absorption spectrum of prepared AgNPs after 60 min.
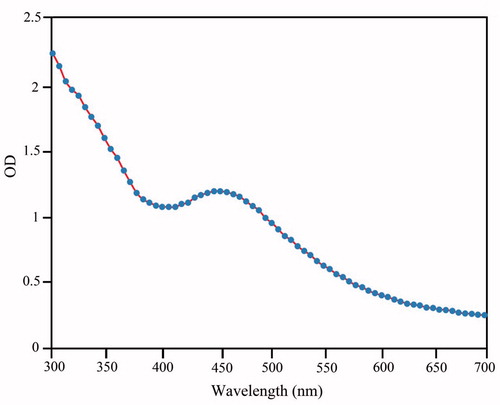
Figure 2. Energy dispersive spectroscopy (EDS) analysis of green synthesized AgNPs.
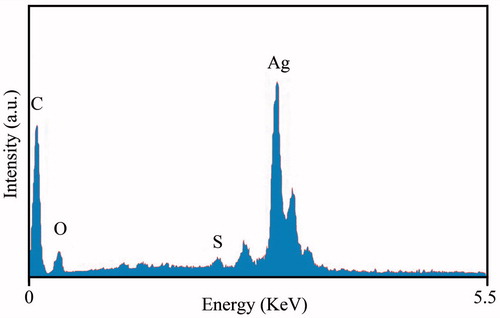
Figure 3. TEM image of green synthesized AgNPs.
Characterization of IMAB-AgNPs
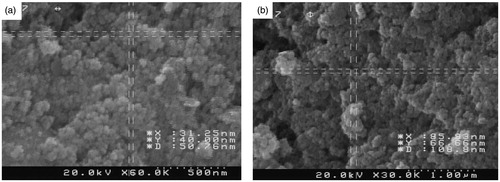
The morphological studies on size and shape of AgNPs and IMAB-AgNPs were studied by performing scanning electron microscopy images (). The SEM image of AgNPs () before loading with imatinib confirmed that spherical particles in the range of about ∼60 nm. shows the size of imatinib-loaded AgNPs sample in the range of 105-210 nm that was suitable in comparison to that of AgNPs sample.
Figure 4. SEM images of (a) AgNPs; (b) IMAB-AgNPs.
Zeta sizer device was performed to assess the size and charge of the AgNP and IMAB-AgNP samples (the results are showed in and ). The size distribution profile of green synthesized AgNPs was shown in . As one can see, the result of DLS analysis revealed that the prepared AgNPs have about 63 nm average sizes. To explore the enhanced storage stability of metallic nanoparticles, their zeta potential measurement was evaluated. Zeta potential revealed information regarding the stability and surface charge associated with the particles. The zeta potential value for silver nanoparticles sample obtained from plant leaves extract is around −28.5 mV. The surface charge of the synthesized nanoparticles is depicted in .
Figure 5. Illustration of DLS (a) and zeta potential (b) analysis of green synthesized silver nanoparticles.
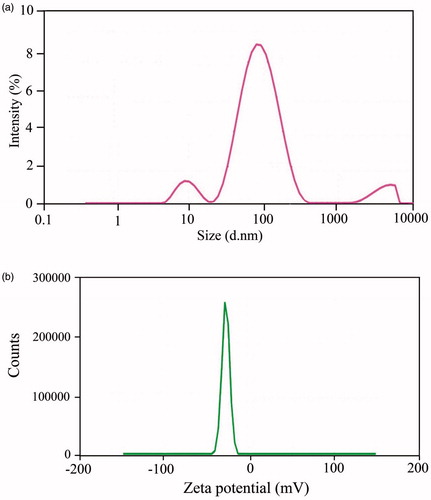
Figure 6. Illustration of DLS (a) and zeta potential (b) analysis of imatinib-loaded silver nanoparticles.
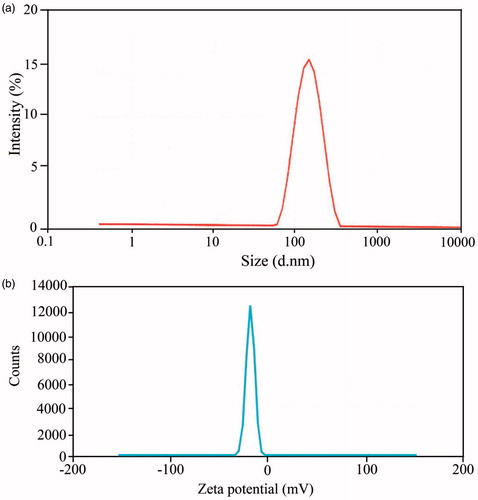
Furthermore, DLS analysis has also been performed to determine the diameters of the imatinib-loaded silver nanoparticle sample (). The mean particle size of the IMAB-AgNPs was about 148 nm, which are in agreement with predicted result by SEM. shows the charge of the IMAB-AgNP sample is about −17.4 mV that was suitable in comparison to that of silver nanoparticles sample. The negative zeta potential values of IMAB-AgNP sample will tend to repel each other and there is no tendency to flocculate. These values provide that the physical stability of this formulation was good. As molecular structure of imatinib denotes seven nitrogen atoms are positively charged and the benzene rings take part in the loading reaction. The change in the charge of IMAB-AgNPs sample could be ascribed to nitrogen atoms that would render the molecule positive charge rather than the silver nanoparticle sample.
For comparison, FTIR spectroscopy analysis of IMAB-AgNPs, IMAB, Extract, and AgNPs were carried out between 400 and 4000 cm−1 and the spectra are shown in . FTIR spectroscopy analysis was used to characterize and confirm the biomolecules that were bound specifically on the synthesized AgNPs. demonstrated the FTIR spectroscopic of AgNPs and extract, respectively.
Figure 7. FTIR spectrum of (a) IMAB-AgNPs; (b) IMAB; (c) extract; (d) AgNPs.
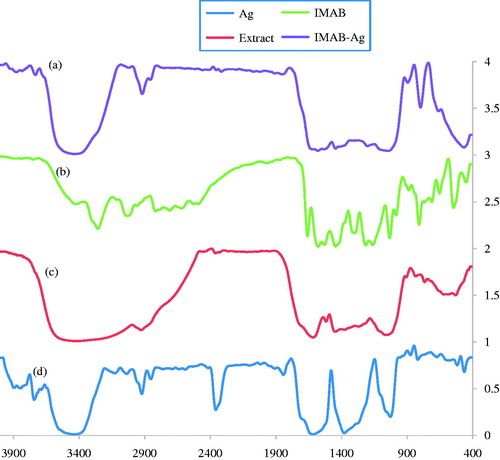
The intense vibration bands observed at 1041, 1378, 1620, 2364, 2931, and 3481 cm−1 in the FTIR spectrum is clearly represented in refer to the silver nanoparticles that were formed in the presence of the plant extract. The peaks at 1041 cm−1 can be attributed to the ether linkage. Intense bands at 1378 cm−1 were assigned to C-N stretching vibrations of aromatic amines. The intense bands at 1620 cm−1 (C = O stretching) in silver nanoparticles, which are absent for the IMAB-AgNPs FTIR spectrums, shifted to 1583 and 1407 cm−1 in IMAB-AgNPs attribute to Amide Ι and Amide ΙΙ regions, respectively. Whereas, the peaks observed at 1024 cm−1 in IMAB-AgNPs FTIR spectrum have been assigned to functional group in phenolic compounds (Zayed et al. Citation2012). An absorption peaks located at 2364 and 2931 cm−1 were corresponded to alkane C-H stretching vibration mode. Similarly, the FTIR absorption peak at 3481 cm−1 is assigned to the stretching vibration of O-H functional group that shifted to 3406 and 3446 cm−1 in IMAB-AgNPs FTIR spectrum (Tripathi et al. Citation2009). The major peaks in the FTIR spectrum of leaf extract () were observed at 1073, 1608, 2962, and 3451 cm− 1. The strong band at 3451 cm−1 in plant extract was related to O-H stretching of alcohols and phenols and this band was shifted to 3481 cm−1 in AgNPs. The more intense peak was observed at 1624 cm−1 signifying the presence of carbonyl (C-O) stretching vibrations (Loo et al. Citation2012). The major peaks in the FTIR spectrum of imatinib are shown in . The peaks observed at 400–900, 1447, 1657, 3038, and 3258 cm−1 are related to aromatic moiety in imatinib, C = C, C = O, C-H, and N-H stretching frequencies, respectively ().
On comparing the FTIR spectrum of imatinib with the spectrum of IMAB-AgNPs sample, it is observed that shifting of N-H stretching frequency from 1574 to 1583 cm−1, disappearance of C = O stretching frequency, and aromatic moiety confirming the loading of imatinib with silver nanoparticles. Additionally, the IMAB-AgNP-loaded FTIR spectrum shows that similar peak at 3038 cm−1 is due to the presence of imatinib in the formulation.
Drug-loading efficiency
The principle of drug loading on silver nanoparticles is surface adsorption. When 10 mg was added to silver nanoparticles, the percentage drug loading was 83.45%. When 20 mg of the drug was added to AgNPs, the percentage drug loading was 95.30% after 72 h. Increasing the quantity of imatinib into the AgNPs solution leads to a decrease in percentage of drug loading. This indicates the saturation of the entire surface from drug.
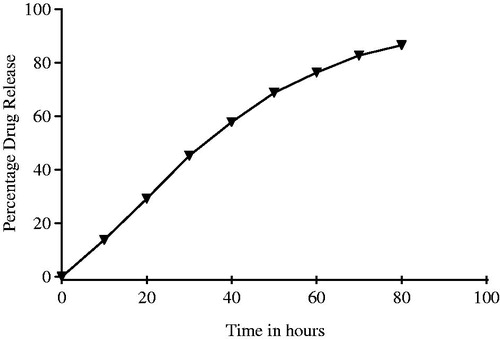
In vitro drug release studies
The in vitro imatinib release profiles of IMAB-AgNPs were carried out in phosphate buffer pH 7.4. The percentage cumulative drug release is shown in . The amount of IMAB released was demonstrated as cumulative percentage drug release after 80 h. The release of IMAB from the AgNPs could be divided into two stages. The first phase (1–40 h), where there is a burst release of IMAB and the second phase (40–80 h), where the IMAB is released gradually in a constant profile in the first 40 h. The release study was calculated in triplet to obtain the mean release value and the standard deviation. About 29.22 ± 3.01% of the IMAB released in the first 20 h and approximately 57.89 ± 1.48% of IMAB released in the initial 40 h, which was then followed by a constant release for the subsequent 50 h. Nearly 86.56 ± 2.04% of the IMAB released in the first 80 h, these data demonstrated that the silver nanoparticles for the sustainable release of IMAB and the two phase release is the significant benefit. In drug delivery, the initial stage could be important for treatment of disease for drug released rapidly and the slow-release phase could consolidate curative effect. Drug will play a greater role in treatment through two release stages (He et al. Citation2004).
Figure 8. In vitro release study for IMAB-AgNPs.
MTT results
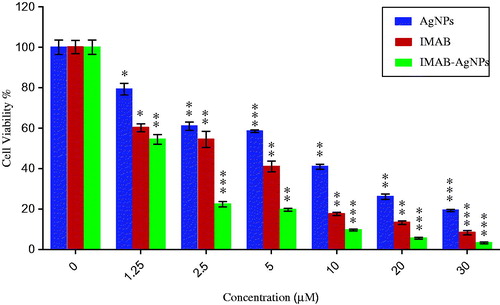
The results of MTT assay for AgNPs, IMAB, and IMAB-AgNPs in different concentrations are shown in . MTT assay was used to assess the effect of AgNPs on viability and proliferation of breast MCF-7 cells. We have demonstrated the cytotoxic effect of AgNPs, IMAB-AgNP, and IMAB on MCF-7 breast cell line. In the present study, the inhibition ability to MCF-7 cells was dose dependent for various concentrations (0, 1.25, 2.5, 5, 10, 20, and 30 μM) of AgNPs, IMAB, and IMAB-AgNPs. The relevant IC50 values of AgNPs, IMAB, IMAB-AgNPs have been measured by MTT assay and found to be 9.63 μM, 3.02 μM, and 1.69 μM for MCF-7 cells, respectively. As it is obvious, increasing the concentration of the AgNPs and IMAB leads to decreasing cell viability. After incubating the cells with IMAB-AgNPs, the viability of MCF-7 cells decreased and a higher cell cytotoxicity rate was seen with grater imatinib-loaded silver nanoparticles. The viability studies also show that IMAB-AgNPs significantly decreased the cell viability at different concentrations, which is comparable to cytotoxicity rate of AgNPs and IMAB only. The suspected reason for the susceptibility of MCF-7 to IMAB-AgNPs may depend on the size, charge, and shape of nanoparticles. Cytotoxicity effects of nanoparticles on target cells have been attributed to various mechanisms like particle-induced apoptosis (He et al. Citation2004, Odintsova et al. Citation2013, Sadat Shandiz et al. Citation2015, Yang et al. Citation2009).
Figure 9. In vitro xytotoxycity of AgNPs, IMAB, IMAB-AgNPs against breast cancer MCF-7 cells after incubation of 24 h. The data were reported as the mean ± standard error of the mean (SEM) from three independent experiments. Results were statistically analyzed with a Student′s t-test (*p < 0.05; **p < 0.01;***p < 0.001).
Analysis of apoptosis-related gene expression
To verify the expression of apoptotic and anti-apoptotic genes at mRNA level in AgNPs exposed in MCF-7 cell line using quantitative real time PCR (). Our findings exhibit that mRNA level of Bax were significantly up-regulated (4.3-fold) while the expression of anti-apoptotic Bcl-2 was significantly diminished (0.3-fold) in cells treated with IMAB-AgNPs compared to untreated control. These effects could be attributed to an increased sensitivity of MCF7 cell line to induced apoptosis when exposed to IMAB-AgNPs. Therefore, the Bax/Bcl-2 ratio increased. Apoptosis is regulated by pro-apoptotic and anti-apoptotic effectors that involve a different pathway. The product of the Bcl-2 family gene and other anti-apoptotic members such as Mcl-1, BCL-w, Bcl-2, A1, and, Bcl-xl serves as important regulators of apoptosis pathways (Sadat Shandiz et al. Citation2015). Bcl-2 protein inhibits the release of cytochrome c from mitochondria shown by Bax proteins, resulting in suppression of apoptosis cascade (He et al. Citation2004).
Figure 10. Impact of AgNPs, IMAB, and IMAB-AgNPs to expression of Bax and Bcl-2 mRNA levels in MCF-7 cells.
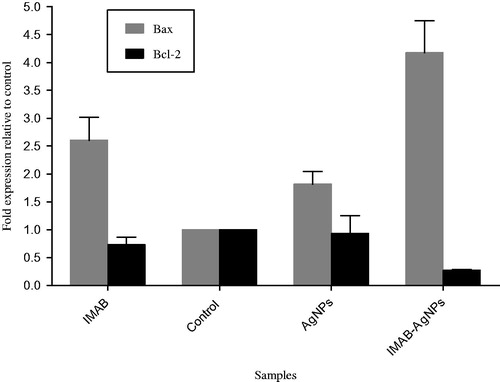
To evaluate if IMAB-AgNPs treatment results in apoptosis induction, our data demonstrated that it could induce an intrinsic signaling pathway for programmed cell death mediated by down-regulation of Bcl-2 and up-regulation of Bax gene expression on human breast cancer MCF-7 cells that not have been reported so far.
Flow cytometry analysis of MCF-7 breast cancer cells
Further experiments made in this work with Annexin V with PI staining and identification of apoptosis revealed that IMAB-AgNPs curbed the growth of MCF-7 cells by raising the number of apoptotic and necrotic cells. During the early stage of apoptosis, phosphatidyl serins in cell membrane translocated from inner leaflet of membrane to the outer surface of cell membrane. Phosphatidyl serins can be stained with an Annexin–V/PI assay, while, PI could be used for detecting nucleus of the cells, which have failed in their integrity within necrosis (Odintsova et al. Citation2013, Riedy et al. Citation1991).
The apoptotic cells stained by annexin V and unstained by propidium iodide in the lower right quadrant (LR), late apoptotic (Annexin V+/PI+) populations were presented in the upper right quadrant (UR) and necrotic cell (Annexin V-/PI+) populations were located in the upper left quadrant (UL) as depicted in .
Figure 11. Flow cytometric analysis by annexin V-FLUOS (FL1) in x-axis and PI (FL3) in y-axis double staining of MCF-7 cells treated with AgNPs, IMAB and IMAB-AgNPs at 24 h. Dot plots of annexin V/PI staining are shown in (a) untreated MCF-7 cells; (b) MCF-7 cells treated with AgNPs; (c) MCF-7 cells treated with IMAB; (d) MCF-7 cells treated with IMAB-AgNPs.
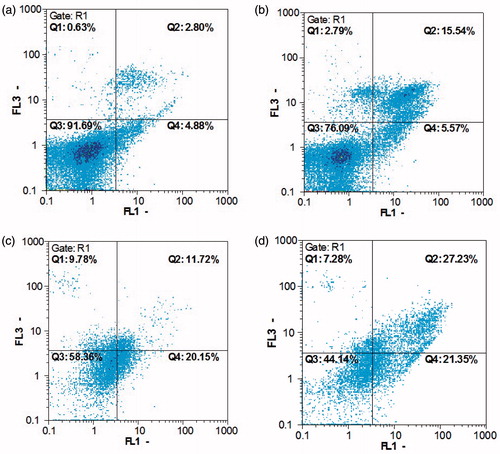
Dot plots of annexin V/PI staining are shown in untreated MCF-7 cells. MCF-7 cells treated with 9.63 μM AgNPs exhibited 15.54% early stage apoptosis and 5.57% late stage apoptosis (). MCF-7 cells treated with 3.02 μM IMAB had 11.72% early-stage apoptosis and 20.15% late-stage apoptosis (). MCF-7 cells treated with 1.69 μM IMAB-AgNPs showed 27.23% early-stage apoptosis, 21.35% late-stage apoptosis ().
According to annexin V/PI staining results, many annexin V+/PI+ cells were detected in the cells treated with IMAB-AgNPs, showing the late-stage of apoptosis. While, in the cells treated with imatinib, some annexin V+/PI+ cells were also monitored, showing some cells in the early stage of apoptosis.
Conclusion
Based on the current obtained data, it is observed that there is a possibility of obtaining a simple, eco-friendly, and novel imatinib-loaded AgNPs with maximum percentage of loading efficiency. The formation of silver nanoparticles by plant extract as a reducing and capping agent monitored by color change in medium and UV-vis spectroscopy peak at 438 nm. The characterization of imatinib loading on AgNPs was confirmed by various techniques such as SEM, DLS, Zeta potential, and FT-IR spectroscopy. In vitro release study exhibited that imatinib showed a sustained and low release. The viability studies show that IMAB-AgNPs significantly diminished the cell viability at different concentrations, which is comparable to cytotoxicity effect of AgNPs and IMAB only. The real-time PCR result revealed the up-regulation of Bax gene expression with inhibition of Bcl-2 activity. Moreover, our results demonstrated that cytotoxicity of IMAB-AgNPs toward MCF-7 cell line was induced by apoptosis rather than necrosis. From our study, the green synthesized silver nanoparticles are promising sustained release system to the imatinib and will potentially suitable for controlled drug delivery.
Acknowledgements
Authors are also thankful to Dr Mehdi Shafiee Ardestani for his support and contribution in the experimental works.
Disclosure statement
All the authors declare no conflicts of interest.
References
- Ahluwalia V, Kumar J, Sisodia R, Shakil NA, Walia S. 2014. Green synthesis of silver nanoparticles by Trichoderma harzianum andtheir bio-efficacy evaluation against Staphylococcus aureus and Klebsiella pneumonia Vivek. Ind Crop Prod. 55:202–206.
- Arora A, Scholar EM. 2005. Role of tyrosine kinase inhibitors in cancer therapy. J Pharmacol Exp Ther. 315:971–979.
- Bar H, Bhui DK, Sahoo GP, Sarkar P, De SP, Misra A. 2009. Green synthesis of silver nanoparticles using latex of Jatropha curcas. Colloids Surf a Physicochem Eng Aspects. 339:134–139.
- Bhattacharyya S, Kudgus RA, Bhattacharya R, Mukherjee P. 2011. Inorganic nanoparticles in cancer therapy. Pharm Res. 28:237–259.
- Blay JY, Rutkowski P. 2014. Adherence to imatinib therapy in patients with gastrointestinal stromal tumors. Cancer Treat Rev. 40:242–247.
- Conde J, Doria G, Baptista P. 2012. Noble metal nanoparticles applications in cancer. J Drug Deliv. 2012:751075. doi: 10.1155/2012/751075.
- Dash S, Murthy PN, Nath L, Chowdhury P. 2010. Kinetic modeling on drug release from controlled drug delivery systems. Acta Pol Pharm Drug Res. 67:217–223.
- Dicheva BM, Koning GA. 2014. Targeted thermosensitive liposomes: an attractive novel approach for increased drug delivery to solid tumors. Expert Opin Drug Deliv. 11:83–100.
- Dikpati A, Madgulkar A, Kshirsagar SJ, Bhalekar M, Chahal AS. 2012. Targeted drug delivery to CNS using nanoparticles. JAPS J. 2:179–191.
- Gupta B, Poudel BK, Tran TH, Pradhan R, Cho HJ, Jeong JH, et al. 2015. Modulation of pharmacokinetic and cytotoxicity profile of imatinib base by employing optimized nanostructured lipid carriers. Pharm Res. 32:2912–2927.
- Hasadsri L, Kreuter J, Hattori H, Iwasaki T, George JM. 2009. Functional protein delivery into neurons using polymeric nanoparticles. J Biol Chem. 284:6972–6981.
- He J, Xu H, Yang Y, Zhang X, Li X-M. 2004. Neuroprotective effects of olanzapine on methamphetamine-induced neurotoxicity are associated with an inhibition of hyperthermia and prevention of Bcl-2 decrease in rats. Brain Res. 1018:186–192.
- He Y, Du Z, Ma SH, Yue L, Li D, Huang H, Jiang S, et al. 2016. Effects of green-synthesized silver nanoparticles on lung cancer cells in vitro and grown as xenograft tumors in vivo. Int J Nanomed. 11:1879–1887.
- Karimi N, Aghasadeghi MR, Yaghmaei P, Moghaddam HF, Nassiri-Koopaei N, Moloudian H, et al. 2014. Anionic linear globular dendrimer-G2-ciprofloxacin nano-conjugate: novel agent against Wilson disease cell model. Lett Drug Des Discov. 11:908–916.
- Kumar DA, Palanichamy V, Roopan SM. 2014. Green synthesis of silver nanoparticles using Alternanthera dentata leaf extract at room temperature and their antimicrobial activity. Spectrochim Acta A Mol Biomol Spectrosc. 127:168–171.
- Loo YY, Chieng BW, Nishibuchi M, Radu S. 2012. Synthesis of silver nanoparticles by using tea leaf extract from Camellia sinensis. Int J Nanomedicine. 7:4263–4267.
- Magudapathy P, Gangopadhyay P, Panigrahi BK, Nair KGM, Dhara S. 2001. Electrical transport studies of Ag nanoclusters embedded in glass matrix. Physica B. 299:142–146.
- Mello VAD, Ricci-Júnior E. 2011. Encapsulation of naproxen in nanostructured system: structural characterization and in vitro release studies. Quim Nova. 34:933–939.
- Nasrabadi MR, Pourmortazavi SM, Sadat Shandiz SA, Ahmadi F, Batooli H. 2014. Green synthesis of silver nanoparticles using Eucalyptus leucoxylon leaves extract and evaluating the antioxidant activities of extract. Nat Pro Res. 28:1964–1969.
- Odintsova E, Van Niel G, Conjeaud H, Raposo G, Iwamoto R, Mekada E. 2013. Metastasis suppressor tetraspanin CD82/KAI1 regulates ubiquitylation of epidermal growth factor receptor. J Biol Chem. 288:26323–26334.
- Pawson T, Warner N. 2007. Oncogenic re-wiring of cellular signaling pathways. Oncogene. 26:1268–1275.
- Rani D, Somasundaram VH, Nair S, Koyakutty M. 2012. Advances in cancer nanomedicine. J Indian Inst Sci. 92:187–218.
- Riedy MC, Muiread KA, Jensen CP, Stewart CC. 1991. Use of a photolabeling technique to identify nonviable cells in fixed homologous or heterologous cell populations. Cytometry. 12:133–139.
- Sadat Shandiz SA, Farasati S, Saeedi B, Baghbani-Aarani F, Akbari Asl E, Keshavarz-Pakseresht B, et al. 2016a. Up regulation of KAI1 gene expression and apoptosis effect of imatinib mesylate in gastric adenocarcinoma (AGS) cell line. Asian Pac J Trop Dis. 6:120–125.
- Sadat Shandiz SA, Khosravani M, Mohammadi S, Noorbazargan H, Mirzaie A, et al. 2016b. Evaluation of imatinib mesylate (Gleevec) on KAI1/CD82 gene expression in breast cancer MCF-7 cells using quantitative real-time PCR. Asian Pac J Trop Biomed. 6:159–163.
- Sadat Shandiz SA, Shafiee Ardestani M, Irani SH, Shahbazzadeh D. 2015. Imatinib induces down regulation of Bcl-2 an anti-apoptotic protein in prostate cancer PC-3 cell line. Adv Stud Biol. 7:17–27.
- Salehi S, Shandiz SAS, Ghanbar F, Darvish MR, Shafiee Ardestani M, Mirzaie A, Jafari M. 2016. Phyto-synthesis of silver nanoparticles using Artemisia marschalliana Sprengel aerial parts extract and assessment of their antioxidant, anticancer, and antibacterial properties. Int J Nanomed. 11:1835–1846.
- Singh S, Pandey VK, Tewari RP, Agarwal V. 2011. Nanoparticle based drug delivery system: advantages and applications. Indian J Sci Technol. 4:177–180.
- Sivasankar M, Kumar BP. 2010. Role of nanoparticles in drug delivery system. Int J Res Pharm Biomed Sci. 1:41–66.
- Tripathi A, Chandrasekaran N, Raichur AM, Mukherjee A. 2009. Antibacterial applications of silver nanoparticles synthesized by aqueous extract of Azadirachta indica (Neem) leaves. J Biomed Nanotechnol. 5:93–98.
- Woo SM, Choi YK, Kim AJ, Cho SG, Ko SG. 2015. P53 causes butein-mediated apoptosis of chronic myeloid leukemia cells. Mol Med Rep. 13:1091–1096.
- Yang J, Wang H, Wang Z, Tan X, Song C, Zhang R, Li J. 2009. Interaction between antitumor drug and silver nanoparticles: combined fluorescence and surface enhanced Raman scattering study. Chinese Optics Lett. 7:894–897.
- Zayed MF, Eisa WH, Shabaka AA. 2012. Malva parviflora extract assisted green synthesis of silver nanoparticles. Spectrochim Acta A Mol Biomol Spectrosc. 98:423–428.
- Zhang J, Yang PL, Gray NS. 2009. Targeting cancer with small molecule kinase inhibitors. Nat Rev Cancer. 9:28–39.