
Abstract
The present work deals with the design and process optimization for preparation of lactoferrin nanoparticles as carrier for delivery of curcumin (CLf-NPs) using quality by design (QbD) approach. Desolvation technique was selected for preparation of Lf-NPs. The concept of QbD was followed in stepwise manner including risk analysis FMEA methodology. Plackett–Burman screening design employing eight factors and two levels was selected for screening study and custom design was selected for further analysis. Curcumin was used as model polyphenol for assessing the encapsulating efficiency of Lf-NPs.
Introduction
Protein nanoparticles (NPs) have generated huge amount of interest among researchers for its use in drug delivery (Ding et al. Citation2011, Elzoghby et al. Citation2011, Leo et al. Citation1997). The ideal properties of protein NPs include biodegradability, lack of toxicity, non-antigenicity, and presence of various functional groups in protein structure provides a unique drug delivery platform which can be exploited for modulating the interaction of therapeutic agents for control drug delivery as well as binding of therapeutic moiety with protein (Elzoghby et al. Citation2012a, Citation2012b, Zen et al. Citation2013). Milk proteins are natural vehicles for therapeutic molecules. Milk protein such as casein and whey proteins have been reported previously, as carrier for drug delivery in form of micelles, NPs, beads, composites, hydrogels, microparticles, and microspheres (Bulgarelli et al. Citation1999, Chen et al. Citation1987, Gubbins et al. Citation2003, Gunasekaran et al. Citation2007, Knepp et al. Citation1993, Millar and Corrigan Citation1993, Song et al. Citation2009, Zimet et al. Citation2013). Use of milk as drug delivery vehicle has been recently reported by researchers (Kytariolos et al. Citation2013). About 80% of the total protein present in milk is caseins which exist in milk as supramolecular structures called casein micelles, having diameter in range of 50–500 nm, with an average of 120 nm (Mohan et al. Citation2013). Whey proteins such as β-lactoglobulin have been reported to exhibit nonspecific affinity to bind hydrophobic molecules such as vitamins, polyphenols, and palmitic acid (Forrest et al. Citation2005, Hemar et al. Citation2011, Puyol et al. Citation1991). These proteins can be widely explored as drug delivery carrier because it is easily available, inexpensive, natural, and belongs to the category of GRAS (generally recognized as safe) raw materials with nutritional value. In addition to the aforementioned properties, these proteins have many structural properties such as presence of multifunctional group and ability to bind with hydrophobic functionalities involving interactions such as ion binding, hydrophobic interactions, van der Waals attraction, hydrogen bonds, covalent conjugation, electrostatic interaction, etc. These structural properties make them suitable candidate for their use as drug delivery vehicles, or as components for the fabrication of various drug delivery platforms for therapeutic agents. Keeping these facts in mind we tried to explore milk protein as drug delivery vehicle using quality by design (QbD) approach. Lactoferrin (Lf) protein was selected as raw material for preparation of NPs because it has not been explored widely till date. Preparation of lactoferrin nanoparticles (Lf-NPs) with the aid of heat has been reported in literature previously, but heating might cause change in the conformation of Lf leading to decrease in the activity or potency of protein. In the present research, we have tried to use a technique other than heating for the preparation of Lf-NPs using simple desolvation technique. It is a simple and rapid method for preparation of protein NPs. In this technique, two miscible solvents are used for NPs preparation without involvement of factors such as high shear rate, heating, and sonication that can affect the structure of proteins (Leila et al. Citation2013). As per our knowledge, till date no literature is reported, related to use of QbD approach for preparation of protein NPs.
The QbD approach can be considered as a promising technique for pharmaceutical formulation development that includes predefined objectives and emphasizes product and process understanding and process control, based on quality risk management (Livney Citation2010). ICH guidance Q8 (R2) Pharmaceutical Development, ICH Q9 Quality Risk Management, and ICH Q10 Pharmaceutical Quality Systems provides an outline for manufacturing of pharmaceutical products to improve quality of pharmaceutical product. (Rathore et al. Citation2010). Various steps are included in QbD approach which is summarized in . The QbD approach starts with defining the target product quality profile (QTPP) followed by defining critical quality attribute (CQA), and selection of critical process parameters (CPP). The first step includes selection of target product quality profile (QTPP). It represent the quality characteristics of final product (which in this case will be the formulation) to ensure that the final formulation product meets the predetermined specification and gives desired performance. The desired performance or QTPP in case of NPs-based pharmaceutical formulation includes, particle size, zeta potential, drug loading efficiency, stability, release profile, pharmacokinetics, etc. to name the few (Fahmy et al. Citation2012). The next step is defining CQA which can be defined as “Quality attribute (a physical, chemical, biological, or microbiological property or characteristic) that must be controlled (directly or indirectly) to ensure the product meets its intended safety, efficacy, stability, and performance” (Berridge Citation2007). The CQA can be used sometimes to describe the QTPP. The next step is selection of CPP, which are the parameter in which a small change may lead to the product failure or failure to meet the desired QTPP (Robert et al. Citation2008). Once the CPP are selected, they can be varied so as to obtain a product which meets specification of QTPP. The selected CPP along with QTPP and CQA is used for defining design space which is defined as “The multidimensional combination and interaction of input variables (e.g., material attributes) and process parameters that have been demonstrated to provide assurance of quality” (Langer et al. Citation2003). Design space may be defined for a single process, multiple processes, or the entire process.
Figure 1. Various steps included in QbD approach.
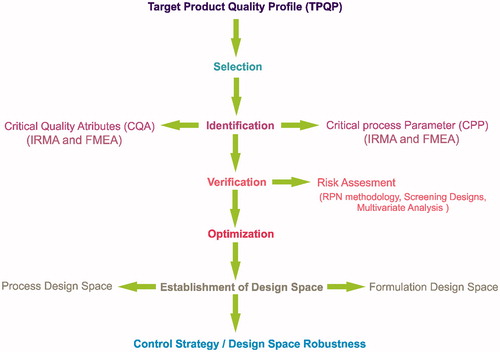
Our group has previously reported use of QbD approach/experimental design for optimization of pharmaceutical formulation (Kudarha et al. Citation2015, Pandey et al. Citation2014a, Citation2014b). In the present investigation, an attempt has been made to highlight the use of risk analysis, screening designs and design of experiments (DoE) for selecting the CPP and defining design space to maximize the desirability for achieving the predetermined QTPP. Factors were selected using failure mode and risk analysis and the further evaluation of factors for selection of CPP and optimization of process was done using Placket–Burman screening design and other DoE. After optimizing the critical product quality attributes (particle size and yield), curcumin was loaded on optimized Lf-NPs to obtained CLf-NPs.
Material and methods
The Lf was obtained as a gift sample from Frieslandcampina, the Netherlands. Curcumin was obtained from Sigma-Aldrich. Ethanol was purchased from Changshu Yangyuan Chemicals, China and NaOH and NaCl were purchased from Rankem, India. All other chemicals and reagent used were of analytical grade.
Preparation of Lf nanoparticles (Lf-NPs)
Blank Lf-NPs were prepared using desolvation method with slight modification (Azarmi et al. Citation2006). In brief, Lf was dissolved in 10 mM NaCl solution by stirring and then heated at specific temperature. The pH of solution was adjusted with 0.1 M NaOH. The resulting solution was stirred for certain time period followed by addition of ethanol to the solution with continuous stirring. Addition of organic solvent (ethanol, acetone, and iso-propanol) was continued till the colour of protein solution becomes turbid. At this point, further addition of ethanol was stopped and glutaraldehyde solution (8%) was added to facilitate intra-particle cross-linking of protein NPs. The solution was stirred overnight (12 h) for complete cross-linking of Lf-NPs. The resulting Lf-NPs were separated by centrifugation at 15,000 rpm for 30 min. After each centrifugation, the pellets were redispersed to wash Lf-NPs. The process was repeated several times.
Preparation of curcumin-loaded Lf nanoparticles(CLf-NPs)
CLf-NPs were prepared similar to that of blank Lf-NPs using desolvation method with slight modification (Azarmi et al. Citation2006) keeping the process and formulation variables similar to that of optimized batch of blank Lf-NPs. In brief, Lf was dissolved in 10 mM NaCl solution by stirring assisted with heating. The pH of solution was adjusted using 0.1 M NaOH. Curcumin was dissolved in acetone. The resulting solution of Lf was stirred followed by addition of curcumin containing acetone to the solution under continuous stirring. Glutaraldehyde solution (8%) was added to facilitate intra particle cross-linking of protein NPs. The solution was stirred overnight (12 h) for complete cross-linking of CLf-NPs. The resulting CLf-NPs were separated by centrifugation at 15,000 rpm for 30 min. After each centrifugation, the pellets were redispersed in acetone for washing of CLf-NPs.
Characterization of nanoparticles
Particle size analysis
Particle size analysis of Lf-NPs and CLf-NPs was conducted using Zetasizer (Nano ZS 90, Malvern Instruments Ltd., Malvern, UK) equipped with a 4.0 mW internal laser and based on the dynamic light scattering phenomenon. Prior to the measurement, all samples were diluted with double-distilled water to obtain a uniform protein dispersion having concentration below 0.5 mg/mL, in disposable polystyrene cell. All measurements were performed at 25 °C, at a scattering angle of 90°. The intensity weighed mean diameter of the bulk population of particles was given by z-average diameter value of the particles. Each sample was measured in triplicate in the analysis.
Zeta potential analysis
Zeta potential was measured using a Malvern ZS90 zetasizer and a folded capillary cell. Lf-NPs and CLf-NPs were dispersed in 5 mL of distilled water and were sonicated for 30 min. The dispersion was stirred continuously at 500 rpm and room temperature for 30 min. The zeta potential was measured at 25 °C. All measurements were performed in triplicate.
Percent particle yield
Weight of Lf taken and weight of NPs obtained were used for calculating percent particle yield (Mehravar et al. Citation2009).
Determination of entrapment efficiency (%EE)
For determining the entrapment efficiency, CLf-NPs were separated from un-entrapped free drug using ultracentrifugation at 15,000 rpm for 30 min. Amount of free drug present was determined using spectrophotometer at 450 nm. Entrapment efficiency was calculated using the formula:
Surface morphology
Surface morphology of formulated Lf-NPs was studied using transmission electron microscopy (TEM). TEM analysis was done for Lf-NPs suspensions using Philips CM120 transmission electron microscope. For TEM analysis, a small drop of sample was placed on a polymer filmed copper grid and allowed to stand for 2 min. The excess sample was removed using filter paper, followed by the addition of 10 μL of uranyl acetate. The grid was then allowed to stand for another 2 min, washed in distilled water and air dried, forming a thin film, which was viewed at 70 kV.
In vitro cell viability assay
Inhibition of cellular growth was determined in HeLa cell line using a MTT assay as described earlier. Briefly, HeLa cells were separately seeded on 96-well plates with cell density of 5 × 10³ cells/well and left for seeding 24 h prior to the test. After 24 h, the old medium was discarded and cells were incubated with various concentration of DM, curcumin, CDM, CMDM-F, and CMDM-I (0, 1, 10, 20, 40, 80 μg/mL). The cells were then incubated for 24 h at 37 C with 5% CO2. The medium was replaced by serum-free DMEM before the addition of 20 μL of MTT solution (5 mg/mL) to each well, and the cells were incubated at 37 °C for another 4 h in dark. After 4 h when the MTT fully integrated with cells, 150 μL DMSO was added to the cells after withdrawing the MTT solution to dissolve the MTT Formazan crystals. The plates where then oscillated for 10 min to confirm the dissolution of Formazan in DMSO. Finally, the absorbance was immediately measured at 570 nm by a microplate reader (Bio-Rad, Hercules, CA, USA). The cell viability (%) was related to the control wells containing untreated cells with fresh cell culture medium and was calculated according to the following formula:
The values measured were expressed as mean value ± SD (n = 5).
In vitro drug release from CLf-NPs
In vitro drug release was studied by carrying out dissolution tests using a USP paddle system under sink conditions in PBS kept at a controlled (37 °C ± 0.5 °C) temperature (Vivek et al., Citation2015). The release of curcumin from CLf-NPs was performed in phosphate-buffered saline (PBS, pH7.4) containing 0.1% w/v Tween-80 at 37 °C at 50 rpm. CLf-NPs were incubated at 37 °C for 30 min following which the mixture was injected into a sealed dialysis tube (MW cutoff 10 kDa) and placed in a flask containing 60 mL of PBS (preheated at 37 °C). The flask was then incubated in a reciprocal shaking bath (Thermo Scientific, Odessa, TX) at 37 °C under constant shaking at 120 rpm. At predetermined time intervals, aliquots of 2 mL were withdrawn from the flask and the sink condition was maintained by adding 2 mL of PBS (pH 7.4) to maintain a constant volume in the system. The withdrawn samples were further analyzed using UV–Visible spectrophotometer at 426 nm. The curcumin concentrations in the released samples were determined using a standard plot of curcumin (0–10 μg/mL) prepared under identical conditions.
Qualitative risk analysis/risk assessment
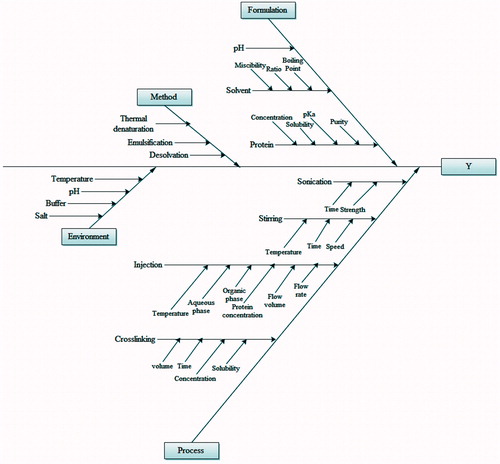
Risk analysis includes evaluation of the qualitative or quantitative process of linking the likelihood of occurrence and severity of harm and the ability to detect the harm. For identifying critical processing variables, Ishikawa diagrams/cause and effect diagram was used. Ishikawa diagrams were constructed to establish relation between the processing/formulation variables and characteristics affected in order to identify the potential risk affecting quality attributes. The failure mode effect analysis (FMEA) method was used for qualitative risk assessment. FMEA helps to identify the factors which can cause failure of product from meeting the desired QTPP. The risk analysis (FMEA) was done by organizing all the probable factors using Ishikawa diagram or fish bone diagram.
Experimental design
Plackett–Burman screening design was selected for analyzing the critical factors with maximum effect on QTPP. Plackett–Burman screening design with 12 runs was constructed using SAS, JMP (UK) software. The factors selected for Plackett–Burman screening design were the factors having highest impact on product quality attribute which includes, Lf concentration (X1), stirring time (X2), stirring speed (X3), sonication time (X4), temperature (X5), flow rate (X6), pH (X7), and glutaraldehyde concentration (X8). These factors were assessed to be of high risk as compared to other factors. The selection of low and high values was based on the result of preliminary study and previously reported research work. The response evaluated includes particle size (Y1), polydispersity index (Y2), and yield (Y3). Multi-linear regression and ANOVA were performed to analyze data, and sorted parameter estimates were calculated to demonstrate the influence of each parameter on response.
Optimization of Lf nanoparticles: custom design
After screening the factors having main effect on the selected response of Lf-NPs, custom experimental design was selected for optimization of Lf-NPs. The upper and lower values for main factors affecting the response were selected directly from the values used in PB design with 10% variation. Multi-linear regression and ANOVA were performed to analyze data, and sorted parameter estimates were calculated to demonstrate the influence of each parameter on response.
Optimization and establishment of design space
In order to confirm the formulation design space depending on results of FMEA and PB screening design, prediction plot was used for establishment of design space. Based on the desired value of the responses, a batch was suggested by the software defining values for each factor selected for screening design. The suggested batch was formulated and analyzed for selected response. The observed responses were compared with the predicted responses. Same process was also repeated for custom design.
Analysis of design space robustness
To study the robustness of design space for optimal quality attributes, the optimized batch obtained after custom design was formulated 12 times to mimic the experimental conditions which was present in PB screening design and custom design (design matrix with 12 experimental runs) to confirm the absence of variation and presence of reproducibility. Apart from repetition of formulated batch, a 5% variation was done in the final values of all the factors and formulation was done.
Statistical analysis
All results were analyzed using statistical software package JMP (SAS). The experimental data obtained were validated by ANOVA combined with the F-test. The determination coefficient (R2, agreement between the experimental results and predicted values obtained from the model) and the model F-value (Fisher variation ratio, the ratio of mean square for regression to mean square for residual) were applied for statistical evaluation.
Result and discussion
Qualitative risk analysis/identification of critical variables
Ishikawa diagram () shows all the possible factors which can directly or indirectly affect the final product quality attributes which in the present case is particle size, zeta potential, polydispersity index, and yield. In order to select factors having maximum effect on quality attributes of final product, IRMA and RPN methodology was adopted. The IRMA study helps in preliminary screening of factors from Ishikawa diagram.
Figure 2. Ishikawa diagram.
IRMA categories factor on the basis of risk. Factors falling under category of high risk were evaluated using RPN methodology. RPN methodology includes assigning of values to each factor on the basis of their severity, occurrence and detection. RPN was calculated by multiplying the severity rating (S) with that of occurrence rating (O) and the detection rating (D). Priority order of factors falling under category of critical variables was done on the basis of final RPN calculation ().
Table 1. RPN for high-risk factors affecting TPQP.
Preliminary investigation study was done for the factors having high RPN. Seven factors, namely Lf concentration (X1), stirring time (X2), stirring speed (X3), sonication time (X4), temperature (X5), flow rate (X6), pH (X7), and glutaraldehyde concentration (X8) were selected for Placket–Burman screening study. Three responses were studied, namely particle size (Y1), polydispersity index (Y2), and yield (Y3). Zeta potential was not selected for study as there was no significant number of factors affecting value of zeta potential of formed NPs. Ratio of organic phase to aqueous phase and pH was optimized and kept constant for all runs generated by the Placket–Burman design.
Preliminary studies
Effect of solvent
Previously performed studies on preparation of protein NPs had shown that the size of NPs prepared from whey proteins using the desolvation method depends on the type of organic solvent used (Azarmi et al. Citation2006, Gunasekaran et al. Citation2007, Mehravar et al. Citation2009, Pandey et al. Citation2014a, Citation2014b, Singh et al. Citation2010). In the present work, effect of solvent (desolvating agent) was studied using different organic solvents as desolvating agent. Acetone, ethanol, and isopropanol were selected as solvent for the study. Ethanol and isopropanol falls under the category of polar protic solvent and acetone falls under category of polar aprotic solvent. NPs of different size were obtained with different solvents, namely ethanol (180–200 nm), acetone (150–180 nm), and isopropanol (190–240 nm). NPs with smallest size were obtained with acetone as desolvating agent and particle with largest particle size was obtained when isopropanol was used. The obtained result might help in tailoring the size of protein nanoparticle as per choice of delivery system, route of administration, and properties of therapeutic agent.
Effect of organic phase: aqueous phase ratio
The preliminary study was done for obtaining the optimal ratio of organic phase:aqueous phase which can aid in formation of NPs with desired size. Different ratio of ethanol:water was taken for studying its effect on particle size. It was observed that increase in ratio of organic phase:aqueous phase leads to increase in particle size of NPs. At ratio of 1:1, NPs formed were of smaller size having diameter less than 80 nm but the formed particles were not stable and hence particle size decreased to around 20 nm after few hours. At ratio of 2:1, NPs with average particle diameter of 120 nm were obtained but the PDI and particle size was not constant after few hours and particle size decreased to 90 nm and this was constant. PDI changed from 0.2 to 0.45. At organic phase:aqueous phase ratio of 2.5:1 and 3:1, stable NPs with average particle diameter of less than 200 nm were obtained. At ratio above 3:1, particles with average diameter of more than 200 were obtained. Organic phase:aqueous phase ratio of 3:1 was selected as optimal ratio for further study.
Experimental design
A total of 12 experimental runs were obtained from the Placket–Burman screening design involving eight independent variables as shown in . The response obtained showed variation in results depending on the combination of independent variables that suggests the significant effect of variables on response. The effect of independent variable (X1-X8) on response was evaluated using (SAS) JMP statistical software and Minitab 16.
Table 2. Plackett–Burman screening design.
Screening analysis
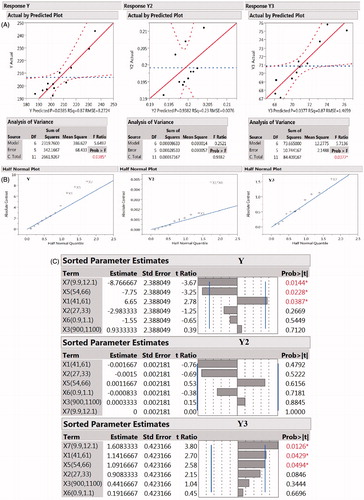
The effect analysis of design factors on each response was done to screen the factors with maximum effect on response. Half normal plots () give a visual idea about factors contributing more on observed responses. The point above the line indicates that factors are significant and have impact on desired responses.
Figure 3. (A) Half normal plots for response Y, Y2, and Y3; (B) actual vs. predicted plot for response Y, Y2, and Y3; (C) sorted parameter estimates for response Y (particle size); (D) sorted parameter estimates for response Y2 (PDI); (E) sorted parameter estimates for response Y3 (yield).
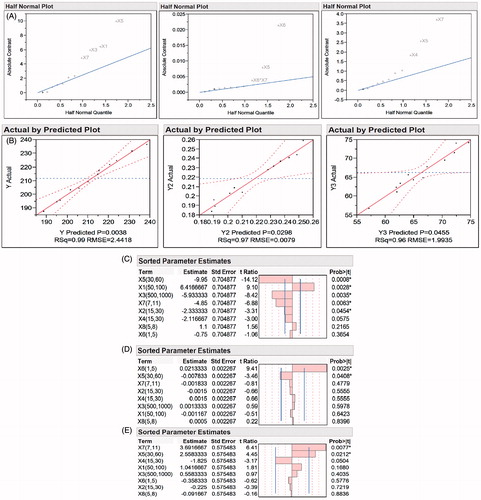
From the half normal plot we can observe that the factors X1, X2, X3, X4, X5, X6, and X7 have significant effect on the different response. In case of response Y2, interaction between X6 and X7 has shown to have impact on the final PDI of formulation. The effect of interaction between two independent variables can be studied using half normal plots. Response Y3 was mainly affected by factor X4, X5, and X7.
Predicted vs. observed analysis
To visualize the suitability of model, plot of predicted vs. observed value of responses is recommended. The plot for predicted vs. observed value for response Y, Y2, and Y3 is shown in . The R2 value for predicted vs. actual plot was above 0.9 for all responses which shows the suitability of model.
Effect analysis
Effect of design variables on particle size (Y)
Effect test of eight independent variables were performed on response particle size. Particle size varied from 187.7 nm to 236.3 nm (). Sorted effect estimates of model terms on particle size is shown in .
The most significant factors were X1, X2, X3, X5, and X7 (P < 0.05) relative to other factors influencing particle size. Temperature (X5) has most significant effect on particle size followed by concentration (X1), stirring speed (X3), and pH (X7). The effect of pH may be related to the isoelectric point (pI) of Lf. At neutral pH, a weak electrostatic repulsion exists between the particles which might lead to promote aggregation of particle and hence large particles are formed. At alkaline pH above 10 (which is far from pI of Lf), there would be a relatively strong electrostatic repulsion between the individual protein molecules, which may limit the formation of large protein aggregates and hence leads to formation of smaller particles. Increase in concentration of protein leads to increase in particle size, as the amount of protein diffusing in organic phase increases which may give rise to aggregation of NPs formed. Effect of concentration on particle size has not been studied deeply and needs to be studied for optimizing the concentration for optimum size of NPs. The effect of temperature on particle size of protein NPs has been reported earlier by many researchers (Eissa Citation2012, Nicolai et al. Citation2011, Qi and Onwulata Citation2011). It was observed that treatment of protein at temperature between 35 °C and 60 °C leads to formation of smaller particle. The result obtained in the present work is in accordance with previously published work. Decrease in particle size after treatment at high temperature may be due to unfolding of proteins which results in increased exposure of hidden thiol groups which helps in increased interconnection of protein molecules during precipitation, leading to formation of smaller particles (Alting et al. Citation2003). Stirring speed has been reported to affect the particle size of polymeric NPs such as liposomes. The reason for decrease in NPs size at high stirring speed may be due to increase in rate and extent of attrition between particles and between particle and solvent which leads to decrease in particle size. The negative estimates and t values for factors X2, X3, X5, and X7 shows that these factors have negative effect on the response which increases in these factors will lead to decrease in the value of response which in the case of particle size is of importance. The factor X1 has positive estimates which increase in value of X1 will lead to increase in particle size. No significant interaction between factors was observed in case of particle size which means no two factors interact to an extent enough to cause a significant effect of final response.
Effect of design variables on polydispersity index (Y2)
In case of PDI, the most significant factors relative to all other design factors influencing PDI were X6 and X5. The sorted effect estimates of model terms on particle size is shown in . The factor X6 had no effect on particle size but had significant effect on PDI, this shows the importance of estimating the effect of independent variables on responses because factors which are insignificant for one response may significant for other which directly or indirectly influence the final product quality attributes.
The effect of temperature on PDI was studied during preliminary investigation. It was found that pre-treatment of protein solution at high temperature leads to decrease in PDI. Decrease in PDI at high temperature has been reported in case of nanoemulsions (Erol and Borchert Citation2005). Effect of temperature on particle size of protein NPs has been reported earlier but effect of temperature on PDI of protein NPs has not been explored till date ().
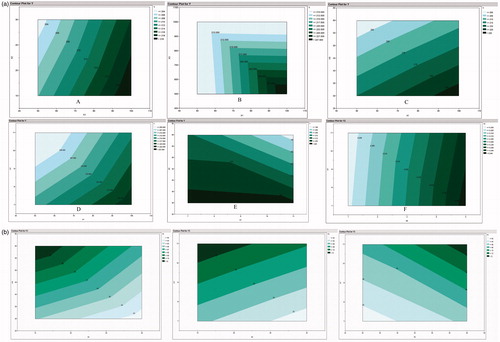
Figure 4. (a) Contour plots showing the effect of significant variables on particle size and PDI and (b) contour plots showing the effect of significant variables on yield.
Effect of design variables on yield (Y3)
For percentage yield, factors X5 and X7 had most significant effect. No significant interaction was observed between the factors. The sorted effect estimates is shown in Both factors X5 and X7 have positive estimates which increase in the value of these two variables will cause increase in the value of response Y3 which is required in present case. There is no published literature so far related to increase in yield of NPs with increase in temperature. The increase in yield may be due to increase in total number of particles formed. In addition to this, the formation of much stable particle due to unfolding of protein leads to increase in amount of particle remaining stable after NPs preparation. These reasons might be the responsible for increase in yield at higher temperature. Similarly, increase in yield with increase in pH is not explored but this may be probably due to increase in stability of formed NPs. At pH 7, i.e., below isoelectric point, protein particles had a low net charge around their isoelectric point, so there would only be a weak electrostatic repulsion between them and the intermolecular interaction is not strong enough to bind the particles together and ultimately dissociate leading to decrease in total yield. Further analysis by ANOVA indicated significant effect of independent factors on a response or combination of responses (prob > F value) (). In the ANOVA results, we can observe that the model is significant for all the responses, i.e., Y, Y1, and Y2.
The effect of significant factors on each response can be observed visually form the contour plots (). The contour plots show the effect of factors on particle size (), PDI (E)), and yield (). We can observe visually the effect of combination of factors on final response.
Table 3. ANOVA results for response Y, Y2, and Y3.
Evaluation of design based on screening design
The main requirement for establishing design is screening of key parameters which affect the final product quality. The CPP and CQA were identified from risk analysis and key parameters affecting formulation quality were obtained from the Placket–Burman screening study. These parameters were used for constructing the design space. The lower limit and the upper limit for response were defined to get a desirability curve () which gave the value of independent variables which will provide the desired response.
Figure 5. Prediction plot showing the predicted value of each response with desirability value for the Placket–Burman design.
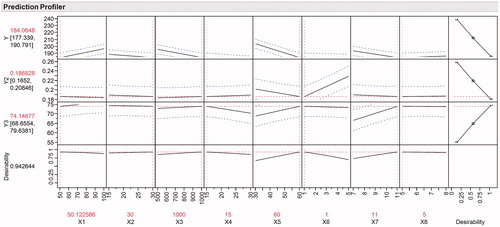
From we can observe the values of independent variables and predicted values of response. The predicted value for response Y (particle size) was in the range of 177.339–190.791. In case of response Y2 (PDI) and Y3 (Yield), the predicted value was in the range of 0.166–0.20 and 68.65–79.63, respectively. The composite desirability for the responses was 0.9426, i.e., there is 94.26% chance of getting the predicted response. The blue lines (dotted) represent the upper and lower limit of each factor while the red line (dotted) represents the desired value of response. Formulation was done according to the suggested batch. For evaluation of design space, the predicted response was compared with the observed response. The observed response was approximately similar to that of predicted response (Y1 = 185.54 nm; Y2 = 0.192; Y3 = 74.9%), indicating that the suggested values of independent variables are able to provide product will desired quality attribute.
Optimization of Lf nanoparticles: custom design
The custom design was performed for final optimization of desolvation process for fabrication of Lf-NPs. The evaluation of PB design demonstrated that the selected design was reproducible as the predicted and observed responses were almost similar. The custom design matrix used for the optimization of Lf-NPs is shown in . Six factors were selected on the basis of PB screening design, namely Lf concentration (X1), stirring time (X2), stirring speed (X3), flow rate (X6), and pH (X7) as these six factors showed maximum effect on selected responses. The responses were further analyzed using ANOVA.
Table 4. Custom design for study of design robustness.
The results of ANOVA () demonstrate that the factors had significant effect on response Y and Y3 but the effect was not significant on Y2, i.e., PDI. The half normal plot () shows the significant factor affecting response Y and Y3. From the plot, we can observe that for response Y, X1, X5, and X7 were the factors affecting it significantly where as in case of response Y2, factor X1 and interaction between factors X1 and X6 affected the response. For response Y3, X7 was the only factor affecting response most significantly although other factors also affected it. The sorted parameter estimates is shown in .
Figure 6. (A) Actual vs. predicted plot for response and ANOVA values for Y, Y2, and Y3 for custom design; (B) half normal plots for response Y, Y2, and Y3 obtained from custom design; (C) sorted parameter estimates for response Y, Y2, and Y3 for custom design.
Analysis of design space robustness
Protein formulations are highly sensitive to the manufacturing conditions and so the manufacturing conditions should be optimized and evaluated so as to control the CPP such that slight variation in the processing parameters would not affect the quality of final product significantly. During manufacturing process, there is variation in values of process parameter depending on manufacturing equipment. The design must be robust enough to cope up with these variations such that the final product quality is not affected. The optimized batch as suggested after custom design was formulated 12 times just to mimic the prior experimental batches which contained 12 experimental runs to see if variation exists. The result indicated absence of any significant variations in the value of responses.
The result obtained after 5% variation in the optimized value yield no significant variation with the variation if any arising being less than 1%. The percent variation observed in response of DoE created with factors having value with 5% variation from that of optimized formulation is less than 1% suggesting that the design is robust enough to withstand up to 5% variation in CPP without having a significant effect on final product quality attribute. A DoE created with 10% variation in CPP gave a variation of more than 5% in the value of obtained response suggesting that a variation of less than 10% in values of CPP will give a product with desired quality attribute. The final range of variables that can give a successful prediction of final quality attribute of product is shown in .
Table 5. Optimized values ranges for each variable (factor) for formulation of lactoferrin nanoparticle.
Curcumin-loaded Lf nanoparticles
The optimized batch of blank Lf-NPs was selected to fabricate curcumin-loaded lactoferrin nanoparticle (CLf-NPs) using method similar to that employed for fabrication of blank Lf-NPs. The particle size of optimized CLf-NPs batch was found to be 214.7 nm with entrapment efficiency of 53.7% and zeta potential 32.7 mV, which was more than that of blank Lf-NPs. This can be attributed to the fact that presence of surface adsorbed curcumin enhances the net positive charge attributed to amine groups of curcumin. The obtained particle size was higher than that observed for blank Lf-NPs. This variation can be attributed to the entrapment of curcumin in the matrices of Lf-NPs. The obtained yield of CLF-NPs was not significantly affected and found to be 70.4%. The decrease in yield can be correlated to the fact that, in case of blank Lf-NPs, the percentage particle yield was calculated with respect to total amount of Lf taken for the preparation of blank LF-NPs. In case of CLf-NPs, the percentage particle yield was calculated with respect to amount of Lf taken along with amount of curcumin taken for fabrication of CLf-NPs. The entrapment efficiency of CLf-NPs was found to be 53.7%. This means only 53.7% of total curcumin was entrapped in Lf-NPs and so only 53.7% of curcumin taken for fabrication of CLf-NPs is contributing to the total calculated yield of CLf-NPs, which ultimately leads to decrease in total percentage particle yield of CLf-NPs.
Surface morphology
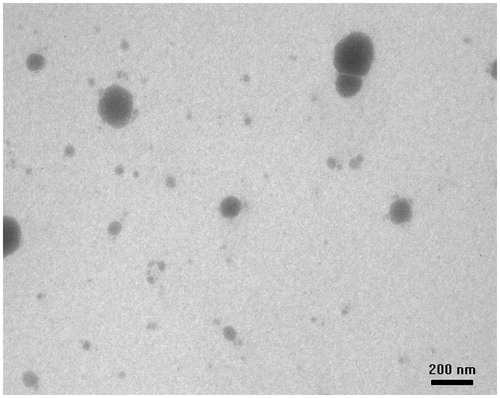
Surface morphology of fabricated CLf-NPs was studied using TEM. Maximum NPs were spherical in shape as evident from TEM images. The particles had a smooth morphology with almost uniform size and shape (. The TEM images show the absence of rod-shaped or irregular-shaped particles which can be attributed to efficient washing of fabricated CLf-NPs leading to removal of any un-entrapped or surface bound curcumin particles from the CLf-NPs.
Figure 7. TEM image of Lf-NPs.
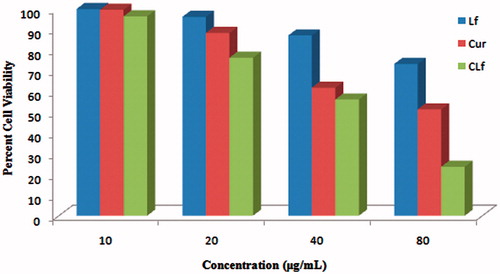
In vitro cell viability assay
Lf, curcumin, and CLf were assessed for their anti-proliferative activity. The results of anti-proliferative activity are shown in . Previously reported literatures have demonstrated anticancer ability of Lf which suggests that Lf can be employed to modulate the growth of tumor cells along with other anticancer agents (Duarte et al. Citation2011, Li et al. Citation2011, Park et al. Citation2013). Curcumin has been explored widely as anticancer agent in variety of cancers. Hence, CLf demonstrated maximum anti-proliferative activity which may be attributed to multiple factors including the enhanced penetration of curcumin due to nanoparticulate form, anticancer activity of Lf and enhanced cellular uptake of CLf. The result confirms that the fabricated Lf carrier can act as potential candidate for delivering anticancer agents.
Figure 8. Cell viability assay of Lf, curcumin, and CLf-NPs.
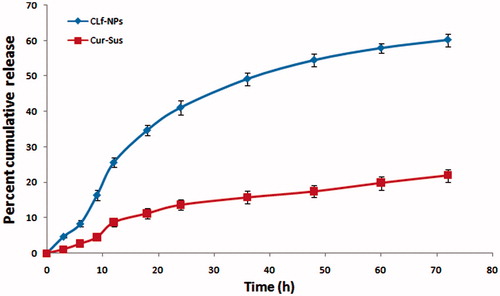
In vitro drug release from CLf-NPs
The in vitro drug release from CLf-NPs in PBS 7.4 is shown in . The result suggested that the release of curcumin was controlled by its dissociation from the porous polymer matrix. Curcumin suspension which was used as control showed release up to 21.7% in 72 h whereas in drug release from CLf-NPs was almost 61% in 72 h which may be attributed to increased water solubility of curcumin after being incorporated in lactoferrin. An initial burst release in case of CLf-NPs was obtained, which can be attributed to surface adsorbed drug. Although CLf-NPs demonstrated more curcumin release after 72 h still it maintained slow and sustained release which can be further modulated using surface modifying agents which can coat the surface of NPs leading to decrease in curcumin release from CLf-NPs.
Figure 9. In vitro drug release from CLf-NPs.
Conclusion
Use of screening designs reduces the number of experiments required to select or identify critical factors which are likely to affect the final product quality. Use of risk analysis for selecting high-risk factors and further evaluation of those factors using screening designs saves time and resources by providing visual identification of high-risk factors. The proposed design space for NPs preparation was robust enough, with buffering capacity of around 5% variation (in process and formulation variables), developed due to variation in manufacturing equipment and condition that will contribute in minimizing batch to batch variations. This approach may be used for tailoring the product quality as per requirement. This approach may be helpful in designing protein NPs as a drug delivery carrier with control on the critical product attribute such as particle size which can be modulated with variation in operating process variables. The optimized design space gave Lf-NPs with particle size, PDI, and yield of approximately 190 nm, 0.2, and 75%, respectively. The entrapment efficiency was found be more than 50% which can be further optimized by varying factors like concentration of drug, drug:Lf ratio, solvent, etc. The loading of curcumin did not affected the quality attributes like particle size and yield to a greater extent, suggesting that the proposed design can be used for loading of different drugs or proteins without obtaining large variation in the final quality attributes of loaded Lf-NPs. The study is still going on statistical optimization of entrapment efficiency along with particle size. The combination of innovative approach such as process capability measurements, lean manufacturing, and continuous improvement program may further help in identifying and optimizing critical variables and minimizing the variation in quality attribute and developing design with high robustness and improved performance. The enhanced anti-proliferative activity of CLf-NPs confirms that the fabricated Lf carrier can act as potential candidate for delivering anticancer agents.
Acknowledgements
The authors are thankful to Frieslandcampina, the Netherlands, for generously gifting sample of lactoferrin, ACTREC, Mumbai (India) and SAIF, Indian Institute of Technology, Mumbai for carrying out the in vitro cell viability assay and TEM analysis. Authors are also thankful to HRPIPER and North Maharashtra University, Jalgaon, for providing necessary facilities for carrying out the research effectively.
Disclosure statement
The authors report no conflicts of interest. The authors alone are responsible for the content and writing of this article.
References
- Alting AC, Hamer RJ, Kruif CG, Paques M, Visschers RW. 2003. Number of thiol groups rather than the size of the aggregates determine the hardness of cold set whey protein gels. Food Hydrocolloid. 17:469–479.
- Azarmi S, Huang YH, Chen S, McQuarrie D, Abrams W, Roa WH, Finlay GG, Lobenberg MR. 2006. Optimization of a two-step desolvation method for preparing gelatin nanoparticles and cell uptake studies in 143B osteosarcoma cancer cells. J Pharm Pharm Sci. 9:124–132.
- Berridge J. 2007. ICH Q8 & Q9 (+Q10) defined and undefined: gaps and opportunities. ISPE PQLI Washington Conference.
- Bulgarelli E, Forni F, Bernabei MT. 1999. Casein/gelatin beads: I. Cross-linker solution composition effect on cross-linking degree. Int J Pharm. 190:175–182.
- Chen Y, Willmott N, Anderson J, Florence AT. 1987. Comparison of albumin and casein microspheres as a carrier for doxorubicin. J Pharm Pharmacol. 39:978–985.
- Ding D, Zhu Z, Liu Q, Wang J, Hu Y, Jiang X, Liu B. 2011. Cisplatin-loaded gelatinpoly (acrylic acid) nanoparticles: synthesis, antitumor efficiency in vivo and penetration in tumors. Eur J Pharm Biopharm. 79:142–149.
- Duarte DC, Nicolau A, Teixeira JA, Rodrigues LR. 2011. The effect of bovine milk lactoferrin on human breast cancer cell lines. J Dairy Sci. 94:66–76.
- Eissa AS. 2012. Newtonian viscosity behavior of dilute solutions of polymerized whey proteins. Would viscosity measurements reveal more detailed molecular properties. Food Hydrocolloid. 30:200–205.
- Elzoghby AO, Abo El-Fotoh WS, Elgindy NA. 2011. Casein-based formulations as promising controlled release drug delivery systems. J Control Release. 153:206–216.
- Elzoghby AO, Samy WM, Elgindy NA. 2012a. Albumin-based nanoparticles as potential controlled release drug delivery systems. J Control Release. 167:168–182.
- Elzoghby AO, Samy WM, Elgindy NA. 2012b. Protein-based nanocarriers as promising drug and gene delivery systems. J Control Release. 161:38–49.
- Erol Y, Borchert HH. 2005. Design of a phytosphingosine-containing, positively-charged nanoemulsion as a colloidal carrier system for dermal application of ceramides. Eur J Pharm Biopharm. 60:91–98.
- Fahmy R, Kona R, Dandu R, Xie W, Claycamp G, Hoag SW. 2012. Quality by design I: application of failure mode effect analysis (FMEA) and Plackett-Burman design of experiments in the identification of “main factors” in the formulation and process design space for roller-compacted ciprofloxacin hydrochloride immediate-release tablets. AAPS PharmSciTech. 13:1243–1254.
- Forrest SA, Yada RY, Rousseau D. 2005. Interactions of vitamin D3 with bovine beta-lactoglobulin A and beta-casein. J Agric Food Chem. 53:8003–8009.
- Gubbins RH, O’Driscoll CM, Corrigan OI. 2003. The effects of casein on diclofenac release from hydroxypropylmethylcellulose (HPMC) compacts. Int J Pharm. 260:69–76.
- Gunasekaran S, Ko S, Xiao L. 2007. Use of whey proteins for encapsulation and controlled delivery applications. J Food Eng. 83:31–40.
- Hemar YM, Gerbeaud CM, Augustin MA. 2011. Investigation into the interaction between resveratrol and whey proteins using fluorescence spectroscopy. Int J Food Sci Technol. 46:2137–2144.
- Knepp WA, Jayakrishnan A, Quigg JM, Sitren HS, Bagnall JJ, Goldberg EP. 1993. Synthesis, properties, and intratumoral evaluation of mitoxantrone-loaded casein microspheres in Lewis lung carcinoma. J Pharm Pharmacol. 45:887–891.
- Kudarha RR, Dhas NL, Pandey AP, Belgamwar VS, Ige PP. 2015. Box–Behnken study design for optimization of bicalutamide-loaded nanostructured lipid carrier: stability assessment. Pharm Dev Technol. 20:608–618.
- Kytariolos J, Charkoftaki G, Smith JR, Voyiatzis G, Chrissanthopoulos A, Yannopoulos SN, Fatouros DG, Macheras P. 2013. Stability and physicochemical characterization of novel milk-based oral formulations. Int J Pharm. 444:128–138.
- Langer K, Balthasar S, Vogel V, Dinauer N, Briesen HV, Schubert D. 2003. Optimization of the preparation process for human serum albumin (HSA) nanoparticles. Int J Pharm. 257:169–180.
- Leila B, Madadlou A, Yarmand M, Mousavi ME. 2013. Nanoencapsulation of date palm pit extract in whey protein particles generated via desolvation method. Food Res Int. 51:866–871.
- Leo E, Vandelli MA, Cameroni R, Forni F. 1997. Doxorubicin-loaded gelatin nanoparticles stabilized by glutaraldehyde: involvement of the drug in the cross-linking process. Int J Pharm. 155:75–82.
- Li D, Sakashita S, Morishita Y, Kano J, Shiba A, Sato T, Noguchi M. 2011. Binding of lactoferrin to IGBP1 triggers apoptosis in a lung adenocarcinoma cell line. Anticancer Res. 31:529–534.
- Livney YD. 2010. Milk proteins as vehicles for bioactives. Curr Opin Colloid. 15:73–83.
- Mehravar R, Jahanshahi M, Saghatoleslami N. 2009. Production of biological nanoparticles from α-lactalbumin for drug delivery and food science application. Afr J Biotechnol. 8:6822–6827.
- Millar FC, Corrigan OI. 1993. Dissolution mechanism of ibuprofen-casein compacts. Int J Pharm. 92:97–104.
- Mohan V, Jurat-Fuentes JL, Harte F. 2013. Binding of vitamin A by casein micelles in commercial skim milk. J Dairy Sci. 96:790–798.
- Nicolai T, Britten M, Schmitt C. 2011. β-Lactoglobulin and WPI aggregates: formation, structure and applications. Food Hydrocolloid. 25:1945–1962.
- Pandey AP, Karande KP, Sonawane RO, Deshmukh PK. 2014a. Applying quality by design (QbD) concept for fabrication of chitosan coated nanoliposomes. J Liposome Res. 1:37–52.
- Pandey AP, Singh SS, Patil GB, Patil PO, Bhavsar CJ, Deshmukh PK. 2014b. Sonication-assisted drug encapsulation in layer-by-layer self-assembled gelatin-poly (styrenesulfonate) polyelectrolyte nanocapsules: process optimization. Artif Cells Nanomed Biotechnol. 43:413–424.
- Park YG, Jeong JK, Lee JH, Lee YJ, Seol JW, Kim SJ, et al. 2013. Lactoferrin protects against prion protein-induced cell death in neuronal cells by preventing mitochondrial dysfunction. Int J Mol Med. 31:325–330.
- Puyol P, Perez MD, Ena JM, Calvo M. 1991. Interaction of β-lactoglobulin and other bovine and human whey proteins with retinol and fatty acids. Agric Biol Chem. 55:2515–2520.
- Qi PX, Onwulata CI. 2011. Physical properties, molecular structures, and protein quality of texturized whey protein isolate: effect of extrusion temperature. J Agr Food Chem. 59:4668–4675.
- Rathore AS, Bhambure R, Ghare V. 2010. Process analytical technology (PAT) for biopharmaceutical products. Anal Bioanal Chem. 398:137–154.
- Robert AL, Lee SL, Lee LM, Raw A, Yu LX. 2008. Quality by design: concepts for ANDAs. AAPS J. 10:268–276.
- Singh HD, Wang G, Uludag H, Unsworth LD. 2010. Poly-L-lysine-coated albumin nanoparticles: stability, mechanism for increasing in vitro enzymatic resilience, and siRNA release characteristics. Acta Biomater. 6:4277–4284.
- Song F, Zhang LM, Yang C, Yan L. 2009. Genipin-crosslinked casein hydrogels for controlled drug delivery. Int J Pharm. 373:41–47.
- Vivek SJ, Abhijeet PP, Pravin RP, Prashant KD. 2015. Magnetically responsive siliceous frustules for efficient chemotherapy. Mater Sci Eng C Mater Biol Appl. 50:107–116.
- Zhen X, Wang X, Xie C, Wu W, Jiang X. 2013. Cellular uptake, antitumor response and tumor penetration of cisplatin-loaded milk protein nanoparticles. Biomaterials. 34:1372–1382.
- Zimet P, Rosenberg D, Livney YD. 2013. Re-assembled casein micelles and casein nanoparticles as nano-vehicles for ω-3 polyunsaturated fatty acids. Food Hydrocolloid. 25:1270–1276.