
Abstract
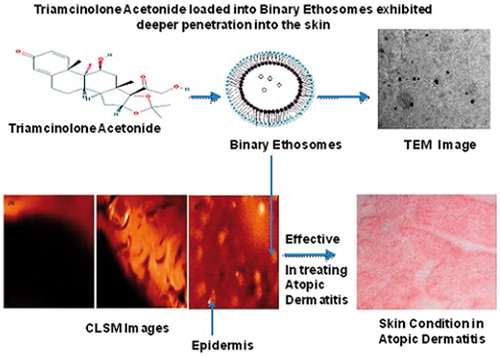
Triamcinolone acetonide (TA) employed for the treatment of atopic dermatitis exhibits limited penetration into the epidermis. This investigation aimed to explore the role of binary solvents in topical drug delivery of TA by developing nanoethosomal glycolic lipid vesicles by infusion method. Screening of vesicles (TA1-TA17) formulated by Box Behnken design identified the optimized formulation (TA10) that was developed as carbomer gels. The gels were then evaluated for pharmaceutical properties and compared with control and reference ethosomal gel (RG). Higher in vitro permeation was found in gels containing TA10, prepared with or without using penetration enhancer (EGP 83.76 ± 0.72% and EG 82.42 ± 0.89%, respectively). CLSM studies depicted deeper uniform penetration of fluorescent tracer into the epidermis via EG as compared with RG and control gel. Enhanced penetration was due to combinational solvent effect exerted by ethanol and propylene glycol. Histological analysis confirmed the non-irritant potential of the gel. Thus, it can be concluded that nanoethosomal glycolic vesicles proved to be an effective non irritant carrier for improvised penetration of triamcinolone acetonide for potential topical therapeutics.
Introduction
Atopic dermatitis (AD) is defined as a chronic inflammatory skin disease related to reduced water content of stratum corneum causing skin dryness and inflammatory response, which can transform the structural integrity of skin barrier. The therapeutic achievement in AD comprises of prevention as well as treatment of acute inflammatory process. This can be gained by employing topical anti-inflammatory therapy using topical corticosteroids (Emer et al. Citation2011). Triamcinolone acetonide (TA), is considered safe and effective in treating AD and is commercially available as cream and ointment. However, studies conducted on cream and ointments have reported local side effects and limited penetrability thus defeating optimum topical drug delivery to the target site (Buys Citation2007). In addition, TA exhibits formulation-related issues of limited solubility and permeability (BCS Class IV drug) and physicochemical properties such as molecular size (434.49 Dalton), chemical structure, and lipophilicity (log P 2.53) (Gool Citation2013). Therefore, it is highly challenging to overcome low-penetration rate of TA through the skin and at the same time achieving site-specific delivery. The carrier systems investigated to overcome these issues include transfersomes (Cevc and Blume Citation2003), which exhibit chemical instability; niosomal carrier (Desai and D’souza Citation2010, Sankar et al. Citation2015) that suffer from physical instability and drug leakage. Binary ethosomes offer an innovative approach for delivering TA deeper into the skin. Use of appropriate solvent blend in ethosomal carriers offers the manipulation of enhancing entrapment efficiency and stability with significantly improved skin penetration. Thus, the aim of this study was to investigate the potential of binary solvents in preparing nanoethosomal glycolic lipid vesicles (or binary ethosomes) and comparing with ethosomal gel.
Materials and methods
Materials
Triamcinolone acetonide was obtained as a gift sample from Akums Drugs & Pharmaceuticals Ltd, Haridwar, India. Soya lecithin and dialysis membrane 150 were procured from Himedia Laboratories Pvt. Ltd., Mumbai, India. Propylene glycol was from Sigma-Aldrich Chemie GmbH, Netherlands. Ethanol (95% v/v), dimethyl sulfoxide, PEG 400 and dimethyl formamide were purchased from SD Fine-Chem Ltd., Mumbai, India. Carbomer 934P and Rhodamine B were procured from Central Drug House (P), Ltd., New Delhi, India. Triethanolamine was purchased from Qualigens Fine Chemicals, Mumbai, India.
Methods
In vitro adsorption
TA (1 mg) was added to distilled water (50 ml) and ten-folds weight (10 mg) of soya lecithin was added to it. The mixture was magnetically stirred at 25 °C for 6 h. Samples (2 ml) were periodically drawn at hourly intervals and assayed spectrophotometrically using UV Spectrophotometer (Shimadzu, Pharma Spec 1700, Kyoto, Japan) at 245 nm.
Equilibrium solubility
Excess amount of drug was added to 10 ml distilled water in a conical flask and shaken for 72 h at 25 ± 1 °C in a thermostatically controlled water bath shaker. Additional solubility studies were conducted in the presence of various excipients. Samples were withdrawn at the end of experiment, filtered and assayed.
Fourier Transform Infrared (FTIR) spectroscopy
FTIR spectra were obtained after appropriate background subtraction using FTIR spectrophotometer (FTIR-8400SCE, Shimadzu Corporation, Tokyo, Japan) equipped with a diffuse reflectance accessory (DRS-8000) and a data station. Previously dried powder samples of TA, soya lecithin and binary mixture (1:1) of TA and soya lecithin were mixed individually with dry potassium bromide and scanned within the range of 4000–400 cm−1.
Preparation of vesicles
A Box–Behnken design consisting of three variables was used to analyze the sensitivity of the responses against the variations in the experimental variables (Moghddam et al. Citation2016). A total of 17 experiments were conducted including quintuplets of the centre point (). The vesicles of TA were developed by infusion method (TA1-TA17). Soya lecithin was dissolved in a binary mixture of ethanol and propylene glycol and to this drug (0.1% w/v) was added. The mixture was subjected to heating to 30 °C ± 1 °C in a water bath. Preheated distilled water (30 ± 1 °C) was added to the lipid mixture and stirred for 1 h. The suspension obtained was allowed to cool and sonicated at 4000 rpm using probe sonicator. The vesicles were purified by dialysis. Drug loaded vesicles were placed in a dialysis bag and transferred into 200 ml of phosphate buffer, pH 6.8. The receiver medium was magnetically stirred at 500 rpm (28× g) for 1 h. The purified samples were collected and characterized.
Table 1. Actual experiments with coded factor levels for optimization process and pharmacotechnical properties of EGVs.
Vesicle size and zeta potential
Vesicle size, zeta potential, and polydispersity index were measured using photon correlation spectroscopy by Zetasizer ver. 6.01 (Malvern Instruments Ltd, Malvern, Worcestershire, UK) by diluting one drop of ethosomal suspension with hydroethanolic solution at 25 °C in clear disposable zeta cells. All the measurements were done in triplicate for each sample.
Entrapment efficiency
Purified vesicular suspension was centrifuged (R-4C, Remi centrifuge, Vasai, India) for 1 h at 4000 rpm (1792.0 g). The sediment was lysed by methanol and filtered through nylon filter disc (0.22 μm) and assayed. Entrapment efficiency was calculated by the following equation
(1)
where, Wa: drug added; Ws : drug in supernatant; WP : drug in sediment.
In vitro drug release
The vesicular suspension (equivalent to 2 mg) was placed in dialysis bag, suspended in 250 ml of phosphate buffer, pH 6.8 and stirred at 100 rpm. Two milliliters of sample was withdrawn from the receptor compartment and analyzed spectrophotometrically at 245 nm. An equal volume of fresh phosphate buffer, pH 6.8 was added after each sampling to maintain the sink conditions.
Optimized formulation
The optimized formulation was selected based on highest desirability value obtained after validating the design statistically and was characterized. Transmission electron microscope (Morgagni 268D, FEI Company, Holland) was used for visualization. One drop of each formulation was placed on a copper grid for 2–3 min and stained by phosphotungstic acid. Air-dried sample was visualized at 4,500× magnification at an accelerating voltage of 80 Kv. The stability of the optimized and reference (RE) formulation was determined by storing the vesicles at 4 °C for 6 months. Samples were withdrawn at appropriate time intervals and assayed. Histological investigation was conducted using rat skin treated with optimized formulation for a period of 24 h to observe any modification in the morphology of skin. Fixation was done with 10% buffered formalin solution, ethanol dehydration, paraffin block processing; and stained with hematoxylin and eosin. Rat skin samples treated with distilled water (24 h) was used as a control. Microscopic examination was done using a light microscope at magnification 100×. The optimized vesicular formulation was developed as carbomer gel and was compared with reference ethosomal (RE) formulation. RE was prepared by adding the drug to a mixture of soya lecithin (2% w/v) in ethanol (40% w/v). Distilled water heated to 30 °C ± 1 °C was added to the mixture under constant stirring on magnetic stirrer for 1 h. Ethosomal suspension was then allowed to cool at room temperature and sonicated for three cycles at 4,000 rpm (1792.0 g). The purified RE was formulated as reference gel.
Carbomer gels
Presoaked carbomer 934P was used as a gelling agent. The optimized formulation (TA10) and reference ethosomes (RE) were centrifuged at 2,000 rpm (448 g), and the pellets (0.1%w/v) formed were incorporated in carbomer gel base. Triethanolamine was added under continuous stirring to the above dispersions to get EG and RG. Both the gels were modified by incorporating penetration enhancer (PEG 600) to get (EGP and RGP, respectively) and compared with control (CG) and hydroethanolic (HEG) gel () for physicochemical properties and in vitro permeation.
Table 2. Formulation design and characterization for the preparation of triamcinolone acetonide (TA) loaded gels.
pH, viscosity and drug content
The pH of gels was measured using Digital pH meter, model 111 E (HICON, New Delhi, India) and the viscosity was measured by Brookfield viscometer R/S-CPS (Brookfield Engineering Lab Inc., MA) using T-spindle S-93 at 20 rpm. The temperature was maintained at 25 ± 1 °C. The drug content was determined by diluting 100 mg of the gel with 5 ml of methanolic HCl. After vortexing for 5 min the volume was made up to 10 ml with methanolic HCl and assayed.
In vitro skin permeability
All the animal experiments have been conducted after obtaining approval by the Institutional Animal Ethical Committee of School of Pharmaceutical Sciences, IFTM University, Moradabad, India (837/ac/04/CPCSEA). The animals (Albino rats, Wistar strain, 150–200 g) were sacrificed by spinal cord delocalization. The animals were preshaved carefully and the abdominal skin was separated. The prepared skin was mounted on Franz diffusion cell (area, 3.14 cm2) and the test formulation (2 mg/cm2) was then applied on the epidermal skin section. One milliliter sample was withdrawn from the receptor compartment containing phosphate buffer, pH 6.8 and assayed spectrophotometrically at 245 nm. An equal volume of fresh phosphate buffer was added to the compartment to maintain the sink conditions. The investigation was performed in triplicate. Cumulative amount of penetrant per unit surface area was then plotted against time (Ahmed et al. Citation2015). The linear portion of the plot was taken to determine the steady-state flux, (Js). The permeability coefficient (Kp) was determined as
(2)
where, Cv is the concentration of penetrant in the donor solution. The optimized gel was then selected on the basis of highest percent cumulative drug permeability and steady state flux.
Confocal Laser Scanning Microscopy (CLSM)
To investigate the penetration capability of vesicles rhodamine B loaded vesicular gels were formulated. Rhodamine B loaded vesicles were prepared by infusion method (described earlier) using rhodamine in place of drug (TA) in optimized formulation (TA10). Tracer loaded EG was applied to the dorsal skin of albino rats (Wistar strain) for 8 h and compared with the tracer loaded RG and CG. Rats were then sacrificed and the skin was excised, washed, and placed on the aluminium foil. Sections of the skin samples were prepared and examined with CLSM (Nanonics Imaging Ltd., Jerusalem, Israel). Optical excitation was carried out with a 488 nm argon laser beam and fluorescence emission was detected above 560 nm for rhodamine B.
Results
Preliminary investigation
Based on preliminary investigations, the photomicrographs (data not shown) of binary vesicles prepared by infusion method (described earlier) using dimethyl formamide were non-uniform in shape and dimethyl sulfoxide and PEG 400 did not facilitate vesicle formation. On the other hand, a blend of ethanol with propylene glycol revealed spherical shape vesicles with definite boundaries. The concentrations of the experimental variables were also optimized and the effect of varying their concentrations on the response was analyzed via Box Behnken design. From the adsorption studies ([Supplementary Figure 1 (A)], 1 h was considered as optimum time for stirring of the reaction mixture to obtain maximum drug entrapment. Solubility analysis depicted the solubility of drug (17.9 μg/ml) close to its literature value of 21 μg/ml (Block and Patel Citation2006) and in presence of excipients; solubility enhancement was observed (data not shown).
FTIR spectroscopy
The spectral analysis of TA [Supplementary Figure 2 (A)] showed characteristics bands at wavenumber 3323 cm−1 (O–H stretching), 1654 cm−1 (C = O stretching), 3066.82 cm−1 and 3161 cm−1 (C–H stretching), 3066 cm−1, 3111 cm−1, 3128 cm−1, 3161 cm−1 (alkenes stretching), 1300 cm−1, 1100 cm−1 (C–O), 1610 cm−1, 1600 cm−1, 1475 cm−1 due to Aromatic C = C, 1373.32 cm−1 and 1442.75 cm−1 due to CH3 bending, 1662 cm−1 (carbonyl groups of aliphatic ester and ketone), and 1228 cm−1, 1242 cm−1, 1259 cm−1 because of the presence of C–F aryl fluoride group. The spectra of drug was found to be similar to the reference spectra given in IP (IP Citation2007) and also as reported by National Institute of Standard and Technology (NIST Citation2016). These characteristics peaks were also documented in the blends of drug (TA) and phospholipid (soya lecithin) [Supplementary Figure 2 (B)] without any significant shift in the wavenumber of peaks, however slight changes in intensity of peaks was observed in the spectra. Thus, presence of the slight modification in intensity of the peaks within acceptable limits depicted the absence of interaction between drug and excipients used to prepare ethosomes. Further, similar peaks of drug were also documented in the spectra of the formulation [Supplementary Figure 2 (C)]. Thus, revealing the presence of drug in the formulation and also absence of any kind of interaction between drug and excipients.
Preparation and purification
The vesicles (TA1-TA17) were prepared by entrapping TA as per the selected experimental design (). The ethosomal suspension was purified by dialysis for 30 min. Purification time was optimized by monitoring free drug release from a randomly selected formulation. Initially the free drug release increased linearly with time and reached a plateau level by 30 min [Supplementary Figure 1 (B)]. Paired sample t-test was showed no significant difference (p > 0.05) in amount of free drug released after 30 min. The results of evaluation of purified samples are detailed in the following text.
Vesicle size and zeta potential
The vesicle size ranged between 159.0 ± 1.90 and 520.3 ± 1.35 nm (). The PDI was found to be 0.067 ± 0.56 to 1.000 ± 0.23. PDI value less than 0.3 specified the homogeneity in size distribution. The zeta potential of the formulations was found to be −35.0 ± 0.18 to −77.7 ± 1.11 mV.
Entrapment efficiency
The entrapment efficiency (EE) varied between 36.71 ± 0.59 and 86.27 ± 0.97% and TA10 showed highest EE of 86.27 ± 0.97% (). Overall, the TA-loaded ethanolic glycolic vesicles (EGVs) showed higher EE than reference ethosomes (RE; % EE 72.16 ± 1.23) suggesting EGVs as promising carriers.
In vitro drug release
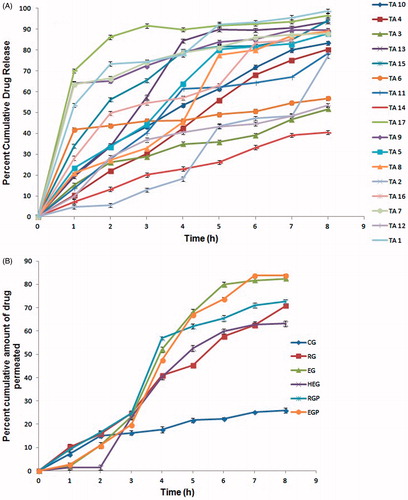
The in vitro release profiles were found to biphasic in nature, showing increased drug release that was then followed by a plateau providing continuous drug delivery till 8 h (). The cumulative drug release ranged between 51.69 ± 0.15 (TA3) and 98.67 ± 0.72% (TA1). The release kinetics depicted primarily first order kinetics and zero order kinetics for four formulations.
Figure 1. (A) In vitro release profiles of triamcinolone acetonide in phosphate buffer, pH 6.8 in 8 h using dialysis membrane; (B) In vitro cumulative permeability profiles of different gel formulations in phosphate buffer, pH 6.8.
Optimized formulation
The optimized formulation was deduced to be TA10 as it showed maximum desirability (value = 1). TEM images of TA10 and reference ethosomes (RE) revealed uniform, spherical vesicles with size in compliance with the zeta sizing report. However, TA10 vesicles () were smaller in size and more uniformly distributed as compared to RE (). TA10 was found to be stable as no significant difference (p > 0.05) in vesicle size, zeta potential and percent drug entrapment was observed () at the end of test period (6 months). Histological examination of skin treated with TA10 was compared with control (). The photomicrographs of control sample showed normal skin with uniformly layered stratum corneum (SC) well-defined epidermal and dermal layers (). In contrast, definite changes were observed in the skin morphology of TA10 treated skin samples. Clear disruption of SC organization, confirmed the penetration enhancing capacity of the vesicular carriers. The thickness and appearance of the SC were altered and intercellular vacuoles, loose voids, and empty spaces in the epidermal region were seen.
Figure 2. Transmission electron micrographs of (A) Reference ethosomes, RE; (B) Ethosomal glycolic vesicles, TA10.
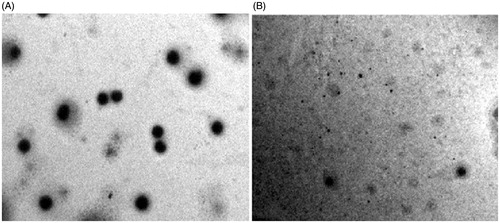
Figure 3. Skin histological micrographs (A) Control skin; (B) EGVs treated skin.
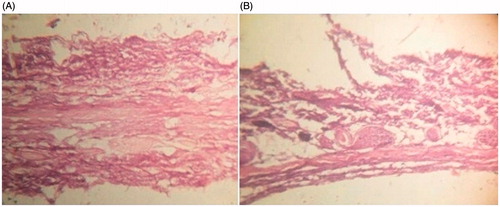
Table 3. Comparative stability investigation of optimized ethosomal glycolic vesicles (TA10) and reference ethosomes (RE).
Validation of experimental design
The results of the experimental design were analyzed using Design Expert software 9.0.6.2 (Stat-Ease Inc., Minneapolis, MN). The reduced polynomial response equation for entrapment efficiency is given below.
(3)
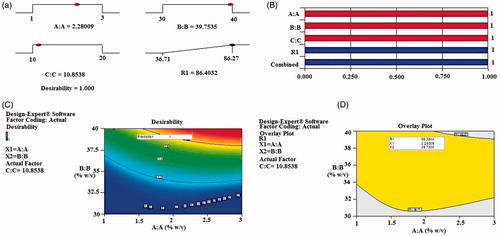
To analyze the effect of variables on the responses, response surface plots were generated. Curvature in the plots indicated non-linear relationship between entrapment efficiency and the amount of the independent variables. Based on literature analysis, goals for each response variables were assigned at 95% two sided confidence interval (a = 0.05) under the constraints of maximum EE. Solutions were generated and maximum desirability solution (desirability = 1) was selected (). The optimal concentration of process variables were X1 = 2.28; X2 = 39.75; X3 = 10.85 as observed from overlay plot (). Bar graph () and contour plots () were generated, which displayed the relationship between the independent variables and responses. An optimal batch of EGVs (TA18) was prepared using the optimal concentration of process variables and evaluated for % EE. The optimized batch had EE 86.91 ± 1.09%, which is in close agreement with the data (86.39%) obtained from optimization analysis using desirability functions.
Figure 4. Formulation optimization via Design-Expert software showing (A) Desirability ramp for optimization of vesicles; (B) Bar graphs; (C) Contour plot for optimization; (D) Overlay plot from graphical optimization technique.
Carbomer gels
pH, viscosity, and percent drug content
The gels were found to be transparent with faint odor of raw materials used. The pH, viscosity, and drug content of all gels are summarized in . All the values were within the optimum range. Drug content of EG was found to be higher as compared to the control gel (CG), hydroethanolic gel (HEG) and reference ethosomal gel (RG).
In vitro skin permeability
In vitro skin permeability data of TA from the formulated gels are summarized in . Highest in vitro permeation was found in gels containing ethosomal glycolic vesicles. The steady state flux was found to be remarkably higher in EG and EGP than reference ethosomal (RG/RGP), HEG, and CG. All the ethosomal formulations reached the target flux of 0.63 μg/cm2/min for TA (Mollmann et al. Citation1985). The permeation profiles () of EG/EGP and RG/RGP fitted zero order kinetics whereas the profiles of control and HE gels fit to the first order kinetics. Lag time ranged from 30 to 48 min in all gels, with highest value (48 min) in control gel. The permeability coefficient was deduced in the range of 0.07 × 10⁻³ to 1.52 × 10⁻³ cm/min, which lies within the permeability coefficient limits of human skin of 10−6 to 10−2 cm/min (Verma and Pathak Citation2012). On the basis of results obtained, EG was selected as optimized gel among ethosomal glycolic vesicles loaded gels as it was able to reach the target flux without incorporating a penetration enhancer (PEG 600) and showed percent cumulative drug permeability non-significantly different to EGP (p > 0.05).
Confocal Laser Scanning Microscopy
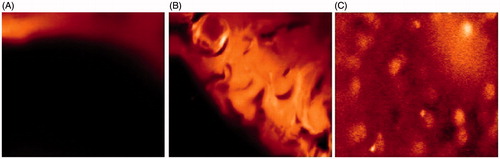
From CLSM micrographs, penetration of rhodamine B from control gel () was confined only to the upper layer of the skin. Reference ethosomal gel (), showed enhanced penetration deep into the epidermis. However, in case of EG (), penetration of rhodamine red was observed till the last layer (stratum basale) of epidermis and it was uniform throughout the epidermis.
Figure 5. Confocal photomicrograph of (A) Control gel; (B) Reference ethosomal gel; (C) ethosomal glycolic vesicular gel through confocal laser scanning microscope at 100×.
Discussion
An instigation of a desirable delivery system to achieve effective topical transport of TA has been considered a very stretching task due to its lipophilicity that limits its penetration via creams/ointments into deeper epidermis. Nanoethosomal glycolic lipid vesicles (EGVs/binary ethosomes) more appropriately fall into the category of the carriers that prompted this investigation. The formulations were developed based on BBD design and characterized. Among the characterization parameters, vesicle size plays a key role in defining optimum topical drug delivery and a size of less than 200 nm is thought to be optimum for topical drug delivery (Verma and Pathak Citation2012). The vesicle size was within the specified limit and significantly smaller than reference ethosomes. Use of binary solvent (ethanol and propylene glycol) reduces the vesicle size up to greater extent. Reduction in vesicle size was observed on increasing the concentration of ethanolic content along with the optimum concentration of PG. Ethanol added in formulation interacts with lipid bilayers and reduces the thickness of the vesicle membrane remarkably. This effect might be exerted due to the formation of a phase with interpenetrating hydrocarbon chain (Ahad et al. Citation2014). A decrease in vesicle size was also observed upon increasing PG concentration from 10 to 20% w/v. These findings suggested an interaction between PG and phospholipid bilayer allowing more flexibility to the bilayer, thus reducing the vesicle size. Highly lipophilic drugs like TA are entrapped mainly in the lipid bilayer of the vesicles. Reduction of repulsive forces between phosphate groups of lipid by TA could have led to closer packing of the lipid molecules (Elmoslemany et al. Citation2012), thus minimizing the size.
The PDI less than 0.3 indicate the homogeneous distribution of particles within the formulation. Vesicular suspensions acquiring potential above –60 mV exhibits excellent stability and low particle aggregation due to the high value of zeta potential. The vesicles depicted higher zeta potential as compared to reference ethosomes. Presence of high negative charge is contingent on ethanol, which confers a net negative charge to the surface and soya lecithin, which carries both the negative and weak positive charge. The EE was found to be higher in EGVs than reference ethosomes. The EE increased with increasing ethanolic concentration and inclusion of PG in ethosomal vesicles resulted in a statistically significant (p < 0.05) enhancement in EE of TA due to solubilizing effect exerted by propylene glycol. However, with increase in PG concentration, EE was decreased. As explained by Barupal et al. (Citation2010) at above 10% PG concentration, vesicle disruption may occur causing the drug leakage. In vitro drug release profiles exhibited biphasic release pattern with faster release in early 4 h for almost all formulations with variable release rates. Post the fourth hour; the release reached the plateau up to 8 h. Higher drug release was demonstrated due to higher percent of drug entrapped in it, which increased the cumulative amount of drug released. Role of binary solvents in enhancing drug transport is described by Karande and Mitragotri (Citation2009), where authors revealed that a mixture of two or more solvents facilitate the drug transport.
The findings of the experimental design were subjected to analysis by Design Expert software 9.0.6.2 (Stat-Ease Inc., Minneapolis, MN). Comparison of predicted value with experimental value of % EE indicated no significant difference (p > 0.05) between the two values thus validating the design. TEM analysis revealed the small spherical vesicles explaining the fluidizing effect exerted by ethanol and propylene glycol. The optimized ethosomal formulation upon storage was found to be physically stable due to the net negative surface charge conferred by ethanol that avoids aggregation of vesicles due to electrostatic repulsion. Disruption of SC organization confirmed the penetration enhancing capacity of vesicles (Kumar et al. Citation2016).
The carbomer gels of optimized formulation were clear and transparent with a pH close to normal physiological pH range of the skin (3.0–9.0) indicating non-irritating potential to the skin. Viscosity is an important parameter, which depicts the skin penetration. Furthermore, carbomer 934P develops a network by forming junction zones, responsible for providing mechanical strength to the gel. In the presence of the drug, the gel viscosity decreased up to some extent, which might be a reason behind reduced viscosity of control gel (Verma and Pathak Citation2012). In the other formulations, however, the difference in viscosity is insignificant; indicating that there are no signs of interaction between the vesicles and carbomer chains. Drug content of EG/EGP was found to be higher due to the obvious reason of presence of binary solvent system. The in vitro permeation profile of TA showed that EG presents higher flux than reference ethosomal gel. The reason for this better performance of EG formulations is the higher flexibility and the ability to retain vesicle integrity (Ahad et al. Citation2014). Permeability enhancement was observed due to synergistic effect of propylene glycol and ethanol (Barupal et al. Citation2010). Propylene glycol acts as a penetration enhancer for the drugs which are better soluble in alcohol than in water. The solvation of keratin within the stratum corneum by competition with water for the hydrogen bond binding sites and the intercalation in the polar head groups of the lipid bilayers by propylene glycol are postulated as mechanisms of action for the penetration enhancement (Raut et al. Citation2014). The synergistic combinatorial effect of ethanol and soya lecithin is depicted to be responsible for a deeper drug loaded distribution and penetration into the skin layers.
Confocal photomicrographs showed enhanced fluorescence intensity and penetration of Rhodamine B from ethosomal glycolic vesicular gel than reference ethosomal gel and control gel. While propylene glycol reduces the diffusional resistance of the skin barrier, probably due to the fact that it keeps the drug in solution form to undergo diffusion across the skin, ethanol exerts it “ethanol” and “ethosomal action”. The safe and enhanced transport of TA via binary ethosomal carrier within the skin might help to optimize targeting of this drug to the epidermal sites, thus creating new opportunities for well-controlled and modern topical application of TA in the treatment of atopic dermatitis.
Conclusions
Nanoethosomal glycolic vesicles represented a stable and efficient vesicular carrier for enhanced topical delivery of TA that exhibited higher entrapment efficiency, and stability than reference ethosomal vesicles. In vivo CLSM study confirmed the uniform and deeper penetration via ethosomal glycolic vesicles into the epidermis. Thus, ethanol glycolic vesicles signify a better ethosomal system for topical drug delivery.
IANB_1202261.rar
Download (140.6 KB)Acknowledgements
The authors are thankful to the Director, SAIF, AIIMS, New Delhi, India, for providing the facility for Transmission electron microscopy and IIT, Delhi for CLSM analysis.
Disclosure statement
The authors report no conflicts of interest.
Related Research Data
References
- Ahad A, Raish M, Al-Mohizea AM, Al-Jenoobi AI, Alam MA. 2014. Enhanced anti-inflammatory activity of carbopol loaded meloxicam nanoethosomes gel. Int J Biol Macromol. 67:99–104.
- Ahmed S, Imam SS, Zafar A, Ali A, Aqil M, Gull A. 2015. In vitro and preclinical assessment of factorial design based nanoethosomes transgel formulation of an opioid analgesic. Artif Cells Nanomed Biotechnol. 20:1–10.
- Barupal AK, Gupta G, Ramteke S. 2010. Preparation and characterization of ethosomes for topical delivery of aceclofenac. Indian J Pharm Sci. 72:582–586.
- Block LH, Patel RN. 2006. Solubility and dissolution of triamcinolone acetonide. J Pharm Sci. 62:617–621.
- Buys LM. 2007. Treatment options for atopic dermatitis. Am Fam Physician. 75:523–528.
- Cevc G, Blume G. 2003. Biological activity and characteristics of triamcinolone-acetonide formulated with the self-regulating drug carriers, transfersomes. Biochim Biophys Acta. 1614:156–164.
- Desai SR, D’souza JI. 2010. Development and evaluation of the antiinflammatory triamcinolone acetonide loaded niosome. World J Pharm Res. 3:15–25.
- Elmoslemany RM, Abdallah OY, El-Khordagui LK, Khalafallah NM. 2012. Propylene glycol liposomes as a topical delivery system for miconazole nitrate: comparison with conventional liposomes. AAPS PharmSciTech. 13:723–731.
- Emer JJ, Frankel A, Sohn A, Lebwohl M. 2011. A bilateral comparison study of pimecrolimus cream 1% and a topical medical device cream in the treatment of patients with atopic dermatitis. J Drugs Dermatol. 10:735–743.
- Gool WAV. 2013. Triamcinolone/Triamcinolone acetonide. Evaluation of the effects on reproduction, recommendation for classification. Minister Soc Aff Employ. 1:1–69.
- IP (Indian Pharmacopoeia). 2007. The Indian Pharmacopoeia Commission, Ghaziabad.
- Karande P, Mitragotri S. 2009. Enhancement of transdermal drug delivery via synergistic action of chemicals. Biochim Biophys Acta. 1788:2362–2373.
- Kumar L, Verma S, Kumar S, Prasad DN, Jain AK. 2016. Fatty acid vesicles acting as expanding horizon for transdermal delivery. Artif Cells Nanomed Biotechnol. 18:1–10.
- Moghddam SMM, Ahad A, Aqil M, Imam SS, Sultana Y. 2016. Optimization of nanostructured lipid carriers for topical delivery of nimesulide using Box-Behnken design approach. Artif Cells Nanomed Biotechnol. 6:1–8.
- Mollmann H, Rohdewald P, Schmidt EW, Derendorf H. 1985. Pharmacokinetics of triamcinolone acetonide and its phosphate ester. Eur J Clin Pharmacol. 29:85–89.
- NIST (National Institute of Standards and Technology) Standard Reference Database 69: NIST Chemistry WebBook. 2016.
- Raut SV, Nemade LS, Desai MT, Bonde SD, Dongare SU. 2014. Chemical penetration enhancers: for transdermal drug delivery systems. Int J Pharm Rev Res. 4:33–40.
- Sankar V, Babu E, Siram K, Penmetsa SD, Kabila B, Srinavas CR, Raiet R. 2015. Formulation and clinical evaluation of triamcinolone acetonide niosomes: effect of iontophoresis on the permeation across skin. Pharm Nanotech. 1:282–289.
- Verma P, Pathak K. 2012. Nanosized ethanolic vesicles loaded with econazole nitrate for the treatment of deep fungal infections through topical gel formulation. Nanomed Nanotech Med Biol. 8:489–496.