
Abstract
In the present investigation, we have explored simple, robust, inexpensive, and eco-friendly method for the synthesis of silver nanoparticles (AgNPs) using Terminalia arjuna bark extract (TA-AgNPs). Various parameters dictating the biosynthesis of TA-AgNPs such as time and temperature of reaction, concentration of AgNO3, and T. arjuna extract amount were investigated. Characterization of TA-AgNPs was done via UV-vis spectroscopy along with FT-IR, XRD, SEM and dynamic light scattering. The antimicrobial activity of TA-AgNPs was investigated against Escherichia coli. Comparable zone of inhibition was exhibited by TA-AgNPs. This study suggests that TA-AgNPs possesses significant antibacterial properties.
Introduction
Silver nanoparticles (AgNPs) have received substantial attention owing to their myriad of application including, photonics, catalysis, antimicrobials and antifungals. Several methods have been reported for the preparation of AgNPs which includes chemical reduction, sonochemical, laser ablation and thermal decomposition. Amongst all, chemical reduction is the most widely employed method. The chemical reduction route consists of reduction of metal salts such as silver nitrate (AgNO3) by using reducing agents such as sodium borohydride, sodium citrate, etc., to produce colloidal silver (Ag0) nanoparticles (Evanoff and Chumanov Citation2005; Lee and Meisel Citation1982; Salkar et al. Citation1999; Simakin et al. Citation2004; Yang et al. Citation2007). Though chemical route is highly efficient, it suffers from several drawbacks such as use of expensive, toxic chemicals and solvents.
Biological synthesis of AgNPs is rapidly evolving as an alternative approach as it is eco-friendly and cost effective, in contrast to chemical reduction; avoids application of toxic chemicals and reagents (Makarov et al. Citation2014; Poulose et al. Citation2014; Roy et al. Citation2013). Biosynthesis of nanomaterials have been reported by employing bacteria, fungi and plant extracts (Dar et al. Citation2013; Thakkar et al. Citation2010). AgNPs biosynthesis using plant extract have been preferred as use of microbes may contaminate the nanoparticles when used for therapeutics (Narayanan and Sakthivel Citation2013). Moreover, plant extract based synthesis appears to be easily amenable to large scale-up (Akhtar et al. Citation2013; Iravani and Zolfaghari Citation2013). Furthermore, plant extracts are less time consuming than microbes in the synthesis. The major phytochemicals involved in the preparation of AgNPs are alkaloids, terpenoids, flavanoids, ketones, aldehydes, amides, tannins, quinones and carboxylic acids. Phytochemicals like flavones, organic acids, and quinones are soluble in water and are responsible for the immediate reduction of the silver ions to AgNPs. Several plants extracts have been explored for the biosynthesis of AgNPs including, Citrus sinensis peel, Cinnamon zeylancium bark, Hibiscusrosa sinensis, Coleus amboinicus lour, Mushroom extract, Medicago sativa, Azadirachta indica, Althaea officinalis, Panax ginseng, Weissella oryza (Kaviya et al. Citation2011; Lukman et al. Citation2011; Narayanan and Sakthivel Citation2011; Sathishkumar et al. Citation2009; Singh et al. Citation2015a, Citation2015b).
Terminalia arjuna belongs to Combretaceae family which is a large evergreen tree with 60–80 feet in height, spreading crown, and drooping branches (Gopinath et al. Citation2013). Arjuna tree is abundantly found in India all around the sub-Himalayan tracts and the Deccan regions. Bark of this tree is grey brown in color from outer covering and is soft, thick and of red color from inside. Phytochemical study suggests that it contains triterpenes, flavonoids, tannins, etc. (Seth et al. Citation2013). Terminalia arjuna leaves extract have been explored for the preparation of AgNPs with size in the range of 3–50 nm (Ahmed Citation2015). In another study, T. arjuna bark extract was employed for the preparation of AgNPs (size 10–15 nm) via microwave irradiation (Yallappa and Manjanna Citation2014). Silver/chitosan-poly vinyl chloride (Ag/CS-PVC) nanocomposite material synthesis has been reported using T. arjuna bark extract (Dwivedi et al. Citation2015). Despite several studies, the optimum conditions for synthesis of AgNPs in terms of reaction time, temperature, extract ratio, AgNO3 concentration using T. arjuna bark extract, have not been identified. No report to date have systematically examined the effect of reaction time, temperature, extract ratio, AgNO3 concentration on physicochemical properties of AgNPs synthesized using T. arjuna bark extract.
This study was designed to systematically investigate the influence of reaction time, temperature, extract ratio and AgNO3 concentration on size of AgNPs prepared employing T. arjuna bark extract. Biosynthesis of AgNPs was studied using ultraviolet-visible (UV-vis) spectroscopy, followed by size determination on dynamic light scattering (DLS) and field emission scanning electron microscopy (FESEM). Chemical composition of T. arjuna stabilized AgNPs was done using FT-IR, XRD and EDS. The antibacterial potential of AgNPs was explored against the bacteria, Escherichia coli.
Materials and methods
Materials
Silver nitrate and kanamycin acid sulphate were procured from CDH (P) Ltd, India. Luria broth and Luria agar were procured from microgen (CDH Pvt. Ltd.), India for culturing bacteria. Terminalia arjuna bark samples were procured from local herbs store in Jaipur, India. Double distilled water was used for the preparation of aqueous bark extract.
Plant material
The dried bark of T. arjuna was procured from local herbs store, Jaipur, India and identified. The bark was washed thoroughly under running water to remove any dirt and finally with double distilled water and kept in shade for drying.
Preparation of T. Arjuna bark extract
The dried bark of T. arjuna was crushed to fine powder using mortar and pestle. Aqueous bark extract of T. arjuna was prepared, by suspending 10 g of T. arjuna bark powder in 100 ml of double distilled water, boiled for 15 min and cooled at room temperature. The extract was filtered using Whatman filter paper No. 1 and the filtered extract was stored at 4 °C till further studies.
Biosynthesis of silver nanoparticles
Terminalia arjuna bark extract (10 ml) was added dropwise to 100 ml of an aqueous silver nitrate solution (1 mM) under stirring at room temperature (Stuart hot plate stirrer, model UC152). The stirring was continued till the change in color indicated the reduction of silver ions. The nanoparticles thus formed were subjected to centrifugation at 13,000 rpm, followed by removal of supernatant containing excessive silver ions (Hanil Combi 514R table top refrigerated centrifuge). Finally, the TA-AgNPs pellet was re-suspended in double distilled water and subjected to UV-vis spectrophotometric analysis.
Physicochemical characterization of silver nanoparticles
Ultraviolet visible spectroscopy
The formation of nanoparticles was characterized by measuring the absorbance between the ranges of 300–700 nm using UV-vis spectrophotometer (Halo DB-20 Dynamica double beam spectrophotometer). The O.D. of nanoparticles suspension was taken by diluting the samples in the ratio 1:10.
Dynamic light scattering measurements
The hydrodynamic diameter of the TA-AgNPs nanoparticles was determined by DLS measurements. Nanoparticles were suspended in 1 ml of double distilled water and vortexed prior to measurements. Nanoparticles size was determined using Zetasizer, Nano ZS (Malvern instruments, UK) employing a nominal 5 mW HeNe laser operating at 633 nm wavelength. The scattered light was detected at 173° angle. The refractive index (1.33) and the viscosity (0.89) of ultrapure water were used at 25 °C for measurements. All the data analysis was performed in automatic mode. Measured sizes were presented as the average value of 20 runs.
Field emission scanning electron microscopy
Nanoparticles were suspended in 1 ml of double distilled water and vortexed. The particle size, EDS and morphology of TA-AgNPs were assessed by field emission electron microscopy (FESEM, JEOL-JSM-7400F, Japan). For FESEM observation, the particles were simply deposited as a thin film on an aluminium stub. The images were taken using an SEI detector at 15 kV and a working distance of 3.2 mm.
X-ray diffraction measurements
The structure of particles was investigated by X-ray diffraction (XRD) using a Bruker D8 instrument. For the diffraction pattern acquisition, the step width and period were 0.02° and 1.5 s respectively, while the source, sample, and detector slits were 2, 0.6, and 1 mm. The Scherrer equation was used to calculate the size of the constituent crystallites.
Fourier-transform infrared spectroscopy
The presence of characteristic functional groups of T. arjuna extract conjugated to the surface of AgNPs were characterized by FT-IR (Perkin Elmer, Japan) spectroscopy in the range of 4000–500 cm−1 at 2°cm−1 resolution. Both the samples, i.e., bark extract only and TA-AgNPs, were recorded with KBr pellets on an FT-IR spectroscope at room temperature.
Optimization of silver nanoparticles preparation
Various parameters influencing the particles size have been studied for the synthesis of AgNPs (Kaviya et al. Citation2011; Lokina et al. Citation2014; Qu et al. Citation2014). In the present study, we investigated various factors in order to identify optimum conditions for the preparation of AgNPs using T. arjuna plant extract.
Effect of extraction time
Nanoparticles preparation was performed as mentioned above, with addition of T. arjuna (10 ml) extract to AgNO3 solution (100 ml) under stirring. After stipulated time points of 20, 40, 60, 80 and 120 min the nanoparticles were centrifuged, re-suspended in double distilled water, vortexed and exposed to UV-vis spectroscopic analysis.
Effect of temperature
Nanoparticles were synthesized as mentioned above, however, five different temperature points, i.e., 4 °C, 25 °C, 40 °C, 60 °C and 80 °C were selected for performing the biosynthesis reaction, followed by analysis on UV-vis spectroscopy.
Effect of silver nitrate concentration
In this set of experiments the concentration of AgNO3 solution was varied, i.e., 0.25, 0.5, 1, 1.5 and 2 mM, different size nanoparticles formation was monitored by color difference of the solutions, followed by analysis on UV-vis spectroscopy.
Effect of extract fraction
Nanoparticles preparation was performed as mentioned above, herein the concentration of extract was varied while keeping the concentration of AgNO3 solution constant, i.e., 1:40, 1:20, 1:10, 1:6.5 and 1:5 followed by analysis on UV-vis spectroscopy.
Determination of antibacterial activity
Antibacterial activity of TA-AgNPs was determined against different bacterial strains using disc diffusion method (Ahmed Citation2015). Strain of microorganism, i.e., E. coli DH5α was obtained from MTCC, IMTECH, Chandigarh, India. One percent of the bacterial cultures were grown in LB broth for 24 h. The cultures were allowed to grow till O.D. of 0.4 was obtained at 600 nm. For disc diffusion method, nutrient agar was poured into sterilized petri dishes and was allowed to solidify after which bacterial cultures of 0.4 O.D. containing 1 × 10⁶ CFU/ml were streaked. Following streaking Whatman filter paper no. 1 sterilized discs impregnated with TA-AgNPs of different concentrations were applied onto the plates. Kanamycin (50 μg/ml) was used as positive control and T. arjuna extract as negative control. The plates were then kept in the incubator at 37 °C for 24 h and zone of inhibition was calculated by measuring the diameter of region where bacterial growth was inhibited.
Statistical analysis
All the experiments were done in duplicates, with three separate experiments to demonstrate reproducibility. All the data were presented as mean ± standard deviation (± SD) of all the experiments. Statistical analysis was performed using a Student’s t-test. The differences were considered significant for P < 0.05 and P < 0.01 indicative of a very significant difference.
Ethical approval
This article does not contain any studies with human participants or animals performed by any of the authors.
Results and discussion
Biosynthesis of silver nanoparticles
The aqueous extract of T. arjuna bark was obtained by filtering the boiled water containing bark powder. The filtrate thus obtained was slightly brown in color and stored at 4 °C till further use.
Green synthesis of nanoparticles employing plant extracts not only avoids the use of toxic and organic solvents, but also provides greater stability over other methods available. Herein, TA-AgNPs were engineered to tap the hidden potential of T. arjuna bark extracts to reduce silver nitrate. Change in visual appearance was observed after addition of extract to silver nitrate solution. The colorless AgNO3 solution was transformed to dark brown giving preliminary evidence of silver nanoparticles formation. This change in color could be attributed to the reduction of Ag+ ion to Ag0 by reducing action of the phyto-constituents present in the extract. Amongst the phyto-constituents, flavonoids are strong reducing agents and are majorly responsible for the reduction of Ag+ ions into nanoparticles. Flavonoids are suggested to get oxidized resulting in formation of AgNPs from Ag+ ions (Ajitha et al. Citation2015). The phenolic compounds have also been suggested to possess chelating ability due the highly nucleophilic character of the aromatic rings (Moran et al. Citation1997). The keto form of the flavonoid backbone facilitates reduction of Ag+ to AgNPs which in turn results in conversion of flavonoids to enol form.
The presence of proteins and enzymes in the plant extracts favors reduction of Ag+ ions to pure AgNPs and their stabilization. Further, the peptide bonds in the proteins and enzymes present in the leaf extract undergo degradation to form smaller peptides. The carboxylate groups present in the peptides possess higher affinity to act as surfactants and form a protein corona layer on the AgNPs, which stabilizes the nanoparticles. Hence, the flavonoids facilitates reduction of Ag+ ions and the negatively charged carboxylate groups of AgNPs favors stabilization and prevents aggregation of nanoparticles. In the present study, the FT-IR data suggested of presence of polyphenols and proteins that could be inferred to have vital role in reduction of AgNO3 to AgNPs.
Physicochemical characterization of silver nanoparticles
Though change in the AgNO3 color after addition of extract suggested formation of silver nanoparticles, it was further confirmed as detailed below.
Ultraviolet visible spectroscopy
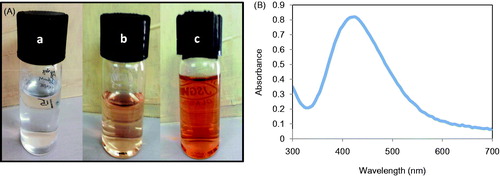
To monitor the formation of AgNPs, UV-vis spectroscopy has been largely employed (Lokina et al. Citation2014). Metallic nanoparticles of size between 2–100 nm have been observed to exhibit strong and broad surface plasmon resonance (SPR). Further, the absorption spectra of metallic nanoparticles have been reported to shift towards lower wavelengths with the decrease in the particles size. Moreover, the absorption band also depends on the dielectric constant of the suspension medium and molecules attached onto the surface of the nanoparticles (Xia and Halas Citation2005). As per Mie’s theory, the spherical shaped nanoparticles will give one single SPR band, while different shape nanoparticles, i.e., rod, triangle, cuboid, etc., will lead to two or more SPR bands (Mie Citation1908). In the present study, the change in color of AgNO3, i.e., appearance of dark brown color followed by addition of light brown color extract took only 40 min and beyond that time points no further color change was observed. The spectra were recorded from 300–700 nm and the peak corresponding to AgNPs was observed around 430 nm (). Since, the TA-AgNPs were consisted of only single population of spherical nanoparticles, a single spectrum of SPR was observed.
Figure 1. (A) (a) Silver nitrate solution alone (b) Silver nitrate solution with T. arjuna extract at time 0 min (c) Silver nitrate solution with T. arjuna extract after 20 min, showing formation of TA-AgNPs; (B) UV-vis spectrum of the TA-AgNPs.
Physicochemical characterization
The size and size distribution of AgNPs was analyzed by employing DLS. The average hydrodynamic diameter of TA-AgNPs suspended in double distilled water was observed to be 64.6 ± 1.8 nm (). Determination of surface charge revealed of the zeta potential of -15.9 mV. Further, the size and morphology of TFG-AgNPs was investigated by FESEM. As evident from the image, the particles were found to be spherical and have smooth surface with size in the range of 30–50 nm (). This variability in size could be due to two different characterization methods used. DLS was performed on AgNPs suspended in water which makes them fully hydrated, whereas, SEM investigation is done on dried samples. Furthermore, the DLS studies provides a quantitative data for average size as it measures size of thousands particles per second whereas, SEM is comparatively qualitative as it visualizes only a small number of AgNPs. Henceforth, the application of these two different but complementary techniques facilitates an overall investigation of both size and surface morphology.
Figure 2. (A) Representative DLS spectrum of TA-AgNPs, the size here is ∼65 nm. (B) FESEM image of TA-AgNPs. (C) EDS spectrum of TA-AgNPs.
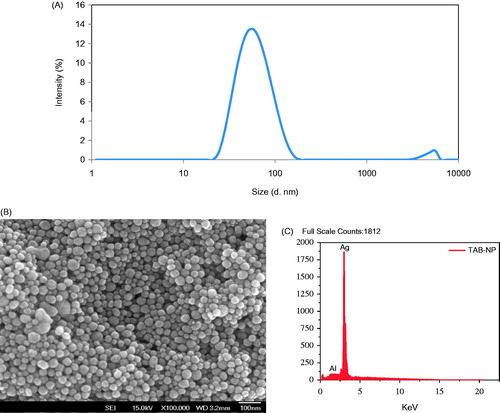
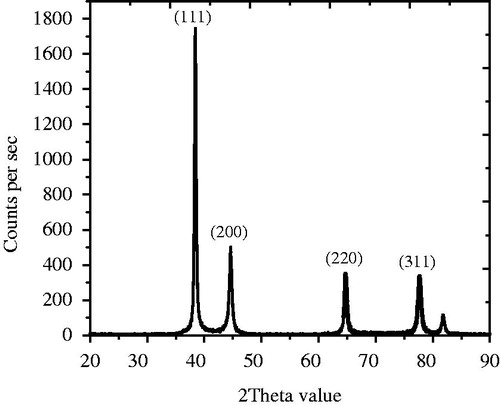
The EDS spectrum of TA-AgNPs showed high intense silver peak at 3 keV, which is the characteristic absorption of metallic silver () (Vijayaraghavan et al. Citation2012). However, the presence of weak signal of Al along with strong silver peak could be due to the presence of biomolecules that are attached to the surface of TA-AgNPs, as the detection limit of silver is high compared to all other trace elements present in the sample. XRD analysis of the AgNPs revealed of intense peaks corresponding to (111), (200), (220) and (311) Bragg’s reflection based on the fcc structure of AgNPs (). The formation of nanoparticles is indicated by broadening of Bragg’s peaks. The data obtained in the analysis of AgNPs were matched with the database of Joint Committee on Powder Diffraction Standards (JCPDS) file No. 04–0783.
Figure 3. XRD spectrum of TA-AgNPs synthesized using T. arjuna bark extract.
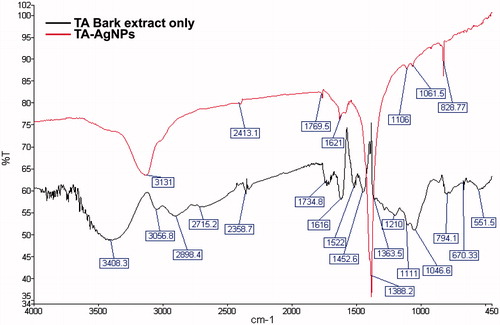
FT-IR spectroscopy analysis was carried out to determine the potential role of functional groups of biomolecules in TA-extract in the process of reduction of silver ions and stabilization of AgNPs. Representative FT-IR spectra of TA extract and TA-AgNPs obtained are displayed in the . The AgNPs showed major peaks at 3131 cm−1 (OH stretching), 1621 cm−1 (N–H bend), 1106 cm−1 (C–N stretching) and 828 cm−1 (C–Cl stretching) which corresponds to the involvement of carboxylic acids, primary amines, aliphatic amines and alkyl halides of the biomolecules with significant changes in the spectra compared to that of extract spectra as observed in . Therefore, from the reported absorbance spectra it is suggested that the characteristic peak at 1621 cm−1 and 1106 cm−1 denotes the stronger ability of proteins as a capping agent that provides stability and prevents agglomeration. Thus, the reduction of silver ions are assisted by the polyphenols, phenolic acids and proteins of the extract which was in concordance with several other reported studies (Zayed et al. Citation2012).
Figure 4. FT-IR spectra of T. arjuna bark extract (TA bark extract only) and TA-AgNPs.
Optimization of silver nanoparticles preparation
Effect of reaction time
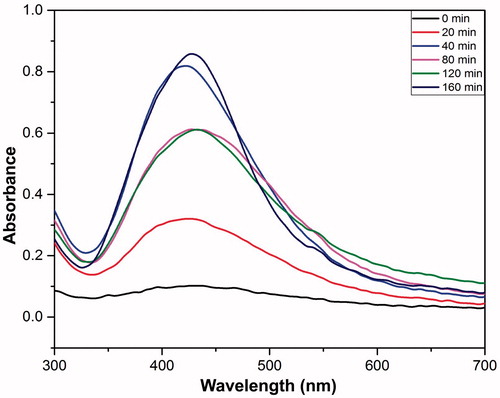
The absorption spectrum of TA-AgNPs was obtained at different reaction time points with T. arjuna (). After reaction for 40 min, the absorption peak was found to be around 430 nm. Difference in the absorption peak of the nanoparticles was observed at different time points, i.e., 0, 20, 40, 80, 120, 160 min, wherein 40 min was taken as the optimum time for the synthesis as no color change was observed beyond this time point. This suggests the completion of the reduction reaction by the reducing agents present in the extract and henceforth the growth of silver nanoparticles ().
Figure 5. UV-vis spectra of TA-AgNPs synthesized using 1 mM silver nitrate solution at different time intervals.
Effect of temperature
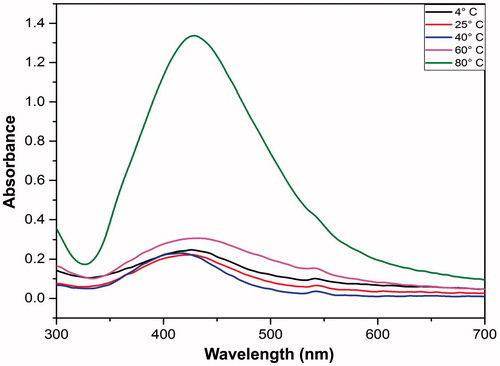
Another physiological factor, i.e., temperature has been reported to affect the synthesis of AgNPs. Xia et al., reported change in shape and size of nanoparticles at 160 °C, while Jiang et al., synthesized silver nanoplate at room temperature (Jiang et al. Citation2011). In another study, 60 °C was used as an optimized temperature to synthesize nanowires. Herein, we investigated different temperatures from 4 °C to 80 °C, AgNPs were found to be synthesized at 80 °C. The absorption was observed to be minimal at all the temperature except 80 °C (). At room temperature (i.e., 25 °C) the reduction of AgNO3 was slower and the color change took 40 min while at 80 °C the color change appeared in 10 min. The maximum SPR peak was observed at 80 °C and was quite sharp compared to other temperatures. It could be inferred that the AgNPs formed at higher temperature were smaller in size in contrast to those formed at lower temperatures as the narrow peaks suggests of formation of small size nanoparticles. It has been established that at higher temperatures the reactants are consumed at fast rates leading to formation of small-sized nanoparticles.
Figure 6. UV-vis spectra of TA-AgNPs synthesized at different reaction temperatures.
Effect of silver nitrate concentration
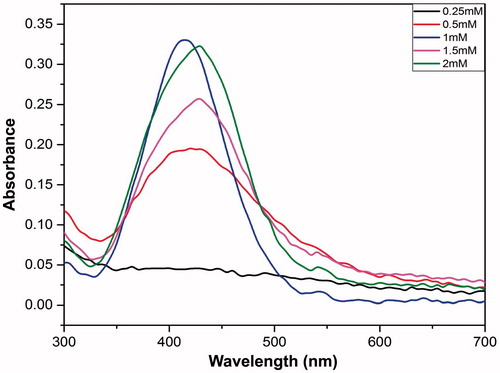
The effect of silver nitrate concentration on the formation of AgNPs was investigated by recording absorption spectra, while varying the concentration of silver nitrate (). As evident from the the absorption increased with the increase in the concentration of silver nitrate from 0.25 mM to 2 mM. This observation was in compliance with, Qu et al. wherein the change in the concentration of silver nitrate was reported to influence the particle size as well as absorbance (Qu et al. Citation2014).
Figure 7. UV-vis spectra of TA-AgNPs synthesized using different concentrations of silver nitrate solution.
Effect of extract fraction
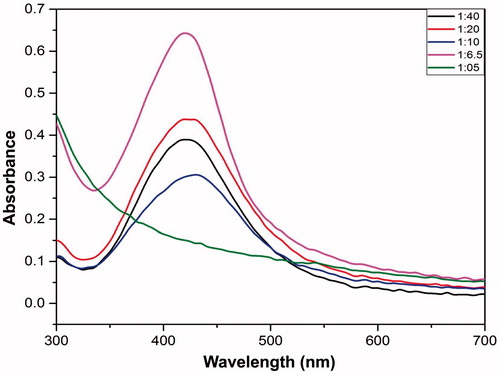
While keeping all the above-mentioned three parameters, i.e. time, temperature and silver nitrate concentration constant the amount of TA extract added to the silver nitrate solution was varied (). The maximal absorbance was observed when the ratio of extract to silver nitrate was predetermined at 1:6.5 (v/v) (). Further, at ratio 1:6.5 (v/v) the peak observed was narrow which can be inferred as the presence of small-sized nanoparticles. The reason behind the broad peak could be understood in terms of stabilizing agents which are provided by the extract along with its reducing property. As there was an increase in the amount of the extract, the constituents therefore present in it stop acting as capping agents beyond a certain limit thus allowing the aggregate formation and hence the broader peak.
Figure 8. UV-vis spectra of TA-AgNPs synthesized at different concentration ratio of T. arjuna bark extract to 1 mM silver nitrate solution.
Determination of the antibacterial activity
AgNPs have been reported to possess antibacterial effect not only against Gram positive and Gram negative bacteria but also against multidrug resistant bacteria (Das et al. XXXX; Kaviya et al. Citation2011; MubarakAli et al. Citation2011). Several mechanisms have been proposed for the antibacterial effect of AgNPs. One of the mechanisms suggested release of reactive oxygen species (ROS) (Nel et al. Citation2009). The AgNPs involves slow oxidation and release of Ag+ ions into the surroundings that makes them ideal biocidal agent (Nel et al. Citation2009). Further, owing to their small size AgNPs are better suited to traverse cell membranes and influence cellular processes (Yu et al. Citation2008). The AgNPs have been observed to exhibit efficient antimicrobial property in contrast with other salts due to their huge surface area, which allows better contact with microorganisms (Rai et al. Citation2009).
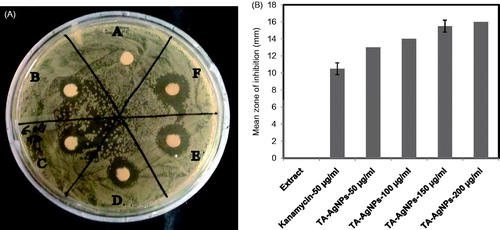
Interestingly, the AgNPs obtained from green synthesis approach have showed better efficacy against microorganisms in comparison to the chemically synthesized AgNPs (MubarakAli et al. Citation2011). In the present study, the antibacterial efficacy of TA-AgNPs was investigated by employing disc diffusion method against the microorganisms, E. coli (). The antibacterial efficacy of TA-AgNPs was tested using different concentrations (50, 100, 150, and 200 μg/ml). The growth of the pathogens was highly repressed at higher concentration of the AgNPs solution (200 μg/ml), strongly suggesting the efficient antibacterial activity of the prepared TA-AgNPs. Furthermore, it was observed that the zone of inhibition concomitantly increased with the increase in the concentration of TA-AgNPs (). Thus, the results obtained from the study clearly depicted that the TA-AgNPs could be deployed as a promising antimicrobial agent.
Figure 9. Representative results of antimicrobial activity of TA-AgNPs using agar disc diffusion assay. (a) Antimicrobial activity of TA-AgNPs against E. coli at different concentration (A) Extract only, (B) Kanamycin 50 μg/ml, (C) TA-AgNPs-50 μg/ml, (D) TA-AgNPs-100 μg/ml, (E) TA-AgNPs-150 μg/ml, (F) TA-AgNPs-200 μg/ml).
Conclusions
In the present study, stable AgNPs of small size were prepared using a simple green synthesis approach employing TA bark extracts. The optimization of concentration of AgNO3, extract along with the temperature and reaction time were taken into account to obtain stable nanoparticles. The synthesized AgNPs at optimum conditions were spherical in shape and small ∼65 nm in size. Water soluble organic compounds in TA bark extracts mainly contributed in bio-reduction of the silver ions and stability of AgNPs. Interestingly, the synthesized TA-AgNPs showed antibacterial activity against the pathogen E. coli even at low concentration (50 μg/ml) which could be attributed to the stability and small size of the TA-AgNPs. Further, the TA-AgNPs exhibited excellent antioxidant potential, as revealed by DPPH assay. Therefore, from the current study it can be elucidated that the TA-AgNPs may contribute its role in biomedicine and therapeutic applications. However, it requires further study to understand its complete mechanism and application in medicine and therapeutics.
Acknowledgements
Qadruddin gratefully acknowledge the help rendered by Ms. Geeta Arya and R. Mankamna Kumari (Central University of Rajsthan) for helping in labwork.
Disclosure statement
The authors report no declaration of interest. The authors alone are responsible for the content and writing of the paper.
Funding
Nidhi Gupta and Surendra Nimesh acknowledge the financial assistance from Science & Engineering Research Board (SERB) (SB/FT/LS-441/2012 and SB/FT/LS-420/2012), Government of India.
References
- Ahmed SSS. 2015. Silver nanoparticles: one pot green synthesis using Terminalia arjuna extract for biological application. J Nanomed Nanotechnol. 4:309.
- Ajitha B, Reddy YA, Reddy PS. 2015. Biosynthesis of silver nanoparticles using Momordica charantia leaf broth: evaluation of their innate antimicrobial and catalytic activities. J Photochem Photobiol B. 146:1–9.
- Akhtar MS, Panwar J, Yun Y-S. 2013. Biogenic synthesis of metallic nanoparticles by plant extracts. ACS Sustainable Chem Eng. 1:591–602.
- Dar MA, Ingle A, Rai M. 2013. Enhanced antimicrobial activity of silver nanoparticles synthesized by Cryphonectria sp. evaluated singly and in combination with antibiotics. Nanomedicine. 9:105–110.
- Das B, Dash SK, Mandal D, Ghosh T, Chattopadhyay S, Tripathy S, et al. Green synthesized silver nanoparticles destroy multidrug resistant bacteria via reactive oxygen species mediated membrane damage. Arab J Chem. doi:10.1016/j.arabjc.2015.08.008.
- Dwivedi P, Narvi SS, Tewari RP. 2015. Overwhelming antibacterial activity by Terminalia arjuna aided herbal Ag/CS-PVC: nanocomposite for overcoming biomaterials associated infections. Adv Sci Eng Med. 7:82–90.
- Evanoff DD, Jr., Chumanov G. 2005. Synthesis and optical properties of silver nanoparticles and arrays. Chemphyschem. 6:1221–1231.
- Gopinath K, Venkatesh KS, Ilangovan R, Sankaranarayanan K, Arumugam A. 2013. Green synthesis of gold nanoparticles from leaf extract of Terminalia arjuna, for the enhanced mitotic cell division and pollen germination activity. Ind Crops Prod. 50:737–742.
- Iravani S, Zolfaghari B. 2013. Green synthesis of silver nanoparticles using Pinus eldarica bark extract. Biomed Res Int. 2013:639725.
- Jiang X, Chen W, Chen C, Xiong S, Yu A. 2011. Role of temperature in the growth of silver nanoparticles through a synergetic reduction approach. Nanoscale Res Lett. 6:32.
- Kaviya S, Santhanalakshmi J, Viswanathan B, Muthumary J, Srinivasan K. 2011. Biosynthesis of silver nanoparticles using citrus sinensis peel extract and its antibacterial activity. Spectrochim Acta A Mol Biomol Spectrosc. 79:594–598.
- Lee PC, Meisel D. 1982. Adsorption and surface-enhanced Raman of dyes on silver and gold sols. J Phys Chem. 86:3391–3395.
- Lokina S, Stephen A, Kaviyarasan V, Arulvasu C, Narayanan V. 2014. Cytotoxicity and antimicrobial activities of green synthesized silver nanoparticles. Eur J Med Chem. 76:256–263.
- Lukman AI, Gong B, Marjo CE, Roessner U, Harris AT. 2011. Facile synthesis, stabilization, and anti-bacterial performance of discrete Ag nanoparticles using Medicago sativa seed exudates. J Colloid Interface Sci. 353:433–444.
- Makarov VV, Love AJ, Sinitsyna OV, Makarova SS, Yaminsky IV, Taliansky ME, Kalinina NO. 2014. “Green” nanotechnologies: synthesis of metal nanoparticles using plants. Acta Naturae. 6:35–44.
- Mie G. 1908. Contributions to the optics of turbid media, particularly of colloidal metal solutions. Ann D Phys. 25:377–413.
- Moran JF, Klucas RV, Grayer RJ, Abian J, Becana M. 1997. Complexes of iron with phenolic compounds from soybean nodules and other legume tissues: prooxidant and antioxidant properties. Free Radic Biol Med. 22:861–870.
- MubarakAli D, Thajuddin N, Jeganathan K, Gunasekaran M. 2011. Plant extract mediated synthesis of silver and gold nanoparticles and its antibacterial activity against clinically isolated pathogens. Colloids Surf B Biointerfaces. 85:360–365.
- Narayanan KB, Sakthivel N. 2011. Extracellular synthesis of silver nanoparticles using the leaf extract of Coleus amboinicus Lour. Mater Res Bull. 46:1708–1713.
- Narayanan KB, Sakthivel N. 2013. Biosynthesis of silver nanoparticles by phytopathogen Xanthomonas oryzae pv. oryzae strain BXO8. J Microbiol Biotechnol. 23:1287–1292.
- Nel AE, Madler L, Velegol D, Xia T, Hoek EMV, Somasundaran P, et al. 2009. Understanding biophysicochemical interactions at the nano-bio interface. Nat Mater. 8:543–557.
- Poulose S, Panda T, Nair PP, Theodore T. 2014. Biosynthesis of silver nanoparticles. J Nanosci Nanotechnol. 14:2038–2049.
- Qu D, Sun W, Chen Y, Zhou J, Liu C. 2014. Synthesis and in vitro antineoplastic evaluation of silver nanoparticles mediated by Agrimoniae herba extract. Int J Nanomedicine. 9:1871–1882.
- Rai M, Yadav A, Gade A. 2009. Silver nanoparticles as a new generation of antimicrobials. Biotechnol Adv. 27:76–83.
- Roy N, Gaur A, Jain A, Bhattacharya S, Rani V. 2013. Green synthesis of silver nanoparticles: an approach to overcome toxicity. Environ Toxicol Pharmacol. 36:807–812.
- Salkar RA, Jeevanandam P, T. Aruna S, Koltypin Y, Gedanken A. 1999. The sonochemical preparation of amorphous silver nanoparticles. J Mater Chem. 9:1333–1335.
- Sathishkumar M, Sneha K, Won SW, Cho CW, Kim S, Yun YS. 2009. Cinnamon zeylanicum bark extract and powder mediated green synthesis of nano-crystalline silver particles and its bactericidal activity. Colloids Surf B Biointerfaces. 73:332–338.
- Seth S, Dua P, Maulik SK. 2013. Potential benefits of Terminalia arjuna in cardiovascular disease. J Prevent Cardiol. 3:428–432.
- Simakin AV, Voronov VV, Kirichenko NA, Shafeev GA. 2004. Nanoparticles produced by laser ablation of solids in liquid environment. Appl Phys A. 79:1127–1132.
- Singh P, Kim YJ, Wang C, Mathiyalagan R, Yang DC. 2015a. The development of a green approach for the biosynthesis of silver and gold nanoparticles by using Panax ginseng root extract, and their biological applications. Artif Cells Nanomed Biotechnol. 44:1150–1157.
- Singh P, Kim YJ, Wang C, Mathiyalagan R, Yang DC. 2015b. Weissella oryzae DC6-facilitated green synthesis of silver nanoparticles and their antimicrobial potential. Artif Cells Nanomed Biotechnol. Epub 2015/07/28.
- Thakkar KN, Mhatre SS, Parikh RY. 2010. Biological synthesis of metallic nanoparticles. Nanomedicine. 6:257–262. Epub 2009/07/21.
- Vijayaraghavan K, Nalini SPK, Prakash NU, Madhankumar D. 2012. Biomimetic synthesis of AgNPs by aqueous extract of Syzygium aromaticum. Mater Lett. 75:33–35.
- Xia Y, Halas NJ. 2005. Shape-controlled synthesis and surface plasmonic properties of metallic nanostructures. MRS Bull. 30:338–348.
- Yallappa S, Manjanna J. 2014. Biological evaluation of silver nanoparticles obtained from T. arjuna bark extract as both reducing and capping agent. J Cluster Sci 25:1449–1462.
- Yang Y, Matsubara S, Xiong L, Hayakawa T, Nogami M. 2007. Solvothermal synthesis of multiple shapes of silver nanoparticles and their SERS properties. J Phys Chem C. 111:9095–9104.
- Yu AK, Kudrinskiy AA, Olenin AY, Lisichkin GV. 2008. Synthesis and properties of silver nanoparticles: advances and prospects. Russ Chem Rev. 77:233.
- Zayed MF, Eisa WH, Shabaka AA. 2012. Malva parviflora extract assisted green synthesis of silver nanoparticles. Spectrochim Acta A Mol Biomol Spectrosc. 98:423–428.