
Abstract
We investigate the encapsulation of bovine serum albumin (BSA) in chemical-treated and chitosan-coated yeast cells, Saccharomyces cerevisiae (S. cerevisiae), for the controlled release of BSA. The chemical treatment can sufficiently enlarge the small-sized cell-wall cavities and/or break the integrity for the entrance of BSA to the interior of yeast cells, and the additional chitosan coating can well prevent the rapid release of encapsulated BSA from the yeast-derived microcapsules. The sodium hydroxide pretreated S. cerevisiae gives a maximum encapsulation yield of (10.1 ± 0.2)% for BSA. An additional coating of S. cerevisiae with chitosan can reduce the initial burst release of BSA and extend the release period from 24 h in the chitosan-free case to 48 h in phosphate buffer at pH 7.4. The prepared microcapsules can well keep the shapes and sizes of yeast cells and thus show uniform sizes of 3.85 ± 0.81 μm. The encapsulated BSA well retains its pristine ultraviolet spectroscopic and chromatographic behaviors. The present microencapsulation protocol has the advantages of convenient and mild operation, high encapsulation efficiency, and organic solvent-free nature, which is of reference value for establishing high-performance controllable biomacromolecule-delivery systems.
Introduction
The oral delivery of most therapeutic biomacromolecules is usually not effective because the bioavailability is typically less than 1%. This fact can be mainly attributed to the poor membrane permeability, large molecular weight (MW), and pre-systemic enzymatic degradation of biomacromolecules (Hamman et al. Citation2005). Encapsulation of biomacromolecules with polymers can efficiently protect them from enzymatic and pH degradation, control their release and promote their absorption by gastrointestinal cells (O'Hagan et al. Citation1991). Polymer-derived microcapsules with appropriate sizes can be absorbed by the endocytosis of M cells within the epithelium of Peyer’s patches, then enter the blood circulation via thoracic duct through the lymphatic system. Thus, the first-pass liver effect can be mostly eliminated (Desai et al. Citation1996, Mahato et al. Citation2003, Shakweh et al. Citation2004). However, the initial release (burst) is frequently reported in conventional microcapsules (Huang and Brazel Citation2001, Luan et al. Citation2006). In many cases, the too high undesirable initial release would be a therapeutical waste of drug and even cause toxicity problems, and thus the initial release should be controlled properly. The porosity of the microcapsules, the higher drug loading and the release of drug located close to the surface of microcapsules are reported to be the main reasons that cause burst (Herrmann and Bodmeier Citation1995, Luan et al. Citation2006, Wang et al. Citation2002), while changing the microstructure by surface coating can help to reduce the burst release to some extent (Wheatley et al. Citation1991).
Saccharomyces cerevisiae (S. cerevisiae) is regarded as a potential perfect natural capsular material (Bishop et al. Citation1998, Nelson et al. Citation2006). It offers several advantages as compared with conventional polymer-based wall materials. These advantages include good permeability for polar and apolar small molecules, relatively constant and homogenous size, robust backbone against drastic treatments, and facile operation in aqueous encapsulation of target molecules. Besides, yeast can promote the absorption of biomacromolecules by intestinal cells through modulating the epithelial tight junctions in a reversible dose- and time-dependent manner (Fuller et al. Citation2007). S. cerevisiae cells have been successfully used as biocompatible and biodegradable containers for the encapsulation of a variety of hydrophobic small molecules since 1970s (Bishop et al. Citation1998, Nelson et al. Citation2006, Normand et al. Citation2005, Paramera et al. Citation2011, Shank Citation1977, Shi et al. Citation2008). It is reported that the yeast-based encapsulation is essentially a passive diffusion process and shows a MW threshold of 760 Da (Ciamponi et al. Citation2012, Kilcher et al. Citation2008). Thus, the encapsulation of biomacromolecules by native yeast cells should be hardly possible.
The external densely packed mannoprotein layer and the membrane of yeast cells are generally considered as the major permeability barriers to the permeating molecules, and the internal glucan layer with pores as large as ca. 20–60 nm is usually well permeable (Kreger and Kopecka Citation1975). To improve the permeability, a controllable treatment of the external mannoprotein layer and the plasma membrane of yeast cells can be applied to enlarge the pore size or destroy the integrity (De Nobel et al. Citation1989, Shi et al. Citation2007, Zlotnik et al. Citation1984). In previous studies, the typical protocols of yeast cell treatment for improving the permeability include surfactant treatment, salt treatment, chemical reduction, complexation, acidic, and alkaline treatments (Brzobohaty and Kovac Citation1986, De Nobel et al. Citation1989, Valentin et al. Citation1984, Zlotnik et al. Citation1984). In our opinion, such controllable treatments of yeast cells will offer valuable opportunities to prepare yeast-derived microcapsules of biomacromolecules for efficient oral delivery of therapeutic biomacromolecules. However, to our knowledge, encapsulation of biomacromolecules by mildly treated yeast cells has not been examined to date.
Chitosan is considered as a safe encapsulation wall material for the oral drug delivery systems. It possesses excellent mucoadhesion due to the electrostatic affinity between the positively charged primary amino groups and the negatively charged substructures of mucus in the gastrointestinal tract. This mucoadhesive property of chitosan can improve the drug bioavailability, by enhancing the mucosal permeation, thereby prolonging the drug adsorption time and increasing the half time of drug clearance (Benediktsdóttir et al. Citation2014, Cheng et al. Citation2010). However, to our knowledge, chitosan has not been used as a coating outer-layer of treated yeast cells for improving the yeast-based encapsulation and controlling the release of target molecules to date.
Herein, by using bovine serum albumin (BSA) as a representative biomacromolecule, chemical treated and then chitosan-coated yeast cells, S. cerevisiae, are used to encapsulate BSA for its controlled release. We study chemical treatments of yeast cells by eight chemicals, NaCl, HCl, NaOH, cetyltrimethylammonium bromide (CTAB), sodium dodecyl sulfate (SDS), Tween-80, dithiothreitol (DTT), and EDTA. NaOH-pretreated S. cerevisiae is found to give maximum encapsulation yield of BSA. The BSA-loaded microcapsule is further coated by an outer chitosan layer to reduce the initial release of BSA. The in vitro release profile and the surface characteristics of the microcapsules are also examined.
Methods
Materials
All the materials for yeast culture were purchased from Dingguo Biochemical Ltd. (Beijing, China). The yeast strain used in this study was S. cerevisiae (ATCC code 9804) and incubated with a procedure reported previously (Shi et al. Citation2010). Chitosan (degree of deacetylation 90%, MW 15 kD) was obtained from Kayon Biological Technol. Crop. (Shanghai, China) BSA was purchased from Sigma. Chemicals used for HPLC analysis were HPLC grade while other chemicals were analytical grade and were supplied by Shanghai Chemicals Reagent Factory (Shanghai, China). Double-distilled water was used throughout the experiments.
Chemical treatments of yeast cells
The chemical treatments were carried out by the method adapted from our previous work (Shi et al. Citation2010). The obtained fresh yeast cells were divided into identical aliquots. One of them was used as a native untreated control, which was immediately stored in a refrigerator until lyophilized together with the chemically treated yeast cells. The other aliquots were suspended in water at a mass ratio of 1:2 and subjected to treatments with one of the following chemicals, NaCl, HCl, NaOH, CTAB, SDS, Tween-80, DTT, and EDTA, except that one of them was used as an autolysis control without any of these chemicals. The concentration effects of the chemicals on the encapsulation yield of BSA were also examined, as detailed later in the corresponding Figures. All chemical treatments were conducted with agitation of 150 rpm at 40 oC for 40 h and then at 85 oC for 15 min to inactivate the endogenous enzymes of yeast. After centrifugation and discarding the liquid supernatants, the obtained solids were washed at least five times with water to remove the lysate and then lyophilized for future uses. The proteins in the supernatants were measured by the Coomassie brilliant blue method, and reported as mg BSA per g wet yeast cells to quantify the proteins released from the yeast cells during the chemical treatment (n = 3).
Encapsulation of BSA in chemical pretreated yeast cells
The preparation of yeast-derived microcapsules was based on the technique adapted from Bishop et al. (Citation1998). In brief, 100 mg native or pretreated yeasts were added to 2 ml water containing 30 mg BSA (pH 4.9, adjusted by adding 1 M HCl and NaOH). After 24 h incubation at 37 oC and then centrifugation for 10 min at 12 000 rpm (Himac CR 21G, Hitachi InC., Hitachinaka, Japan), the solids were washed with 0.5 ml water and then lyophilized to finally obtain the yeast-derived BSA microcapsules.
Chitosan coating of yeast-derived BSA microcapsules
Yeast-derived BSA microcapsules with outer-layer chitosan coating were also prepared. Two milliliters of chitosan solution (0.4% w/v in 1% v/v acetic acid solution, adjusted to pH 4.9 with 1 M HCl and NaOH) was added dropwise into 2 ml of the yeast-derived BSA microcapsules (2% NaOH treated yeast) and incubated at 37 oC for 12 h. Afterwards, 1 ml of sodium tripolyphosphate (TPP) solution (0.1% w/v, adjusted to pH 4.9 with 1 M HCl and NaOH) was added dropwise and incubated for 30 min. After standing for 12 h at 4 oC and centrifugation for 10 min at 12 000 rpm (Himac CR 21G, Hitachi InC., Hitachinaka, Japan), the solids were washed thrice with 0.5 ml TPP (0.01% w/v, adjusted to pH 4.9 with 1 M HCl and NaOH) and then lyophilized to yield yeast-derived BSA microcapsules with outer-layer chitosan coating, i.e. chitosan-coated yeast-derived BSA microcapsules.
Determination of the encapsulated BSA and encapsulation yield
Twenty milligrams of yeast-derived BSA microcapsules with or without chitosan coating were first extracted twice with 2 ml of 0.1 M HCl to dissolve the coated chitosan, and then extracted four times with 8 ml of 10 mM phosphate buffer (pH 7.4) at ambient temperature. The total BSA was determined by HPLC (Shimadzu LC-10ATvp, consisting of a binary pump and diode array detector). The YWC protein column (150 mm ×4.6 mm, 5 μm) kept at 40 oC was used under isocratic conditions with a mobile phase consisting of water: acetonitrile: trifluoroacetic acid (440: 550: 1, v/v/v). The flow rate was 1.0 ml/min and the volume of injection was 20 μl. Quantification was performed at 223 nm by external standard calibration. Also, the spectrum of yeast encapsulated BSA was recorded between 210 and 320 nm. The encapsulation yield is calculated as the ratio of the mass of BSA encapsulated to the mass of the microcapsules, and the result is reported as milligram BSA per 100 mg of microcapsules (%) (n = 3).
Fourier-transform infrared (FT-IR) spectroscopy
The FT-IR spectra (KBr pellet) of BSA, yeast, chitosan, microcapsules with or without chitosan coating, physical mixture of BSA, yeast, and chitosan were collected on a WQF-310 FT-IR spectrometer (with S/N 3000:1 from 900 cm−1 to 1000 cm−1 and S/N 10 000:1 from 2200 cm−1 to 2100 cm−1, Ray Leigh Inc., Beijing, China) from 4000 cm−1 to 400 cm−1 at a resolution of 4 cm−1 by a DTGS detector. For reliable sample comparison, all the BSA-involved samples of the pellets were the mixtures of 2 mg BSA and 200 mg KBr. The FT-IR spectra were smoothened and peaks of CO2 (2403–2272 cm−1) have been replaced with a smooth trend. To minimize the baseline variability, the collected transmission spectra were transformed to absorption spectra, followed by a second-order derivative transformation (15 cm−1 gap) to enhance clarity of spectral features and to improve spectral resolution.
Morphology observation and size distribution
The chitosan-coated yeast-derived BSA microcapsules were deposited on double stick tape, gold coated, and studied with a scanning electron microscope (Tescan MIRA3 LMU, Czech) operated at an acceleration voltage of 20 kV. The microcapsules size was measured by imaging through an optical microscope (Motic BA 400, Xiamen, China) and analysed with Image J software (National Institutes of Health, Bethesda, MD). Approximately 500 counts of particles were used to calculate the diameter.
Zeta potential
The zeta potential of the chitosan-coated yeast-derived BSA microcapsules was analysed by Laser Dopper anemometry using a Malvern Zetasizer Nano ZS90 (Malvern Instruments, UK) for determining the electrophoretic mobility. Samples were dispersed in water and placed in the electrophoretic cell where a potential of sample was analysed in triplicate.
BET measurements
The pore structure distribution of the native untreated yeast and the 2% NaOH-treated yeast was determined by measuring nitrogen adsorption/desorption at 77K with Quadrasorb SI analyzer (Quantachrome Instruments, Boynton Beach, FL), on the basis of Barrett, Joyner, and Halenda (BJH) method.
In vitro BSA release
In vitro BSA release was determined according to the method adapted from Su et al. (Citation2008) with a slight modification. In brief, 10 mg microcapsules were suspended in 4 ml of simulated gastric fluid without pepsin (pH 1.2) or 10 mM phosphate buffer (pH 7.4). The suspension was incubated in Eppendorf tube at 37 oC in an incubation shaker (150 rpm). Aliquots of the dissolution medium (1.0 ml) were withdrawn at predetermined time intervals and the same volumes of fresh media were added to the suspensions. The collected supernatant was then filtered directly by membrane filter with pore size of 0.45 μm and analysed by the aforementioned HPLC method. The total mass of released BSA in each moment of the experiment is calculated and expressed as a percentage relative to the total BSA in the sample (n = 3).
Statistical analysis
The statistical processing of the data obtained from all studies is implemented by means of dispersion analysis with the SigmaPlot (version 8.0, SPSS Inc., Chicago, IL) software. Data are expressed as mean ± standard deviation (SD). Mean values are compared with Duncan’s multiple range test.
Results
Effects of chemical treatments on the encapsulation yield of BSA
Our results show that BSA cannot be encapsulated into the native untreated yeast cells. In contrast, the aforementioned autolysis treatment of yeast cells can result in a BSA encapsulation yield of (2.48 ± 0.02)%. After the aforementioned chemical treatments of yeast cells, the obtained encapsulation yield of BSA is dependent on the employed chemical, as shown in . The maximum encapsulation yield of BSA is obtained by NaOH treatment, and the encapsulation yield of BSA increases with the increase of NaOH concentration in a double sigmoid trend (). For the increase of NaOH concentration from 0.5 to 1.5% and from 5.0 to 7.0%, the encapsulation yield of BSA also increases significantly (p < 0.05), giving the maximum value of (10.1 ± 0.2)%. However, no significant changes are seen when the NaOH concentration increases from 1.5 to 5.0% and from 7.0 to 9.0% (p > 0.05). A further increase of NaOH concentration to 10% results in a decrease in the encapsulation yield of BSA.
Figure 1. Effect of NaOH treatments on the encapsulation yield of yeast-derived BSA microcapsules. Each value represents mean ± SD (n = 3).
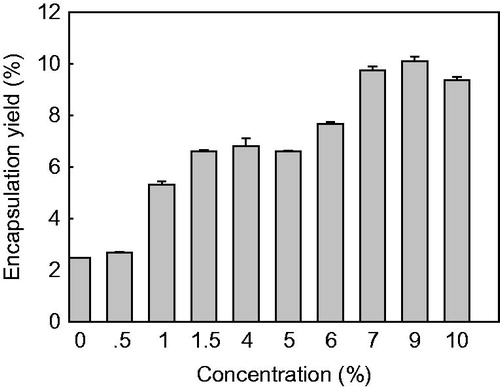
Figure 2. Effect of surfactant treatments on the encapsulation yield of yeast-derived BSA microcapsules. Yeasts were treated with 0% (autolysis), 0.5%, 1.0%, 2.0%, and 3.0% (w/v) of Tween-80, CTAB and SDS, respectively. Note that 2.0% or 3.0% of SDS-pretreated yeast cannot encapsulate BSA effectively; thus, the data is not shown here. Data are given as mean ± SD (n = 3).
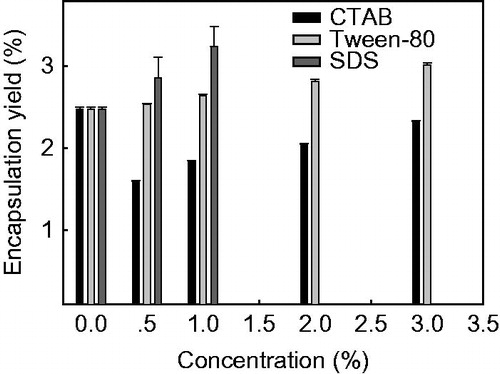
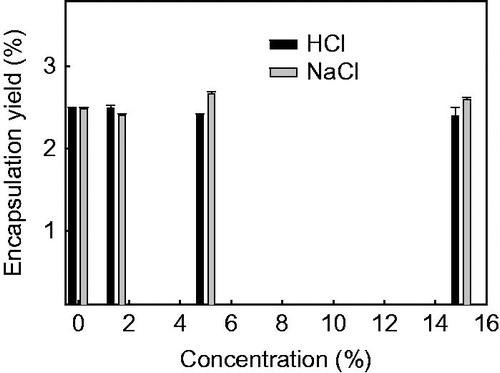
Figure 3. Effect of NaCl and HCl treatments on the encapsulation yield of yeast-derived BSA microcapsules. Yeasts were treated with 0% (autolysis), 1.5%, 5.0% or 15.0% of NaCl (w/v) and HCl (v/v), respectively. Data are given as mean ± SD (n = 3).
As shown in , surfactant treatments of yeast cells give a quite different consequence. Tween-80 treatments show a concentration-dependent increase of BSA encapsulation yield than that of the autolysis control, the maximum encapsulation yield of (3.02 ± 0.02)% is obtained when yeast cells are pre-treated with 3% Tween-80. However, all the CTAB treatments with a concentration from 0.5 to 3% obtain a significant lower (p < 0.05) encapsulation yield of BSA than that of the autolysis control. Treatment of yeast cells with 0.5 or 1% SDS has the similar promoting effect on the encapsulation yield of BSA as that of 3% Tween-80. Nevertheless, increasing the concentration of SDS cannot promote the encapsulation yield of BSA further. On the contrary, 2 or 3% SDS-treatment make the encapsulation of BSA in yeast impossible.
As shown in , no difference (p > 0.05) is observed in the BSA encapsulation yield amongst autolysis control and the chemical pre-treated yeast when exposed to 1.5, 5 or 15% of NaCl and HCl. Besides, treatment of yeast with 100 mM-DTT, 250 mM-EDTA or mixture of 50-mM DTT and 125 mM-EDTA lead to no effective BSA encapsulation.
Characterization of BSA microcapsules
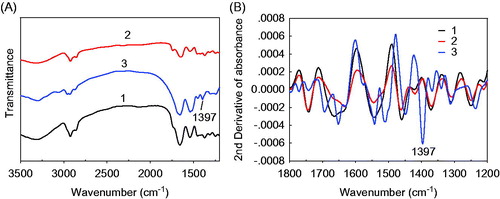
The encapsulation of BSA in yeast-derived microcapsules is confirmed by the FT-IR spectrum and the change of zeta potential. illustrates the FT-IR spectra of yeast-derived BSA microcapsules (curve 1), yeast (curve 2), and BSA (curve 3). To amplify their spectral variations, the second-order derivative FT-IR spectra are illustrated in . As is seen, the symmetric deformation band of –CH3 and –CH2 at 1397 cm−1 of BSA (curve 3) get to be invisible in the yeast-derived BSA microcapsules (curve 1). Besides, the zeta potential of the yeast-derived microcapsules in double-distilled water increases from −4.28 ± 0.04 mV (the 2% NaOH-treated yeast) to −0.48 ± 0.02 mV (the yeast-derived BSA microcapsules). These results indicate that BSA has been encapsulated into the yeast-derived microcapsules successfully.
Figure 4. FT-IR spectra (A) and second-order derivative FT-IR spectra (B) of the yeast-derived BSA microcapsules (1), yeast (2) and BSA (3). Yeasts were treated with 2% NaOH. Offsets of spectra are used for clarity.
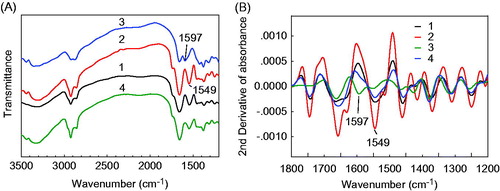
The coating of chitosan in yeast-derived microcapsules was also confirmed by FT-IR spectrum and zeta potential characterizations. The FT-IR spectra and the second-order derivative FT-IR spectra of yeast-derived BSA microcapsules (curve 1), chitosan-coated BSA microcapsules (curve 2), chitosan (curve 3), and physical mixture of BSA, chitosan and yeast (curve 4) are demonstrated in . As is seen, the N–H bending vibration of primary amine of chitosan at 1597 cm−1 (curve 3) has shifted to 1549 cm−1 in the chitosan-coated yeast-derived BSA microcapsules (curve 2). The zeta potential of the yeast-derived BSA microcapsules in double-distilled water is increased from −0.48 ± 0.02 mV to 10.48 ± 0.10 mV after the chitosan coating, and then decreased to 0.58 ± 0.02 mV, when TPP is added as cross-linker.
Figure 5. FT-IR spectra (A) and second-order derivative FT-IR spectra (B) of the yeast-derived BSA microcapsules (1), chitosan-coated yeast-derived BSA microcapsules (2), chitosan (3) and physical mixture of BSA, chitosan and yeast (4). Yeasts were treated with 2.0% NaOH. Offsets of spectra are used for clarity.
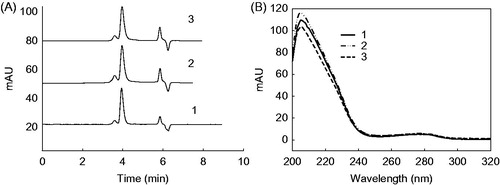
HPLC with a diode array detector (DAD) was used to examine the behaviors of the BSA released from the microcapsules. shows the HPLC chromatogram (A) and UV spectra (B) of the BSA standard and the BSA released from the yeast-derived BSA microcapsules and the chitosan-coated BSA microcapsules. The BSA standard and the BSA released from both of the microcapsules have the same retention time at 3.99 min under the same chromatographic conditions (), and all of them are purity peaks identified by the DAD detector. Besides, the UV spectra of the BSA standard and the released BSA from microcapsules are homology (), each of them had the same absorption maximum at 223 nm and the second maximum absorption peak at 276 nm.
Figure 6. Chromatograms (A) and UV-vis spectra (B) of BSA standard (1), yeast-encapsulated BSA (2) and chitosan-coated yeast-encapsulated BSA (3). Yeasts were treated with 2.0% NaOH.
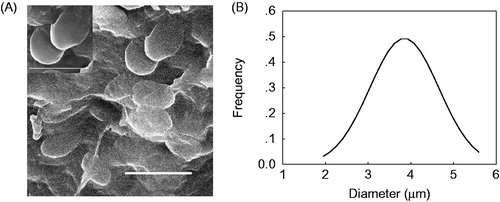
In addition, SEM was used to study the morphologies of the chitosan-coated yeast-derived BSA microcapsules. As shown in , the chitosan-coated yeast-derived BSA microcapsules have a relatively smooth morphology (), with an average diameter of 3.85 ± 0.81 μm ().
Figure 7. SEM image (A) and diameter distribution (B, Mean = 3.85, SD = 0.81) of chitosan-coated yeast-derived BSA microcapsules. Yeasts were treated with 2.0% NaOH.
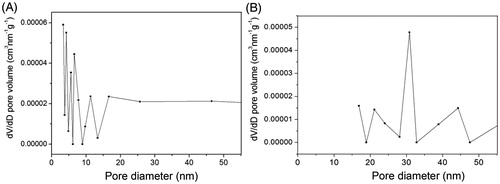
Finally, BET was used to study the pore structure changes of yeast induced by 2% NaOH treatment. As shown in , the most probable diameter increased from 4.3 nm (the native-untreated yeast) to 30.6 nm after the 2% NaOH treatment.
Figure 8. Pore structure distribution of the native untreated yeasts (A) and the 2% NaOH-treated yeasts (B).
In vitro BSA release behavior
The in vitro BSA release behaviors of the yeast-derived microcapsules with or without chitosan coating in simulated gastric fluid and in 10 mM phosphate buffer (pH 7.4) are presented in . In , both the yeast-derived BSA microcapsules and the chitosan-coated yeast-derived BSA microcapsules exhibit a sustained BSA release behavior in 10 mM phosphate buffer (pH 7.4). The cumulative amounts of BSA released from the yeast-derived BSA microcapsules increase slowly from (79.3 ± 0.5)% (within 0.5 h) to (84.1 ± 0.9)% (within 10 h), and then increase quickly to the maximum amount of (98.4 ± 2.1)% within 24 h. After the chitosan coating, the cumulative amounts of BSA released from the chitosan-coated yeast-derived BSA microcapsules first gradually increase from (65.7 ± 2.6)% (within 0.5 h) to (72.7 ± 1.3)% (within 10 h), then increase quickly to the maximum amount of (98.26 ± 1.7)% within 48 h.
Figure 9. BSA release behaviors of chitosan-coated yeast-derived BSA microcapsules (•) and yeast-derived BSA microcapsules (○) in simulated gastric fluid (A) and in 10 mM phosphate buffer (pH 7.4) (B). Yeasts were treated with 2% NaOH. Each value represents mean ± SD (n = 3). Insets are the magnified release profiles within the first 4 h.
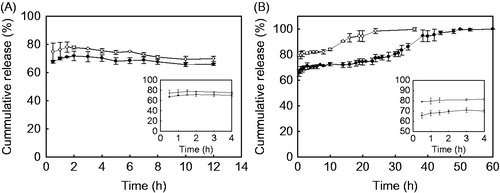
However, in , both of the BSA microcapsules do not show a sustained release profile in simulated gastric fluid. Within the initial 0.5 h, the BSA released from both of the BSA microcapsules reaches the maximum amount of (74.7 ± 6.2)% for the yeast-derived BSA microcapsules and (67.6 ± 1.0)% for the chitosan-coated microcapsules. After that, no significant (p < 0.05) BSA release is seen from both of the as-prepared microcapsules.
Discussion
The relative small pores of the external yeast cell wall and the plasma membrane could be the barriers impeding the penetration of macromolecules such as BSA into the native untreated yeast cells (Zlotnik et al. Citation1984). Thus, yeast cells should be pre-treated properly to increase the pore size of the external yeast cell wall and/or break the integrity of cell membrane before used for the encapsulation of biomacromolecules.
Eight chemical treatments were investigated to improve the yeast permeability for the encapsulation of BSA. As shown in , the NaOH treatments have greatly improved the encapsulating properties of the yeast-derived capsular materials for BSA. A maximum encapsulation yield of BSA, as high as (10.1 ± 0.2)%, can be obtained by the 9% NaOH-treated S. cerevisiae. The possible reason might be attributed to the release of the two main classes of proteins, GPI-dependent cell wall proteins and Pir proteins, from the yeast cell wall polysaccharides. It is reported that both of the proteins can probably couple to the skeleton of yeast cell, β-1,3-glucan, through an alkali-sensitive linkage (Kapteyn et al. Citation2001, Klis et al. Citation2002). When yeast cells are treated with NaOH appropriately, the release of GPI or Pir proteins make the outer yeast cell wall more porous, and thus, lead to the BSA molecule diffuse through the cell wall more freely. This hypothesis can be verified by the change of yeast pore structure and the released protein induced by the 2% NaOH treatment. As seen from , the pore size distribution of the yeast changed greatly after the 2% NaOH treatment, with the most probable pore diameter increasing from 4.3 nm (the native-untreated yeast) to 30.6 nm (the 2% NaOH-treated yeast). Besides, the yeast cells lose 11.2 mg proteins/g wet yeast cell and 47.0% of the total weight during the 2% NaOH treatment, and this lose of proteins and cell weight increase with the concentration of NaOH used for the treatment. More than 70.6% of yeast mass is lost after the 9% NaOH treatment. With regard to the cell debris observed during the NaOH treatments, the decrease in encapsulation yield of BSA when NaOH concentration exceeded 9%, is likely attributed to the excessive structure disruption of yeast cell wall. Since the encapsulation of yeast-derived microcapsules is essentially a passive diffusion process, there should be a compromise between the penetration and reservation of BSA molecules inside the yeast-derived microcapsules for an effective encapsulation. From the cost-effective point of view, 2% NaOH treatment is appropriate for the BSA encapsulation with a BSA encapsulation yield of (6.16 ± 0.10)% (61.6 ± 1.0 mg/g microcapsules) and (5.19 ± 0.22)% (51.9 ± 2.2 mg/g microcapsules) after coated by 0.4% chitosan.
As shown in , the increased encapsulation yield of BSA resulted from the surfactant-treated yeast is probably attributed to the damage of plasma membrane by the cationic, nonionic and low concentration of anionic surfactant pretreatment (Brzobohaty and Kovac Citation1986). As the yeast cell wall can be removed completely by boiling in 2% SDS (Valentin et al. Citation1984), the reason why the 2% or 3% SDS-treated yeast cannot be used for BSA encapsulation is likely due to the thorough removal of yeast cell wall. This demonstrates that the effective encapsulation of BSA in yeast-derived microcapsules should be a synergistic action of cell wall and membrane, while surfactant pretreatment is not an applicable procedure for yeast to encapsulate biomacromolecules.
As shown in , an encapsulation yield of (2.48 ± 0.02)% has been obtained when BSA is encapsulated with the autolysis yeasts. This can be attributed to the improved permeability of yeast due to the self digestion of cell content. NaCl and HCl are typical chemicals used as plasmolyser to promote yeast autolysis. The effective promoted encapsulating properties of plasmolyser-treated yeast for hydrophobic flavor molecules with MW below 300 Da, and water-soluble chlorogenic acid are reported in literatures (Dardelle et al. Citation2007, Normand et al. Citation2005, Shi et al. Citation2007). However, similar curcumin encapsulation yield of plasmolysed yeast exposed to 10, 20, 30 or 40% of NaCl is also obtained by Paramera et al. (Citation2011). In the case of biomacromolecules encapsulation, our results () show that there is no further promoting effect resulting from the addition of NaCl and HCl over the autolysis control on the encapsulation yield of BSA. This is in accordance with the data reported by De Nobel et al. (Citation1989) that after treatment of the yeast with 1 M LiCl, no significant increase of FTIC-dextran (FD70, MW 70 kDa) uptake was noted. Thus, the relative mild treatment of yeast with NaCl and HCl, as plasmolyser might be applicable to promote the encapsulation of small molecules, but not effective for the encapsulation of biomacromolecules. However, we found that neither the 100 mM-DTT, 250 mM-EDTA nor the mixture of 50 mM-DTT and 125 mM-EDTA-treated yeasts can be used as an effective wall material for the encapsulation of BSA. This finding is different from the result of De Nobel et al. (Citation1989) that the treatment of yeast with 100-mM DTT or 250-mM EDTA has resulted in a comparable increase of uptake of (FD70), probably due to the different MW, hydrophobicity, and shapes of BSA and FD70.
The prepared yeast-derived BSA microcapsules were further coated by chitosan to control the BSA release. FT-IR spectroscopy, HPLC with DAD, zeta potential, SEM, and BET analysis were used to characterize both of the yeast-derived BSA microcapsules and the chitosan-coated yeast-derived BSA microcapsules.
The encapsulation of BSA in yeast-derived microcapsules and the followed chitosan coating are confirmed by the FT-IR spectrum and the changes of zeta potential values. As seen in , the disappearance of the FT-IR bands of BSA such as the symmetric deformation band of –CH3 and –CH2 at 1397 cm−1 (curve 3) indicate that BSA has been encapsulated into the yeast-derived microcapsules successfully (curve 1). This encapsulation of BSA can be further evidenced by the increase of zeta potential results from the BSA loading. The zeta potential of the 2% NaOH-treated yeast has increased from −4.28 ± 0.04 mV to −0.48 ± 0.02 mV (the yeast-derived BSA microcapsules). As the BSA on the surface of yeast-derived microcapsules has been washed away after the preparation of microcapsule, the increased zeta potential value could be ascribed to the release of loaded BSA from the yeast-derived microcapsules.
As presented in , the N–H bending vibration of primary amine in free chitosan (curve 3) is shifted to 1549 cm−1 after the coating procedure on the yeast-derived BSA microcapsules (curve 2). This shift of FT-IR band might be ascribed to the ionic cross-linking of amine group with TPP as cross-linker (Lee et al. Citation2011). The shift of N-H bending vibration indicates that a chitosan-TPP membrane has been coated onto the surface of yeast-derived BSA microcapsules successfully. The zeta potential change of the yeast-derived BSA microcapsules before and after chitosan coating also verifies the chitosan coating. These changes of zeta potential might be explained by the positive charge of chitosan and the negative charge of TPP under the pH condition of double-distilled water. The addition of positively charged chitosan can reduce the negative charge of yeast-derived BSA microcapsules, and result in a positive zeta potential of 10.48 ± 0.10 mV, while the subsequently added negatively charged TPP make it reduced to 0.58 ± 0.02 mV. The above results confirm that chitosan and TPP have been incorporated on the surface of yeast-derived BSA microcapsules.
The effects of the yeast-derived encapsulation and the chitosan coating on the BSA behaviors are investigated by comparing the ultraviolet spectroscopic and chromatographic behaviors of BSA released from both of the microcapsules with or without chitosan coating. As shown in , the same HPLC retention time and UV spectra between the BSA standard and the released BSA indicate that no chemical changes have taken place during the encapsulation and coating procedure. Thus, this encapsulation and chitosan-coating profile is of great advantage for the delivery of biomacromolecules over other systems with harsh processes.
The effectiveness of chitosan coating on the controlled release of BSA is evaluated by the in vitro BSA release profile and the SEM analysis. As illustrated in , both of the BSA microcapsules exhibit a significant sustained BSA release behavior in phosphate buffer (pH 7.4), but failed to show a sustained release profile in simulated gastric fluid. After the chitosan coating, the burst release of BSA decreases significantly (p < 0.05) under both of the pH conditions. Besides, the chitosan coating prolong the BSA release period from 24 h (the yeast-derived microcapsules) to 48 h (the chitosan-coated yeast-derived microcapsules) in phosphate buffer (pH 7.4). These phenomena might be attributed to the two following reasons. Firstly, the swelling property of yeast in water make the yeast-derived microcapsules can be referred as a porous hydrogel, the diffusion of loaded BSA to the surface of microcapsules during the freeze drying lead to an uneven distribution of BSA in the microcapsules. This surface BSA may release immediately upon activation in a release medium. Thus, the rapid release of surface BSA and the relative longer time needed for the swelling of chitosan to form an efficient membrane than that of the yeast swelling might be one of the main possible factors responsible for the high burst release of BSA. On the other hand, the chitosan membrane might be reinforced under acidic condition owing to the more positive charge of chitosan, while broken down due to the deionization of chitosan amine groups when the pH is higher than the dissociation constant of chitosan (Lee et al. Citation2011). This stronger membrane might prevent the loaded BSA in the interior of yeast-derived capsule from releasing, hence no further BSA release is observed when the BSA close the surface release finished within 0.5 h in simulated gastric fluid (). However, the membrane disassembly may lead to a much more complete release of BSA from the chitosan-coated yeast-derived microcapsules at pH 7.4 than that of in simulated gastric fluid (). Thus, these synergistic actions result in a prolonged release period of BSA from chitosan-coated yeast-derived microcapsules under physiological conditions.
The surface characteristics of microcapsules might be important factors in practical application (Desai et al. Citation1996, Mahato et al. Citation2003). In contrast to the usually obtained polymer-derived microcapsules, which demonstrate a shrunken and wrinkled appearance, the prepared chitosan-coated yeast-derived BSA microcapsules have a relatively smoother surface without small pinholes (). After chitosan coating, investigations from FT-IR spectra () and zeta potential changes revealed that a membrane of chitosan-TPP has been formed on the surfaces of the yeast-derived BSA microcapsules. Thus, the chitosan coating has provided an additional barrier membrane, and lead to the release rate of BSA from the chitosan-coated yeast-derived microcapsules decreased obviously (p < 0.05) ().
Conclusions
In summary, an effective wall material suitable for BSA encapsulation has been obtained by 2% NaOH treatment of yeast cells. The burst release of BSA can be partly reduced by the chitosan coating of yeast-derived microcapsules, which show a burst release of 0.5 h and a sustained release of 48 h. The microcapsules have attractive features in narrow particle size distribution and minor loss of protein bioactivity. This study would be helpful to provide an interesting potential for the controlled oral delivery of biomacromolecules, especially for those therapeutic biomacromolecules which both of the burst and sustained release are needed to stimulate effective treatments. Further studies are in progress, including modulating the burst release by optimizing the chitosan-coating variables, such as molecular weight alteration and improvement of the chitosan solubility.
Acknowledgements
The authors would like to thank Prof. Qingji Xie in Hunan Normal University for helpful suggestions.
Disclosure statement
The authors report no conflict of interest. The authors alone are responsible for the content and writing of this article.
References
- Benediktsdóttir BE, Baldursson Ó, Másson M. 2014. Challenges in evaluation of chitosan and trimethylated chitosan (TMC) as mucosal permeation enhancers: from synthesis to in vitro application. J Control Release. 173:18–31.
- Bishop JRP, Nelson G, Lamb J. 1998. Microencapsulation in yeast cells. J Microencapsul. 15:761–773.
- Brzobohaty B, Kovac L. 1986. Factors enhancing genetic transformation of intact yeast cells modify cell wall porosity. J Gen Microbiol. 132:3089–3093.
- Cheng SY, Yuen MCW, Lam PL, Gambari R, Wong RSM, Cheng GYM, et al. 2010. Synthesis, characterization and preliminary analysis of in vivo biological activity of chitosan/celecoxib microcapsules. Bioorg Med Chem Lett. 20:4147–4151.
- Ciamponi F, Duckham C, Tirelli N. 2012. Yeast cells as microcapsules. Analytical tools and process variables in the encapsulation of hydrophobes in S. cerevisiae. Appl Microbiol Biotechnol. 95:1445–1456.
- Dardelle G, Normand V, Steenhoudt M, Bouquerand PE, Chevalier M, Baumgartner P. 2007. Flavour-encapsulation and flavour-release performances of a commercial yeast-based delivery system. Food Hyd. 21:953–960.
- De Nobel JG, Dijkers C, Hooijberg E, Klis FM. 1989. Increased cell wall porosity in Saccharomyces cerevisiae after treatment with dithiothreitol or EDTA. J Gen Microbiol. 135:2077–2084.
- Desai MP, Labhasetwar V, Amidon GL, Levy RJ. 1996. Gastrointestinal uptake of biodegradable microparticles: effect of particle size. Pharm Res. 13:1838–1845.
- Fuller E, Duckham C, Wood E. 2007. Disruption of epithelial tight junctions by yeast enhances the paracellular delivery of a model protein. Pharm Res. 24:37–47.
- Hamman JH, Enslin GM, Kotze AF. 2005. Oral delivery of peptide drugs: barriers and developments. BioDrugs. 19:165–177.
- Herrmann J, Bodmeier R. 1995. The effect of particle microstructure on the somatostatin release from poly(lactide) microspheres prepared by a W/O/W solvent evaporation method. J Control Release. 36:63–71.
- Huang X, Brazel CS. 2001. On the importance and mechanisms of burst release in matrix-controlled drug delivery systems. J Control Release. 73:121–136.
- Kapteyn JC, Ter Riet B, Vink E, Blad S, De Nobel H, Van Den Ende H, Klis FM. 2001. Low external pH induces HOG1-dependent changes in the organization of the Saccharomyces cerevisiae cell wall. Mol Microbiol. 39:469–479.
- Kilcher G, Delneri D, Duckham C, Tirelli N. 2008. Probing (macro) molecular transport through cell walls. Faraday Discuss. 139:199–212.
- Klis FM, Mol P, Hellingwerf K, Brul S. 2002. Dynamics of cell wall structure in Saccharomyces cerevisiae. FEMS Microbiol Rev. 26:239–256.
- Kreger DR, Kopecka M. 1975. On the nature and formation of the fibrillar nets produced by protoplasts of Saccharomyces cerevisiae in liquid media: an electronmicroscopic, X-ray diffraction and chemical study. J Gen Microbiol. 92:207–220.
- Lee H, Jeong C, Ghafoor K, Cho S, Park J. 2011. Oral delivery of insulin using chitosan capsules cross-linked with phytic acid. Biomed Mater Eng. 21:25–36.
- Luan X, Skupin M, Siepmann J, Bodmeier R. 2006. Key parameters affecting the initial release (burst) and encapsulation efficiency of peptide-containing poly(lactide-co-glycolide) microparticles. Int J Pharm. 324:168–175.
- Mahato RI, Narang AS, Thoma L, Miller DD. 2003. Emerging trends in oral delivery of peptide and protein drugs. Crit Rev Ther Drug Carrier Syst. 20:153–214.
- Nelson G, Duckham SC, Crothers MED. 2006. Microencapsulation in yeast cells and applications in drug delivery. In: Svenson S, Ed. Polymeric Drug Delivery I: Particulate Drug Carriers. Washington (DC): American Chemical Society, pp. 268–281.
- Normand V, Dardelle G, Bouquerand PE, Nicolas L, Johnston DJ. 2005. Flavor encapsulation in yeasts: limonene used as a model system for characterization of the release mechanism. J Agric Food Chem. 53:7532–7543.
- O'Hagan DT, Rahman D, McGee JP, Jeffery H, Davies MC, Williams P, Davis SS, Challacombe SJ. 1991. Biodegradable microparticles as controlled release antigen delivery systems. Immunology. 73:239–242.
- Paramera EI, Konteles SJ, Karathanos VT. 2011. Microencapsulation of curcumin in cells of Saccharomyces cerevisiae. Food Chem. 125:892–902.
- Shakweh M, Ponchel G, Fattal E. 2004. Particle uptake by Peyer's patches: a pathway for drug and vaccine delivery. Expert Opin Drug Deliv. 1:141–163.
- Shank JL. 1977. Encapsulation process utilizing microorganisms and products produced thereby. Patent US 4001480.
- Shi G, Rao L, Xie Q, Li J, Li B, Xiong X. 2010. Characterization of yeast cells as a microencapsulation wall material by Fourier transform infrared spectroscopy. Vib Spectrosc. 53:289–295.
- Shi G, Rao L, Yu H, Xiang H, Pen G, Long S, Yang C. 2007. Yeast-cell-based microencapsulation of chlorogenic acid as a water-soluble antioxidant. J Food Eng. 80:1060–1067.
- Shi G, Rao L, Yu H, Xiang H, Yang H, Ji R. 2008. Stabilization and encapsulation of photosensitive resveratrol within yeast cell. Int J Pharm. 349:83–93.
- Su YL, Fu ZY, Zhang JY, Wang WM, Wang H, Wang YC, Zhang QJ. 2008. Microencapsulation of Radix salvia miltiorrhiza nanoparticles by spray-drying. Powder Technol. 184:114–121.
- Valentin E, Herrero E, Pastor FIJ, Sentandreu R. 1984. Solubilization and analysis of mannoproteins from the cell wall of Saccharomyces cerevisiae. J Gen Microbiol. 130:1419–1428.
- Wang J, Wang BM, Schwendeman SP. 2002. Characterization of the initial burst release of a model peptide from poly(d,l-lactide-co-glycolide) microspheres. J Control Release. 82:289–307.
- Wheatley MA, Chang M, Park E, Langer R. 1991. Coated alginate microspheres: factors influencing the controlled delivery of macromolecules. J Appl Polym Sci. 43:2123–2135.
- Zlotnik H, Fernandez MP, Bowers B, Cabib E. 1984. Saccharomyces cerevisiae mannoproteins form an external cell wall layer that determines wall porosity. J Bacteriol. 159:1018–1026.