
Abstract
As one of the leading reason in morbidity and death in the world, atherosclerosis is usually associated with vessel stenosis, ulceration, and inflammatory cell infiltration. However, the formation mechanism of atheroma plaque is unknown. In this research, we have used bioinformatics tools to identify 118 differential expression genes from a GEO dataset. Besides, we also revealed KYNU as a crucial gene in atheroma plaque development.
Introduction
Atherosclerosis is a kind of systemic disease which is cling to occur in initiation of carotid and carotid bifurcation. Most of the patients exhibit asymptomatic carotid stenosis (Barnett et al. Citation1998, Golledge et al. Citation2000, Spence Citation2013). Contrast-enhanced ultrasound (CEUS) usually was used as a routine application in the diagnosis of carotid atherosclerotic plaque (Varetto et al. Citation2015). Fifty percent to 79% atherosclerotic patients with an asymptomatic carotid stenosis have thinned or ruptured fibrous (Takaya et al. Citation2006). Meanwhile, even asymptomatic plaque can be converted to vulnerable plaque conditionally (Narula et al. Citation2013).
Nevertheless, the exact formation mechanism of a plaque remains unknown. Some classic features are poor forecasters of the risk of thromboembolism, and consequently, 80% of patients going through carotid endarterectomy are unnecessarily exposed to surgical risks (Ijas et al. Citation2007, Kappelle Citation2002). Normal atheroma plaque has the ability to lead expression changes of many molecular processes, including inflammation, angiogenesis, lipid accumulation, and embolization. Thus much better biomarkers for the carotid atheroma plaque development are required.
Gene microarray technology can be used to investigate global mRNA expression to identify mRNA populations that exhibit differential regulation in disease processes, thus providing important clues to the underlying molecular pathology. In this research, we use bioinformatics tools to analyze microarray data from carotid plaque and normal tissue samples. The aim of our study is to discover the key genes which are able to improve our understanding of carotid atheroma plaque formation and exhibit potential direction in the study of atherosclerosis.
Methods
Microarray data
The microarray data of GSE43292 was downloaded from Gene Expression Omnibus (GEO) which was based on the platform of Affymetrix Human Gene 1.0 ST Array. The dataset was deposited by Ayari and Bricca (Citation2013). The dataset included 64 samples collected from 32 hypertensive patients who had suffered carotid endarterectomy. One sample of the atheroma plaque contains core and shoulders of the plaque, and one sample contains distant macroscopically intact tissue from each patient.
Data preprocessing
The original CEL data were imported into R and affy package (Gautier et al. Citation2004) was used for the background correction and normalization. After the microarray data normalizing and standardization, we identified some differentially expressed genes (DEGs) between atheroma plaque and macroscopically intact tissue. DEGs between 32 atheroma plaque and 32 macroscopically intact tissue were identified by using Limma from R (Diboun et al. Citation2006). The P values ≤0.05 and |log2fold change|>1 were chosen as cut-off standards.
Functional annotation and pathway analysis of DEGs
Database for Annotation, Visualization, and Integrated Discovery (DAVID) is a web-accessible program that incorporates functional genomic annotations with intuitive graphical summaries (Dennis et al. Citation2003). Listings of gene or protein identifiers are quickly annotated and summed up according to shared categorical data for Gene Ontology (GO), protein domain, and biochemical pathway membership. In order to make a comprehensive evaluation of relevant pathway or biological procedures in atheroma plaque, GO and pathway enrichment analyses on DEGs were carried out through the DAVID online tools with threshold of P values ≤0.05. The PATHWAYS were chosen according to the node degree, as a result the network was visualized by Cytoscape (Chung et al. Citation2014).
Analysis of protein interaction networks
PPI networks were created utilizing the STRING (search tool for the retrieval of interacting genes/proteins; http://string.embl.de/) database (Szklarczyk et al. Citation2011) and the significant cut-off threshold of combined score >0.4. The proteins in the PPI network act as the “nodes”, each protein–protein interaction pairwise is represented by an undirected link and the degree of a node represents the number of interactions of a protein. One of the most extremely connected nodes (high degree) is taken into consideration as the “hub”, which was chosen out for additional analysis.
Results
Analysis of DEGs
By comparing microarray data in macroscopically intact tissue with atheroma plaque, overall 118 DEGs were recognized, consisting of 60 up-regulated genes as well as 58 down-regulated with threshold of FDR (false discovery rate) ≤ 0.05 and |log2fold change|>1 (). The most significant 10 up-regulated genes were CNTN1, TPH1, CNTN4, CASQ2, MYOCD, FHL5, NBLA00301, CARTPT, CARTPT, and ATRNL1. The most significant 10 down-regulated genes were IGKC, IGHD, IGHV4–59, IBSP, CD36, MMP9, MMP7, IGKV3D-11, IGKC, IGJ, and FABP4 ().
Figure 1. The DEGs in atheroma plaque samples compared with those in normal samples. Black plots represent down- and up-regulated genes, red dots were significant differentially expressed genes.
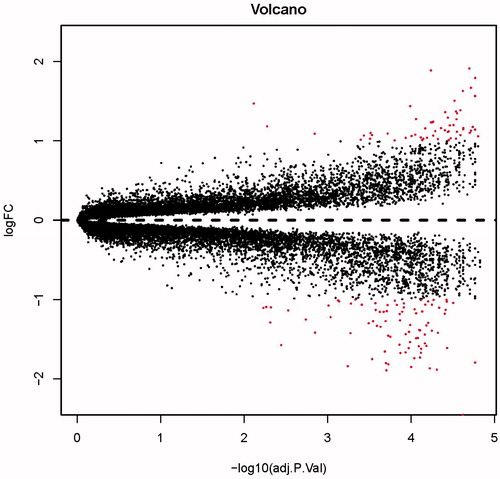
Table 1. Most significant up and down-regulated genes in atheroma plaque.
Function and pathway enrichment analysis
The gene listing of these 118 DEGs was sent to the DAVID website to perform GO evaluation under p ≤ 0.05. The leading 13 enriched GO terms are specified in and we can discover that the majority of them were associated with biological process (11/13), such as immune response (17.8% DEGs were enriched with p = 2.81E − 08 and FDR = 4.41E − 05), regulation of system process (11.0% DEGs were enriched with p = 1.15E − 06 and FDR = 0.0018), cell adhesion (15.3% DEGs were enriched with p = 4.14E − 06 and FDR = 0.0065), and biological adhesion (15.3% DEGs were enriched with p = 4.22E − 06 and FDR = 0.0066). Besides biological process, GO terms associated with molecular function and cellular compartment were also found, such as antigen binding (6.78% DEGs were enriched with p = 3.93E − 08 and FDR = 5.08E − 05) and extracellular region (30.5% DEGs were enriched with p = 1.19E − 07 and FDR = 1.44E − 04). KEGG pathway evaluation revealed the comparable outcomes (), with the most significant KEGG term of Tryptophan metabolism (3.39%; p = 6.45E − 05, FDR = 0.0043), cAMP signaling pathway (5.93%; p = 9.45E − 05, FDR = 0.0043), long-term potentiation (3.39%; p = 0.00046, FDR = 0.014), and Circadian entrainment (3.39%; p = 0.0018, FDR = 0.041). There were three overlapped DEGs in the four KEGG pathways and six GO enriched terms, which could be associated with atheroma plaque: KYNU, NPR1, and RYR2. Kynureninase (KYNU) was classified in immune response pathway when GO analysis was carried out and was classified in Tryptophan metabolism pathway when KEGG analysis was carried out. NPR1 was classified in regulation of system process pathway when GO analysis was carried out and was classified in cAMP signaling pathway when KEGG analysis was carried out. RYR2 was classified in regulation of system process pathway as well as NPR1 when GO analysis was carried out and was classified in Circadian entrainment pathway when KEGG analysis was carried out.
Figure 2. The top 13 most significantly enriched GO terms of DEGs according to the P value.
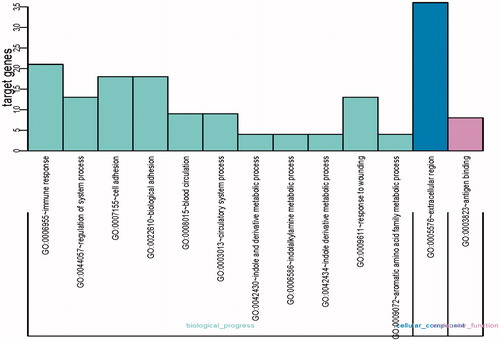
Table 2. The KEGG enriched pathways of the DEGs.
Analysis of PPI network
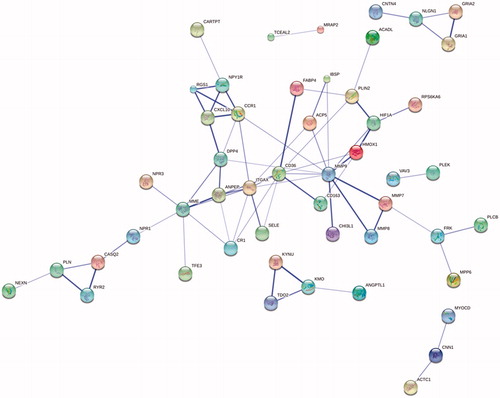
First of all, the 118 DEGs were sent to the STRING website to obtain the PPI information. After that, the PPIs with score lager than 0.4 were chosen to create PPI networks. An overall of 72 pairs of PPI, including 50 DEGs were drawn out from STRING. By imagining these interactions, these genes were generally dispersed in one PPI network (). The leading 20 degree hub nodes in the PPI network were as follows: TDO2, ACP5, CASQ2, FRK, MMP7, NLGN1, PLN, RGS1, CR1, CXCL10, HIF1A, HMOX1, NPY1R, PLIN2, ANPEP, DPP4, CCR1, ITGAX, MME, CD36, and MMP9. These genes (proteins) could play a crucial function in the atheroma plaque formation.
Figure 3. PPI network of DEGs obtained from the STRING database.
Key genes identification of the candidate small molecule drugs and probes
Finally, we identified three most overlapped genes and top two degree hub nodes in the protein interaction network which served as the key genes in atheroma plaque formation (as shown in , KYNU, NPR1 and RYR2; CD36 and MMP9). The ability to penetrate through the cell membrane allows small molecules to interact with target cytoplasm protein inside a cell and disrupts the enzymatic activity of the target protein. So small molecule drugs play a very important role in a variety of illness, including cancer, diabetes, atherosclerosis, Alzheimer disease, and arthritis. In this research, we have identified some potential novel therapeutic targets. Based on this, we tried to discover a drug which can be novel and effective in atheroma plaque formation prevention.
Table 3. Identified key genes in atheroma plaque.
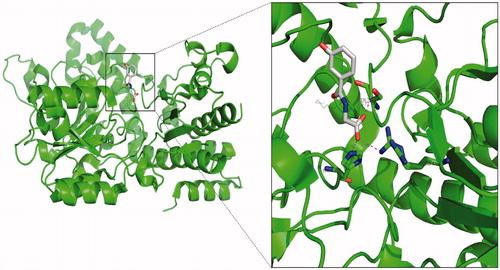
However, we have identified two upregulation genes, NPR1 and RYR2, consisting of thousands of amino acids and lacking structural information. This made us unable to screen it with small molecular drugs by simulation. As a result, the crystal structure of the homo KYNU–3-hydroxyhippuric acid (3HHA) complex was obtained from the RCSB Protein Data Bank (PDB code: 3e9a), as shown in , the inhibitor 3HHA was perpendicularly inserted into the active site of the KYNU probably, the aromatic ring of the 3HHA orientated outside the KYNU, whereas the carboxyl group of the 3HHA interacted with the Ser75, His253, and Arg434, respectively, and the corresponding distance of the carboxyl group of the 3HHA to the Ser75, His253, and Arg434 was 2.77 Å, 2.76 Å, and 2.85 Å, respectively, which are all chosen to the length of the H-bond.
Figure 4. Structural character of kynureninase–3-hydroxyhippuric acid complex.
Discussion
One of the leading reasons of morbidity and death in the world is atherosclerosis. As a systemic inflammatory disease, which develops over several years, atherosclerosis exhibits the character that can be converted into a necrosis center, unstable atheroma plaque from initial abnormal vascular endothelial function, circle monocyte recruitment and accumulation, maturation (Evans et al. Citation2016, Hansson et al. Citation2015, Libby et al. Citation2014). Even in nonsymptomatic people, 28–58% patients get coronary and carotid arteries disease (Baber et al. Citation2015). After rupturing and atherothrombosis, plaque led to myocardial infarction and ischemic stroke (Chung et al. Citation2014). In this research, we downloaded the Microarray data of GSE43292 from GEO, and identified 118 DEGs particularly expressed in unstable plague. We hypothesized that they were likely to be related with atheroma plaque formation. GO and KEGG enrichment analyses, and PPI network analysis were carried out in the 118 DEGs, and some interesting results were discovered.
At last three genes, KYNU, NPR1, and RYR2, were found to be overlapped in two gene lists in this study, and these overlapping genes involve in Tryptophan metabolism and cAMP signaling pathway. There are dozens of evidences which show the relationship between Tryptophan metabolism and cardiovascular disease (Polyzos and Ketelhuth Citation2015). Here, we provided a purpose that KYNU in Tryptophan metabolism is a key gene in pathological process of atheroma plaque formation.
We also identified two genes, CD36 and MMP9, which are top-ranked in connection to the nodes, which may play an important role in atheroma plaque formation. Free CD36 in plasma has been proved associated with vulnerable plaque progression (Li et al. Citation2014). It means our result has clinical significance. Meanwhile, numerous researches have been suggested that MMP9 is a key molecule in atherosclerotic plaques (Jia et al. Citation2016, Rao et al. Citation2014). In this study, we also identified that MMP9 sites are at the central position within the network of atheroma plaque protein–protein interaction. There are bunch of evidences indicating the relationship between RYR2 in cAMP signaling pathway and atheroma plaque formation. But only one report indicated that NPR1 in cAMP signaling pathway knock out mice have increased blood pressure (Alexander et al. Citation2003). It hints that the function of NPR1 in atheroma plaque could be further developed.
Kynureninase is a kind of pyridoxal-5′-phosphate (PLP) dependent enzyme which belongs to subgroup IV of the aminotransferase, the largest family of PLP-dependent enzymes. The subgroup IV of the aminotransferase includes KYNU, serine-pyruvate aminotransferase and nifS (Mehta and Christen Citation1993, Phillips Citation2011). 3-Hydroxyhippuric acid is a kind of acyl glycine which is usually known as a secondary metabolite of fatty acids. However, 3HHA also is a competitive inhibitor of KYNU (Heyes et al. Citation1989). Our research has suggested the importance of the downregulation of KYNU in atheroma plaque. The structural evidence of KYNU–3HHA has been submitted to know how 3HHA was affected as a KYNI inhibitor by Lima et al. (Citation2009). It suggests the risk of high 3HHA level which can lead to a deterioration of atheroma.
In conclusion, an overall 118 DEGs were identified to be associated with pathological atheroma plaque development. Among them, three important genes were further identified by overlapping the results of KEGG and GO analyses. In PPI network, we also identified two crucial genes. These genes could play a crucial function in the formation of atheroma plaque and may act as therapy targets and prognosis indicator.
Disclosure statement
The authors report no conflicts of interest. The authors alone are responsible for the content and writing of this article.
Funding
This work was supported by The National Natural Science Fund, [grant number 81370441].
References
- Barnett HJ, Taylor DW, Eliasziw M, Fox AJ, Ferguson GG, Haynes RB, et al. 1998. Benefit of carotid endarterectomy in patients with symptomatic moderate or severe stenosis. North American Symptomatic Carotid Endarterectomy Trial Collaborators. N Engl J Med. 339:1415–1425.
- Golledge J, Greenhalgh RM, Davies AH. 2000. The symptomatic carotid plaque. Stroke. 31:774–781.
- Spence JD. 2013. Intensive risk factor control in stroke prevention. F1000prime Rep. 5:42.
- Takaya N, Yuan C, Chu B, Saam T, Underhill H, Cai J, et al. 2006. Association between carotid plaque characteristics and subsequent ischemic cerebrovascular events: a prospective assessment with MRI-initial results. Stroke. 37:818–823.
- Narula J, Nakano M, Virmani R, Kolodgie FD, Petersen R, Newcomb R, et al. 2013. Histopathologic characteristics of atherosclerotic coronary disease and implications of the findings for the invasive and noninvasive detection of vulnerable plaques. J Am Coll Cardiol. 61:1041–1051.
- Varetto G, Gibello L, Castagno C, Quaglino S, Ripepi M, Benintende E, et al. 2015. Use of contrast-enhanced ultrasound in carotid atherosclerotic disease: limits and perspectives. BioMed Res Int. 2015:293163.
- Kappelle LJ. 2002. Symptomatic carotid artery stenosis. J Neurol. 249:254–259.
- Ijas P, Nuotio K, Saksi J, Soinne L, Saimanen E, Karjalainen-Lindsberg ML, et al. 2007. Microarray analysis reveals overexpression of CD163 and HO-1 in symptomatic carotid plaques. Arterioscler Thromb Vasc Biol. 27:154–160.
- Ayari H, Bricca G. 2013. Identification of two genes potentially associated in iron-heme homeostasis in human carotid plaque using microarray analysis. J Biosci. 38:311–315.
- Gautier L, Cope L, Bolstad BM, Irizarry RA. 2004. affy – analysis of Affymetrix GeneChip data at the probe level. Bioinformatics. 20:307–315.
- Diboun I, Wernisch L, Orengo CA, Koltzenburg M. 2006. Microarray analysis after RNA amplification can detect pronounced differences in gene expression using limma. BMC Genomics. 7:252.
- Dennis G, Jr., Sherman BT, Hosack DA, Yang J, Gao W, Lane HC, Lempicki RA. 2003. DAVID: Database for Annotation, Visualization, and Integrated Discovery. Genome Biol. 4:P3.
- Szklarczyk D, Franceschini A, Kuhn M, Simonovic M, Roth A, Minguez P, Doerks T, Stark M, Muller J, et al. 2011. The STRING database in 2011: functional interaction networks of proteins, globally integrated and scored. Nucleic Acids Res. 39:D561–D568.
- Libby P, Tabas I, Fredman G, Fisher EA. 2014. Inflammation and its resolution as determinants of acute coronary syndromes. Circ Res. 114:1867–1879.
- Evans NR, Tarkin JM, Chowdhury MM, Warburton EA, Rudd JH. 2016. PET imaging of atherosclerotic disease: advancing plaque assessment from anatomy to pathophysiology. Curr Atheroscler Rep. 18:30.
- Hansson GK, Libby P, Tabas I. 2015. Inflammation and plaque vulnerability. J Intern Med. 278:483–493.
- Baber U, Mehran R, Sartori S, Schoos MM, Sillesen H, Muntendam P, et al. 2015. Prevalence, impact, and predictive value of detecting subclinical coronary and carotid atherosclerosis in asymptomatic adults: the BioImage study. J Am Coll Cardiol. 65:1065–1074.
- Chung JW, Park SH, Kim N, Kim WJ, Park JH, Ko Y, et al. 2014. Trial of ORG 10172 in Acute Stroke Treatment (TOAST) classification and vascular territory of ischemic stroke lesions diagnosed by diffusion-weighted imaging. J Am Heart Assoc. 3:pii: e001119. doi: 10.1161/JAHA.114.001119.
- Polyzos KA, Ketelhuth DF. 2015. The role of the kynurenine pathway of tryptophan metabolism in cardiovascular disease. An emerging field. Hamostaseologie. 35:128–136.
- Li RJ, Yang M, Li JF, Xue L, Chen YG, Chen WQ. 2014. Circulating CD36 and fractalkine levels are associated with vulnerable plaque progression in patients with unstable angina pectoris. Clin Exp Pharmacol Physiol. 41:863–869.
- Rao VH, Kansal V, Stoupa S, Agrawal DK. 2014. MMP-1 and MMP-9 regulate epidermal growth factor-dependent collagen loss in human carotid plaque smooth muscle cells. Physiol Rep. 2:e00224.
- Jia F, Wu C, Chen Z, Lu G, Sun J. 2016. Atorvastatin attenuates atherosclerotic plaque destabilization by inhibiting endoplasmic reticulum stress in hyperhomocysteinemic mice. Mol Med Rep. 13:3574–3580.
- Alexander MR, Knowles JW, Nishikimi T, Maeda N. 2003. Increased atherosclerosis and smooth muscle cell hypertrophy in natriuretic peptide receptor A−/− apolipoprotein E−/− mice. Arterioscler Thromb Vasc Biol. 23:1077–1082.
- Mehta PK, Christen P. 1993. Homology of pyridoxal-5′-phosphate-dependent aminotransferases with the cobC (cobalamin synthesis), nifS (nitrogen fixation), pabC (p-aminobenzoate synthesis) and malY (abolishing endogenous induction of the maltose system) gene products. Eur J Biochem/FEBS. 211:373–376.
- Phillips RS. 2011. Structure, mechanism, and substrate specificity of kynureninase. Biochim Biophys Acta. 1814:1481–1488.
- Heyes MP, Rubinow D, Lane C, Markey SP. 1989. Cerebrospinal fluid quinolinic acid concentrations are increased in acquired immune deficiency syndrome. Ann Neurol. 26:275–277.
- Lima S, Kumar S, Gawandi V, Momany C, Phillips RS. 2009. Crystal structure of the Homo sapiens kynureninase–3-hydroxyhippuric acid inhibitor complex: insights into the molecular basis of kynureninase substrate specificity. J Med Chem. 52:389–396.