
Abstract
We aimed to explore the relationship between miR-126 and glioma. miR-126 was highly expressed in low-grade clinical glioma tissue samples but lowly expressed in high-grade ones (P < .01). A human endogenous miR-126 expression vector was constructed. The migration capacity of cells transfected with the vector significantly decreased (P < .05). Up-regulation of miR-126 suppressed GATA4 protein expression. After transfection, they slightly contracted and became ovally or spherically shaped. F-actin significantly reduced, and microfilaments shortened or disappeared. The number of membrane-penetrating cells significantly decreased (P < .01). miR-126 inhibits the migration and invasion of glioma cells, which may be linked to GATA4 as a target gene.
Introduction
Glioma is the most common primary brain tumor, with an extremely high postoperative recurrence rate. Besides, the degree of malignancy tends to rise with increasing times of surgery and relapse (Hambardzumyan et al. Citation2016). With well-known resistances, chemotherapy and radiotherapy cannot specifically kill glioma cells, probably also producing toxic side effects. After microsurgery, radiotherapy and chemotherapy, the prognosis of glioma patients is still unsatisfactory. Malignant phenotypes appear mainly through abnormal regulation of different mechanisms concerning multi-gene expression and signaling pathways (Preusser et al. Citation2015, Westphal and Lamszus Citation2015), but the intrinsic mechanism has not been clarified.
Aberrant miRNA expression is involved in tumor cell proliferation, apoptosis, invasion and angiogenesis (Bruce et al. Citation2015, Oberg et al. Citation2015). Although the role of microRNA in glioma remains largely unknown, microRNA expression profiling-related studied inspire its diagnosis and treatment. Microarray analysis has shown that the expressions of miR-221, miR-21, miR-125a/b and other six kinds of miRNAs in malignant glioma were significantly up-regulated (Carethers and Jung Citation2015), whereas those of miR-128, miR-181a, miR-181b, miR-181c and other microRNAs abundant in brain tissues were down-regulated (Li et al. Citation2015). Therefore, these microRNAs may be closely related to the onset and progression of glioblastoma multiforme (GBM).miR-126 is rich in the nervous system and widely distributed in the brain, retina and myelin sheath (Manners et al. Citation2016). In recent years, studies on miR-126 mainly involve its promotive effects on neuronal differentiation (Cao et al. Citation2016), and the target genes of miR-126 include a large number of cell cycle-related genes. The expressions of miR-126 and miR-137 are significantly reduced in GBM and anaplastic astrocytoma, but increased 8- to 20-fold in the differentiation of brain tumor stem cells (Dong et al. Citation2016, Tomasetti et al. Citation2016). Transfecting glioma cell lines U251 and SF6969 with miR-126 or miR-137 can inhibit the transition of G1/S phase (Mitash et al. Citation2016), suggesting that miR-126 and miR-137 may be potential targets for GBM treatment.
In undifferentiated P19 cells, miR-126 can damage actin fibers and maintain microtubular stability (Rinnerthaler et al. Citation2016), and it can reduce Cdc42 protein level and affect the intracellular localization of Rac1 through the Rho GTPase family, thereby influencing axonal growth (Li et al. Citation2015). As a microRNA potentially inhibiting the malignant progression of glioma, miR-126 may affect its motility and migration through cytoskeleton-associated proteins. Therefore, the aim of this study was to evaluate the regulatory effects of miR-126 on the motility and migration of glioma cells in order to unravel the underlying molecular mechanism.
We found that the expression level of miR-126 was associated with the clinical grade of glioma. After transfection of glioma cell lines U87 and U251 with human endogenous miR-126 eukaryotic expression vector, miR-126 was up-regulated, and the scratch assay showed that the migration capacity of these cells decreased. The reduced expression of miR-126 in glioma is associated with the malignant progression of skull tumor. GATA4 is related to cytoskeletal reorganization, and increase of its expression can further promote cell motility and migration through phosphorylation of downstream substrates, also being associated with malignant phenotypes (Gittenberger-de et al. Citation2014). To assess the connection between miR-126 and GATA4, we performed the dual luciferase reporter assay. After transfection of the vector, we detected the expressions of GATA4 mRNA and protein by real-time quantitative reverse transcription polymerase chain reaction (RT-PCR) and Western blot respectively to further verify the relationship. In addition, we examined the mRNA expression levels of GATA4 in glioma tissue samples to evaluate its clinical significance. The findings reveal the molecular mechanism of glioma invasion, and provide valuable evidence for clinical treatment.
Experimental
Sample sources
Human glioma tissues were provided by Nanjing Drum Tower Hospital, which had been approved by the ethics committee. All glioma cases were confirmed by histopathological examination, and the pathological diagnosis and classification were based on the WHO Classification of Tumors of the Central Nervous System (Lathia et al. Citation2015): nine cases of Grade I and II and seven cases of Grade III and IV, including 10 males and 6 females, with a median age of 50 years old.
Real-time fluorescent quantitative PCR
The following reagents were purchased from Qiagen (Valencia, CA). Cells (106) were added into 1 ml of Trizol, mixed on a vortex oscillator, placed still at room temperature for 5 min, added about one-fifth volume of chloroform, mixed thoroughly upside down for 1 min, placed still at room temperature for another 5 min, centrifuged at 12,000 rpm for 15 min at 4 °C, added an equal volume of isopropanol, gently mixed by inversion, placed still at room temperature for 10 min, centrifuged again at 12,000 rpm for 10 min at 4 °C, and added 1 ml of 75% ethanol after the supernatant was discarded and an appropriate amount of diethylpyrocarbonate (DEPC)-water was added to dissolve the precipitate sufficiently.
Reaction system (25 μl): 20 μl of fluorescent RT-PCR reaction solution, 1 μl of DNA polymerase, 0.35 μl of reverse transcriptase and 5 μl of template RNA, which were mixed well and centrifuged at 6000 rpm for 10 s. Procedure for real-time fluorescent RT-PCR: reverse transcription at 50 °C for 30 min, pre-denaturation at 95 °C for 3 min, denaturation at 95 °C for 15 s, annealing at 50 °C for 30 s and extension at 72 °C for 30 min, five cycles in total; denaturation at 95 °C for 10 s and annealing at 55 °C for 40 s, 40 cycles in total. The information about the primers has been previously described (Mancari et al. Citation2014, El-Guendy et al. Citation2016).
Construction of human endogenous miR-126 eukaryotic expression vector
U87 and U251 cells (5 × 10⁶ cells at most) (ATCC, Manassas, VA) were collected. Vector construction kits were purchased from Invitrogen Life Technologies Inc. (La Jolla, CA). The cells were centrifuged at 300g for 5 min to remove the culture medium and washed with phosphate-buffered saline (PBS) twice to remove excess liquid. The cell mass was added 200 μl of resuspension solution, incubated with 20 μl of RNase A at room temperature for 2 min, added 20 μl of proteinase K, mixed, added 200 μl of lysis solution C, mixed on a vortex oscillator for 15 s, and placed in water bath at 70 °C for 10 min. Afterwards, 0.5 ml of column preparation solution was added into a miniprep column that was centrifuged at 12,000g for 1 min to discard the filtrate. The cell lysate was added 200 μl of ethanol, mixed on a vortex oscillator for 5–10 s, and transferred to a prepared column that was then centrifuged at 500g for 1 min to discard the filtrate. The binding column was placed into a new 2 ml collection tube, and 0.5 ml of wash solution was added into the column that was thereafter centrifuged at 500g for 1 min to discard the filtrate. Then the binding column was placed into a new 2 ml collection tube, and 0.5 ml of wash solution was added in the column that was centrifuged at 12,000–16,000g for 3 min to discard the filtrate, centrifuged again at 16,000g for 2 min, added 200 μl of elution solution into the center, incubated at room temperature for 10 min and centrifuged at 6500g for 1 min.
The primers were designed according to the pre-miR-126 sequence. PCR system (Qiagen, Valencia, CA): 5 μl of 10 × buffer, 5 μl of dNTPs, 3 μl of MgSO4, 3 μl of primers (5 μM each), 1 μl of template, 1 μl of KOD-plus and complemented with ddH2O to 50 μl; PCR procedure: 2 min at 94 °C, 10 s at 98 °C, 30 s at 55 °C and 60 s at 68 °C (40 cycles in total). 1–5% Agarose gel electrophoresis was performed and the PCR products were recovered. Double enzyme digestion was conducted for the vector pcDNA3.1 and target fragment. Agarose gel extraction kit (Takara, Tokyo, Japan) was used to recover target fragment and large plasmid fragment. The vector pcDNA3.1 was ligated with target fragment, and transformation of the recombinant plasmid was identified and sequenced. Subsequently, monoclonal colonies were picked up and added into the medium for culture overnight, and plasmids were extracted for preliminary identification by enzyme digestion and sequencing (Nanjing GenScript Biotechnology Co., Ltd., Nanjing, China). The sequencing results were analyzed using Chromas2–2 software (Tree Star Inc., Ashland, OR).
Cell culture and transfection
The cells were divided into three groups. Experimental group: cells transfected with miR-126 eukaryotic expression vector; control group: cells transfected with empty plasmid and blank control group: cells treated with a transfection solution containing liposome only. The transfection of miRNA expression vector was carried out according to the instructions of liposome Lipofectamine 2000 kit (Invitrogen, Carlsbad, CA).
Briefly, the cells were passaged on the day before transfection, and the transfection was started after 50–70% confluence was reached. Afterwards, 4 g of pcDNA3.1-miR-126 or control plasmid pcDNA3.1 was added into 250 μl of serum- and antibiotic-free medium (Invitrogen, Carlsbad, CA), and placed at room temperature for 5 min. Then, 10 μl of Lipofectamine 2000 was diluted by 240 μl of serum- and antibiotic-free medium and placed at room temperature for 5 min. The diluted miRNA expression vector or control eukaryotic expression plasmid was mixed with Lipofectamine 2000 and placed at room temperature for 20 min. After the culture medium in six-well plate was discarded, the transfected cells were washed once with PBS and added 1–5 ml of fresh serum-free medium. Subsequently, 500 μl of the transfection mixture was added into a six-well plate and cultured in a 5% CO2 incubator at 37 °C.
Cell scratch assay
The cells were cultured on a dish or plate, and a line was made in the center by a cell scraper after they fused. First, transverse lines were drawn uniformly (every other 0.5–1 cm) by a marker pen (Novartis Pharma AG, Oslo, Switzerland) behind a six-well plate. At least three lines crossed each well. The cells were washed three times with PBS to remove the detached ones, added serum-free medium and cultured in a 5% CO2 incubator at 37 °C. They were sampled at the 0, 6th, 12th and 24th hours and photographed.
Dual luciferase reporter assay
After 3′-UTR of GATA4 was cloned into the sequence of pGL3-encoding firefly luciferase, HEK293 cells were co-transfected with the miR-126 eukaryotic expression vector to analyze the expression of luciferase. HEK293 cells were transfected with the miR-126 expression vector, the luciferase reporter gene vector and the internal reference plasmid respectively. Three control wells were set for each group, and the relative activities of luciferase were reported based on three independent experiments. The transfection was conducted according to the instructions of Liposome Lipofectamine 2000 kit (Invitrogen, Carlsbad, CA). The luciferase activity was detected by a chemiluminescence analyzer.
Western blot
U87 cells in the logarithmic growth phase were diluted and inoculated into a six-well plate for culture. The control and experimental groups were collected and lysed with RIPA (Molecular Research Center, Cincinnati, OH) for protein quantification and Western blot. First, sodium dodecyl sulfate (SDS)-polyacrylamide gel electrophoresis was performed, and protein samples were transferred onto a nitrocellulose membrane (Millipore, MA). After blocking, the membrane was incubated with GATA4 antibody (1:1000) (Abcam, Cambridge, UK) and GAPDH antibody (1:2000) (Wuhan Boster Biological Engineering Co., Ltd., Wuhan, China) at room temperature for 2 h, and then with secondary antibody at room temperature for 1 h. The membrane was finally exposed by chemiluminescence reagent (Millipore, Billerica, MA).
Cytoskeleton staining
After the cells grew on cover glasses, they were washed twice with phosphate buffer (Sinopharm Chemical Reagent Beijing Co., Ltd., Beijing, China), fixed with 3–7% formaldehyde (Sinopharm Chemical Reagent Beijing Co., Ltd.) for 5–10 min, washed with PBS twice, treated with 0.1% Triton X-100 (Amersham, Freiburg, Germany) for 10 min, washed twice again with PBS, stained with 50 μg/ml phalloidin (BD Biosciences, Heidelberg, Germany) for 40 min, washed with PBS twice, added 500 μl of DAPI working solution (Brandel Inc., Gaithersburg, MD) and stained at 37 °C for 15 min. After the staining solution was discarded, they were rinsed once with methanol (Beijing North Institute of Biological Technology, Beijing, China), sealed with glycerin (Beijing North Institute of Biological Technology, Beijing, China), and observed under a confocal microscope (Olympus, Tokyo, Japan).
Transwell invasion assay
Diluted Matrigel gel (50 μl, Pharmacia-Biotech, Uppsala, Sweden) was added into the upper chamber of Transwell plate to completely cover the polycarbonate membrane (Promega Corp., Madison, WI) at 37 °C for 4 h, giving a solid gel. The chamber was rinsed three times using serum-free medium and balanced for 30 min. The cells were digested, pipetted into a single cell suspension after trypsin (Novartis Pharma AG, Oslo, Switzerland) was neutralized by whole culture medium, and collected through low-speed centrifugation. Serum-containing supernatant was removed, and the cells were resuspended by serum-free medium, counted using a hemocytometer (Carl Zeiss, Göttingen, Germany) and resuspended with serum-free medium at a concentration of 1–2 × 10⁶ cells/ml. Two control wells were set for each group. The cell suspension (100 μl) was added into each chamber and 600 μl of DMEM-20% FBS (Invitrogen, Darmstadt, Germany) was added into each well of a 24-well plate outside the chamber. After 18–24 h, culture medium was removed from the upper chamber that was rinsed twice with PBS, and the cells in the chamber were wiped off by a cotton swab dipped with PBS. Then the cells were fixed by 4% paraformaldehyde (Takara, Dalian, China) at room temperature for 10 min, rinsed with PBS three times (5 min each time) and deionized water three times (5 min each time) respectively, and stained with crystal violet (Abbott Laboratories, North Chicago, IL) for 10–20 min. The lower chamber was placed under a high-power microscope (Olympus, Tokyo, Japan) to observe the cells therein. Five visual fields were selected randomly from each chamber for cell counting and statistical analysis.
Statistical analysis
All experiments were repeated three times. The results were expressed as mean ± standard deviation (x± SD) and analyzed by SPSS 16.0. Inter-group comparisons were performed by t-test, and the differences among multiple groups were compared with one-way analysis of variance (ANOVA). P < .05 was considered statistically significant.
Results
Detection results of clinical glioma tissue samples
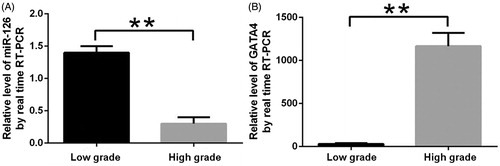
miR-126 was highly expressed in low-grade glioma tissue samples (1.539 ± 0.5768) and lowly expressed in high-grade ones (0.418 ± 0.0303) (). miR-126 expression was significantly down-regulated (P < .01) with increasing glioma grade. In contrast, GATA4 mRNA had low expression level in low-grade glioma samples but high level in high-grade ones (P < .01) ().
Figure 1. miR-126 (A) and GATA4 (B) expressions in different grades of glioma tissue samples. **Compared with low-grade glioma samples, P < .01.
Construction of miRNA-126 expression vector
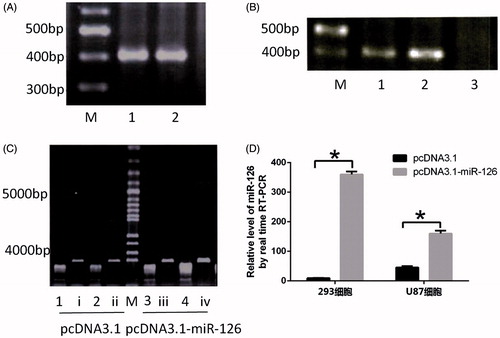
According to a previous literature (Almeida et al. Citation2016), we amplified sequences containing miR-126 gene, with the results shown in . There is a clear specific band at ∼400 bp, indicating that target fragment was obtained by amplification. Given the band at ∼400 bp, the target fragment had been inserted into expression vector pcDNA3.1. As shown in , miR-126 expressions can be detected in the cells transfected with pcDNA3.1 and pcDNA3.1-miR-126, suggesting that miR-126 expression levels significantly increased after transfection with pcDNA3.1-miR-126.
Figure 2. Construction of miRNA-126 expression vector. (A) Amplification of target fragment. M, DNA ladder; 1 and 2, miR-126 precursor; (B) M, DNA ladder; 1 and 2, there are target fragments at ∼400 bp, indicating that the fragment had been inserted into expression vector pcDNA3.1; 3, the fragment had not been inserted into expression vector pcDNA3.1; (C) double digestion results, M, 100 bp plus DNA ladder; i–iv, undigested control plasmids, 1–4, digested plasmids; (D) verification of miR-126 expressions. *P < .05.
Changes in glioma cell motility after transfection with miR-126 eukaryotic expression vector
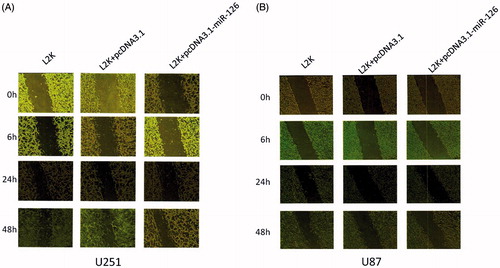
The migration capacity of the cells transfected with human endogenous miR-126 expression vector significantly decreased compared with those of other groups (P < .05) ().
Figure 3. Scratch assay results of (A) U251 cells and (B) U87 cells. L2K group: Blank control group only treated with Lipofectamine 2000; L2K + pcDNA3.1 group: control group treated with Lipofectamine 2000 and vector pcDNA3.1; L2K + pcDNA3.1-miR-126 group: experimental group treated with Lipofectamine 2000 and miR-126 expression vector.
Dual luciferase reporter assay results
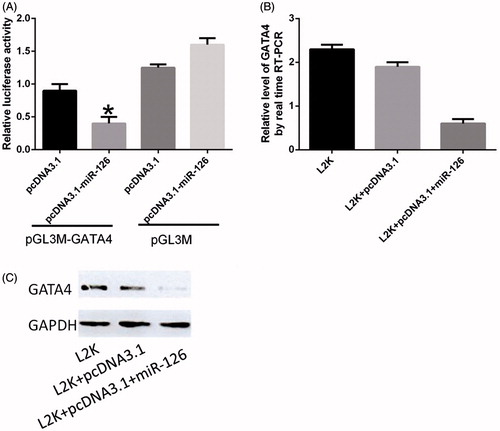
As exhibited in , the luciferase activity of the cells transfected with pGL3M-GATA4 3′-UTR is slightly lower than that of pGL3M-transfected cells. Thus, only transfection with pcDNA3.1-miR-126 could significantly inhibit the expression of luciferase containing pGL3M-GATA4 3′-UTR by ∼50%. RT-PCR exhibited that the GATA4 mRNA expression level of the experimental group was lower than those of untransfected cells and the cells transfected by empty vector. Western blot showed that up-regulation of miR-126 through transfection with pcDNA3.1-miR-126 suppressed the expression of GATA4 protein compared with those of other groups.
Figure 4. Dual luciferase reporter assay results. (A) Activity of luciferase containing pGL3M-GATA4 3′-UTR after miR-126 was inhibited; (B) GATA4 mRNA expression levels after transfection; (C) GATA4 protein expressions in U87 cells. *Compared with pcDNA3.1 group, P < .05.
Cytoskeletal changes and transwell invasion assay results
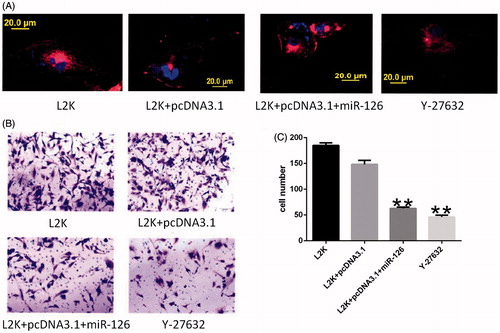
After glioma cells were transfected with the vector or treated by GATA4 inhibitor Y-27632, they slightly contracted (). Compared with the control group, F-actin significantly decreased, and microfilaments shortened or disappeared, most of which emitted short, straight fibrous linear fluorescence that was sparsely arranged. Meanwhile, the cells became ovally or spherically shaped. After pcDNA3.1-miR-126 vector transfection or GATA4 inhibitor treatment, the number of membrane-penetrating glioma cells significantly reduced (P < .01).
Figure 5. (A) Cytoskeletal changes under fluorescence microscope and (B, C) Transwell invasion assay results. Intracellular F-actin is marked by rhodamine-phalloidin; intracellular DNA is marked by DAPI. **Compared with L2K and L2K + pcDNA3.1 groups, P < .01.
Discussion
Recently, miRNA expression has been associated with many types of cancers (Westphal and Lamszus Citation2015). Approximately 50% annotated miRNAs are located at tumor-related fragile sites in the genome. Thus, miRNAs play critical roles in tumor onset as anti-oncogenes or oncogenes.
In this study, miR-126 was highly expressed in low-grade glioma tissue samples and lowly expressed in high-grade ones (P < .01), revealing that miR-126 down-regulation was a crucial molecular event in the malignant progression of glioma. In addition, miR-126 may be a potential molecular marker for glioma grading. After the miR-126 expression vector was successfully constructed, glioma cells were transfected, in which miR-126 expressions were up-regulated. Additionally, the transfected cells had decreased migration ability, so miR-126 exerted inhibitory effects on the cell migration. Probably, miR-126 did so by affecting cytoskeletal remodeling through regulating a certain target gene.
Continuous invasion and metastasis of tumor cells are driven by the contraction of tensile fibers and the extension of actin filaments. Large amounts of actin-binding proteins are involved in the dynamic assembly of actin fibers (Prendiville et al. Citation2014). Since numerous proteins participate in cytoskeletal remodeling, one gene is regulated by several miRNAs and one miRNA can regulate many target genes (Okugawa et al. Citation2015). Of all miR-126 predictive target genes, several are related with cellular DNA damage repair, survival, apoptosis, cell-cycle regulation and cytoskeletal remodeling (Meganathan et al. Citation2015, Rohrig et al. Citation2015). As evidenced by the scratch assay, miR-126 inhibited the motility and migration of glioma cells. Since glioma is clinically typified by high invasion capacity, we herein mainly analyzed cytoskeletal remodeling-related genes and determined the relationship between miR-126 and GATA4 by using the dual luciferase reporter system.
After transfection with miR-126 eukaryotic expression vector, the GATA4 mRNA expression level did not change significantly, but the resulting miR-126 up-regulation suppressed GATA4 protein expression. Possibly, miR-126 regulated GATA4 on the post-transcriptional level. Nevertheless, the detailed mechanism still needs in-depth studies.
We then compared the effects of the expression vector and GATA4 inhibitor Y-27632 on glioma cytoskeleton, cell invasion and motility. After glioma cells were transfected with the vector pcDNA3.1-miR-126 or treated by Y-27632, F-actin significantly decreased, and microfilaments shortened or disappeared, most of which emitted short, straight fibrous linear fluorescence that was sparsely arranged. In the meantime, the cells slightly contracted. Moreover, significantly fewer cells penetrated the membrane in the Transwell assay. Hence, miR-126 apparently inhibited the invasion and migration of glioma cells. We inferred that miR-126 may affect their motility by regulating cytoskeletal reorganization through GATA4. In the future, we will endeavor to study the relationship between miR-126 and GATA4 by screening glioma cells stably transfected with miR-126 eukaryotic expression vector.
In summary, we found that miR-126 and GATA4 genes were closely associated with the invasion and migration of glioma cells. The findings provide theoretical evidence for clarifying the molecular mechanism for glioma invasion and for feasible clinical treatment.
Disclosure statement
The authors report no conflicts of interest. The authors alone are responsible for the content and writing of this article.
References
- Almeida AL, Bernardes MV, Feitosa MR, Peria FM, Tirapelli DP, Rocha JJ, Feres O. 2016. Serological under expression of microRNA-21, microRNA-34a and microRNA-126 in colorectal cancer. Acta Cir Bras. 31:13–18.
- Bruce JP, Yip K, Bratman SV, Ito E, Liu FF. 2015. Nasopharyngeal cancer: molecular landscape. J Clin Oncol. 33:3346–3355.
- Cao Z, Liu C, Xu J, You L, Wang C, Lou W, et al. 2016. Plasma microRNA panels to diagnose pancreatic cancer: results from a multicenter study. Oncotarget. [Epub ahead of print]. doi: 10.18632/oncotarget.9491.
- Carethers JM, Jung BH. 2015. Genetics and genetic biomarkers in sporadic colorectal cancer. Gastroenterology. 149:1177–1190.
- Dong Y, Fu C, Guan H, Zhang Z, Zhou T, Li B. 2016. Prognostic significance of miR-126 in various cancers: a meta-analysis. Onco Targets Ther. 9:2547–2555.
- El-Guendy NM, Helwa R, El-Halawany MS, Abdel RAS, Tantawy AM, Hasan AN, et al. 2016. The liver microRNA expression profiles associated with chronic hepatitis C virus (HCV) genotype-4 infection: a preliminary study. Hepat Mon. 16:e33881.
- Gittenberger-de GA, Calkoen EE, Poelmann RE, Bartelings MM, Jongbloed MR. 2014. Morphogenesis and molecular considerations on congenital cardiac septal defects. Ann Med. 46:640–652.
- Hambardzumyan D, Gutmann DH, Kettenmann H. 2016. The role of microglia and macrophages in glioma maintenance and progression. Nat Neurosci. 19:20–27.
- Lathia JD, Mack SC, Mulkearns-Hubert EE, Valentim CL, Rich JN. 2015. Cancer stem cells in glioblastoma. Genes Dev. 29:1203–1217.
- Li BX, Yu Q, Shi ZL, Li P, Fu S. 2015. Circulating microRNAs in esophageal squamous cell carcinoma: association with locoregional staging and survival. Int J Clin Exp Med. 8:7241–7250.
- Li Y, Yamane D, Masaki T, Lemon SM. 2015. The yin and yang of hepatitis C: synthesis and decay of hepatitis C virus RNA. Nat Rev Microbiol. 13:544–558.
- Mancari R, Portuesi R, Colombo N. 2014. Adult granulosa cell tumours of the ovary. Curr Opin Oncol. 26:536–541.
- Manners MT, Ertel A, Tian Y, Ajit SK. 2016. Genome-wide redistribution of MeCP2 in dorsal root ganglia after peripheral nerve injury. Epigenetics Chromatin. 9:23.
- Meganathan K, Sotiriadou I, Natarajan K, Hescheler J, Sachinidis A. 2015. Signaling molecules, transcription growth factors and other regulators revealed from in-vivo and in-vitro models for the regulation of cardiac development. Int J Cardiol. 183:117–128.
- Mitash N, Agnihotri S, Mittal B, Tiwari S, Mandhani A. 2016. Molecular cystoscopy: micro-RNAs could be a marker for identifying genotypic changes for transitional cell carcinoma of the urinary bladder. Indian J Urol. 32:149–153.
- Oberg K, Modlin IM, De Herder W, Pavel M, Klimstra D, Frilling A, et al. 2015. Consensus on biomarkers for neuroendocrine tumour disease. Lancet Oncol. 16:e435–e446.
- Okugawa Y, Grady WM, Goel A. 2015. Epigenetic alterations in colorectal cancer: emerging biomarkers. Gastroenterology. 149:1204–1225.
- Prendiville T, Jay PY, Pu WT. 2014. Insights into the genetic structure of congenital heart disease from human and murine studies on monogenic disorders. Cold Spring Harb Perspect Med. 4:pii:a013946.
- Preusser M, Lim M, Hafler DA, Reardon DA, Sampson JH. 2015. Prospects of immune checkpoint modulators in the treatment of glioblastoma. Nat Rev Neurol. 11:504–514.
- Rinnerthaler G, Hackl H, Gampenrieder SP, Hamacher F, Hufnagl C, Hauser-Kronberger C, et al. 2016. miR-16-5p is a stably-expressed housekeeping microRNA in breast cancer tissues from primary tumors and from metastatic sites. Int J Mol Sci. 17:pii:E156.
- Rohrig T, Pihlajoki M, Ziegler R, Cochran RS, Schrade A, Schillebeeckx M, et al. 2015. Toying with fate: redirecting the differentiation of adrenocortical progenitor cells into gonadal-like tissue. Mol Cell Endocrinol. 408:165–177.
- Tomasetti M, Amati M, Santarelli L, Neuzil J. 2016. MicroRNA in metabolic re-programming and their role in tumorigenesis. Int J Mol Sci. 17:pii:E754.
- Westphal M, Lamszus K. 2015. Circulating biomarkers for gliomas. Nat Rev Neurol. 11:556–566.