
Abstract
There is a 0.138% incidence of adverse reactions related to blood transfusion. Transfusion-related acute lung injury, immunosuppression, fever, pathogen transmission, and hemolytic transfusion reactions are the most common ones. Synthetic oxygen carriers have been developed to deal with blood shortages and for use in the field where stored blood was not available. They were also designed to be pathogen free, including unknown viruses. In this study, we used Male Golden Syrian Hamsters implemented with a dorsal window chamber to determine how infusion of three different, genetically crosslinked recombinant acellular hemoglobin (rHb) solutions with different oxygen affinities and nitric oxide kinetics affect mean arterial pressure (MAP), heart rate (HR), kidney function, and kidney structure. We found that the administration of all three rHb solutions caused mild hypertension and bradycardia 30 minutes after infusion. However, acute changes in glomerular filtration rate (GFR) were not detected, even though histological analysis was performed 72 hours after treatment revealed some structural changes. All the rHb solutions resulted in hypertension 30 minutes after a 10% topload administration. Regardless of their properties, the presence of acellular Hb causes significant alterations to kidney tissue.
Introduction
Oxygen carriers were first developed to be an alternative to deal with blood shortages and for use in the field where stored blood was not available. If they were good enough, they could also be an alternative to blood transfusion, reducing transfusion-associated inflammation, immunosuppression, and higher mortality (Landers et al. Citation1996, Stramer Citation2007, Tuinman et al. Citation2011). According to a United Kingdom 2014 report, the incidence of adverse reactions is around 0.138% (Bolton-Maggs and Poles Citation2014).
Since Von Stark’s work in 1898, we know the potential nephrotoxic effect of stroma-free hemoglobin (Von Stark Citation1898). Ever since, studies have tried to find a way out for this life-threatening reaction. Crosslinked hemoglobin solutions were developed beginning in the late 1960s to keep the hemoglobin-based oxygen carriers (HBOCs) in the circulation. It turns out that crosslinking also reduces the rate of auto-oxidation and heme loss in dilute solution and decreases the concentration that is filtered by kidney. High concentration of cell-free hemoglobin once filtered by the kidney, would cause renal tubular damage and glomerular filtration rate (GFR) decrease (Bunn and Jandl Citation1968, Chang Citation1971, DeVenuto and Zegna Citation1982, Dudziak and Bonhard Citation1980). Technology has allowed for the design and production of recombinant hemoglobin (rHb) that can be planned with specific characteristics, including O2 affinity (P50–O2) (Dou et al. Citation2002, Huang and Olsen Citation1994, Lemon et al. Citation1988, Varnado et al. Citation2013) and nitric oxide scavenging properties (i.e., the bimolecular rate constant for NO dioxygenation, k′NOD) (Tsai et al. Citation2006, Vermeulen Windsant et al. Citation2014, Yu et al. Citation2008, Citation2009, Citation2010), but only a few studies have shown how these rHbs affect kidney function or kidney structure. Understanding how the solutions characteristics of these rHbs will differentially affect the microcirculation and the kidney (Palmer and Intaglietta Citation2014) will aid in determining the importance of these characteristics in developing this class of Hb-based oxygen carrying (HBOC) therapeutics.
Using rHb produced in bacteria that vary on heme stability, O2 affinity (P50), and k′NOD, we investigated the extent of effect these biochemical attributes have on blood pressure, heart rate (HR), GFR, and kidney morphology in vivo using a hamster model.
Materials and methods
Animal preparation
We followed the National Institutes of Health Guide for the Care and Use of Laboratory Animals for animal handling and care, and the local Animal Care Committee approved the experimental protocol. Male Golden Syrian hamsters (Charles River Laboratories, Boston, MA) were anesthetized (ketamine 200 mg/kg and xylazine 10 mg/kg, i.p.) and fitted with a dorsal skinfold chamber window. The hamster chamber window model is widely used for microvascular studies in the unanesthetized state; the complete surgical technique is described in detail elsewhere (Endrich et al. Citation1980). Despite we did not run any microvascular studies, this window chamber excellently exposed the tissue to measure renal function. Two to four days after window chamber implant, the animal was anesthetized again with the same protocol, and arterial and venous catheters filled with a heparinized saline solution (30 IU/mL) were implanted. Catheters were tunneled under the skin and exteriorized at the dorsal side of the neck, and were securely attached to the window frame. The window chamber was examined 4–6 days after the initial surgery. Only animals passing an established systemic inclusion criteria were entered into the study (Tsai et al. Citation1998).
Inclusion criteria
All animals with body weight (BW) ranging from 50 to 65 g and systemic parameters were in the reference range from previous studies, i.e., HR greater than 340 beats/min, mean arterial pressure (MAP) greater than 80 mmHg and less than 130 mmHg, and hematocrit (Hct) greater than 0.45.
Exclusion criteria
All animals that were lethargic, had tissue with low perfusion, inflammation or edema on window chamber. Animals that did not gain weight after surgeries were also excluded.
Topload
This protocol is used to determine if the test solutions have an impact on kidney function or morphology. It is infused through the venous line 10% of its blood volume without shedding any amount. The estimated blood volume is calculated as 7% of its BW. The infusion rate was 0.1 ml/min, i.v.
rHb Solutions
rHb solutions were gifts from Dr. John S. Olson's laboratory at Rice University, as described in the Acknowledgements section. The solutions contained 4 g rHb/dL in ringer lactate, shipped frozen in the oxygenated-state and contained ≤2 endotoxin units/ml. They were transferred to University of California, San Diego (UCSD) on dry ice and stored in a −80 °C freezer until needed. One hour prior to their infusion into the animal, the solutions were defrosted on the lab bench. The characteristics of the solutions are summarized in . All of the samples contained genetically crosslinked α subunits using a single glycine linker between the C-terminus of one α chain and the N-terminus of the second α chain as described in Looker et al. (Citation1992).
Table 1. Summary of solutions and their characteristics.
rHb0.1 wild-type recombinant hemoglobin with V1M mutations was used to facilitate expression in E. coli and an α-gly-α crosslink to stabilize the hemoglobin tetramer (Looker et al. Citation1992, Varnado et al. Citation2013).
rHb0.1Prov – rHb0.1 with the additional β K82D mutation was used to mimic the naturally occurring Providence hemoglobinopathy. The Providence mutation results in weaker interaction with 2–3 DPG, but increased resistance to oxidative degradation (Bonaventura et al. Citation1976, Moo-Penn et al. Citation1976, Abraham et al. Citation2011, Strader et al., manuscript in preparation).
rHb3011 – This recombinant Hb (rHb3011) is also based on rHb0.1 (V1M mutations in the α-gly-α and β genes) and has a reduced rate of NO scavenging and decreased oxygen affinity because of the additional α(L29F/H58Q) and β(V67F) mutations as previously described (Doherty et al. Citation1998, Olson et al. Citation2004, Varnado et al. Citation2013).
Group distribution
The animals were allocated in each group according to the solution usage: rHb0.1WT (6 animals), rHb0.1Prov (6 animals), rHb3011 (5 animals), and Control (8 animals). Control animals were used to determine a normal range for GFR and kidney morphology. Control group did not receive any test solution or NaCl 0.9%.
Systemic parameters
MAP was tracked continuously during the experimental period, and HR was determined from the pressure trace from carotid catheter (Spectramed Pressure Transducer, Biopac; Santa Barbara, CA). MAP and HR were recorded at baseline and 30 minutes after topload.
Blood samples
Systemic Hct was measured from centrifuged arterial blood samples taken in heparinized capillary tubes (Readacrit Centrifuge, Clay Adams, Division of Becton and Dickinson; Parsippany, NJ). Hemoglobin concentration was measured using total blood and a hand-held photometer (B-Hemoglobin; Hemocue, Sweden). Free plasma hemoglobin was measured from Hct capillary tubes after centrifugation with the same hand-held photometer to determine the concentration of stroma-free hemoglobin. Blood samples were collected at baseline, 30, and 90 minutes.
Kidney function
GFR was estimated by sinistrin labeled with fluorescein-isothiocyanate (FITC-S) (Fresenius Kabi Linz, Austria), a substance that is completely filtered, neither reabsorbed nor secreted by the kidney. The half-life of FITC-S has an inverse relation with GFR and is calculated by a transcutaneous method that records the decay of FITC-S light and determines the slope. This method is valid for plasma concentration (Schreiber et al. Citation2012, Zollner et al. Citation2013). FITC-S was administered (5 mg/100 g b.w., i.v.) and the catheter flushed with 0.1 ml of NaCl 0.9% for every GFR measurement. A low light camera attached to an optical fluorescence microscope under low magnification (4× objective, NA [numerical aperture] 0.13, 17 mm WD [working distance]; Olympus, Central Valley, PA) was used to capture window chamber pictures during measurement, and a plot was made as a function of time. Measurements of fluorescent intensity were analyzed using ImageJ software v1.47 (public domain) (Abramoff et al. Citation2004) to create the decay slope. One phase decay is applied to calculate the FITC-S half-life. The GFR was estimated at three time points: 2, 24, and 72 h after topload. In this study, GFR is reported in arbitrary units rather than in volume per unit time (Schock-Kusch et al. Citation2009, Citation2011), because conversion to absolute GFR would require simultaneous measurement of blood FITC-S levels. Our interest was in the relative change from normal, which we determined in a separate group of 8 animals using the same technique. They were measured in 3 time points, 0, 24, and 72 h and a normal value was estimated as mean ± one standard deviation from these 24 measurements.
Renal tissue analysis
After the last GFR measurement, the animals were anesthetized (ketamine 200 mg/kg and xylazine 10 mg/kg, i.p.), and the left kidney was harvested through a dorsal incision and then sacrificed with thiopental. The kidney was extracted and placed in formaldehyde 4% for at least 3 days, and then the kidneys were included into resin. The slice thickness was 1.5 microns. Tissue preparations were stained with toluidine blue. This method is excellent to visualize the structure (Lacy and Schmidt-Nielsen Citation1979).
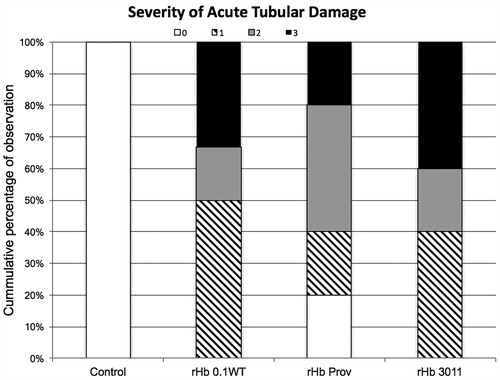
The tissue slices were studied for changes in morphology using a light optical microscope under high magnification (40 × objective; NA 0.7 SW [salt water]; Olympus, Central Valley, PA). Damage was graded: 0 (zero), no visible damage; 1, tubular dilation; 2, tubular necrosis with adjacent structure intact; and 3 when tubular necrosis, total loss of structure with or without neutrophilic infiltration was found. The kidney tissue was graded according to the highest level of damage observed in 18 slices of tissue that were collected randomly.
Data analysis
Data are presented as mean and standard deviation unless otherwise noted; n denotes the number of animals studied. Statistics were performed using Prism version 7.0 for MacOS (GraphPad, San Diego, CA). Differences within groups were first tested with one-way analysis of variance (ANOVA) for repeated measures and for multiple comparisons between groups. Bonferroni post hoc test was used if significance was obtained. t-test was used to compare difference at specific time points between the study. For kidney morphology analysis, we used the Mann–Whitney test of unpaired t-test data. Changes were considered statistically significant if P < .05.
Results
A total of 25 animals were studied. One animal was found dead in the morning of the second day, 48 h after the topload with the rHb0.1Providence solution. Its systemic measurements are reported; however, no histopathology analysis was performed since the kidney was not collected. presents the baseline systemic values in each group.
Table 2 Number of animals (N) and the baseline values for heart rate (HR), mean arterial pressure (MAP), hemoglobin, hematocrit (Hct) and body weight (BW) with standard deviation according to solution used.
Systemics
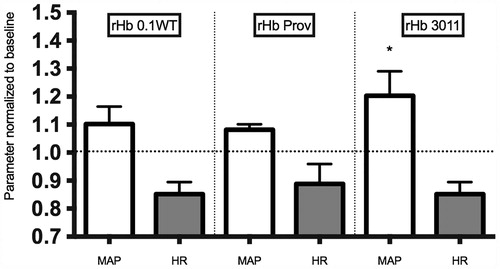
presents the effect of the study solutions on MAP. There was an increase in MAP in the rHb0.1WT, rHb0.1Prov and rHb3011 groups relative to baseline. rHb3011 had a statistically higher increase than rHb0.1WT and rHb0.1Prov at 30 minutes. There was also a statistical decrease in HR at 30 minutes for all solutions.
Figure 1. Represents the mean standard deviation for heart rate (HR) and mean arterial pressure (MAP) at 30 minutes after topload of recombinant hemoglobin (rHb) based oxygen carriers. Values are normalized to baseline at 1.0. There was statistical difference between values at 30 minutes compared with baseline. An asterisk represents statistical significance amongst different groups (G0.1WT, GProv, G3011).
Blood samples
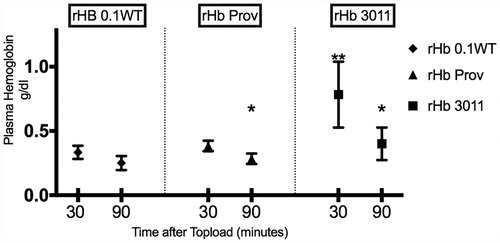
Whole blood hemoglobin and Hct were not statistically affected by the infusion of the study solutions and remained unchanged during the observation period. The amount of free plasma hemoglobin was statistically higher for rHb3011 at 30 minutes compared with rHbProv and rHb0.1WT at 30 minutes. There was a significant decrease over time for free plasma hemoglobin between 30 and 90 minutes within the same solution for rHb3011 and Providence, whereas there was not statistical difference for rHb0.1WT ().
Figure 2. Represents the plasma concentration of free hemoglobin over time. An asterisk represents statistical significance (P < .05) between 30 and 90 minutes within the same solution. Two asterisks represent statistical significance amongst solutions.
The kidney
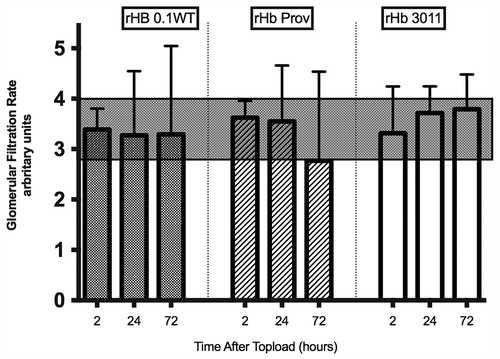
GFR. The GFR changes obtained for the study solutions are plotted in and . The shaded area represents the normal range. Normal range was determined by eight control animals measured three times each. We considered normal range to be one standard deviation from the mean value, 3.4 ± 0.6. The dot represents the GFR for each animal.
Figure 3. Individually plotted values for glomerular filtration rate (GFR) according to solution used. The shaded area denotes the range of normal GFR obtained from the control animals. Values are expressed as arbitrary units.
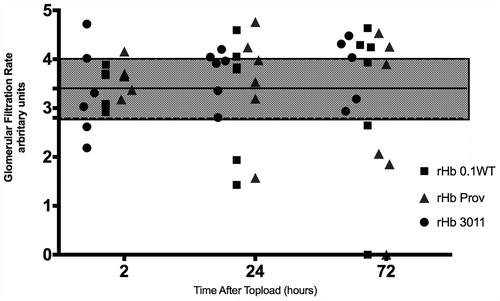
Figure 4. GFR as mean standard deviation according to solution used. The shaded area denotes the range of normal GFR obtained from the control animals. Values are expressed as arbitrary units.
Renal tissue analysis
Severity of tissue damage was statistically different comparing solutions to the control. There was no difference among solutions. Severity was classified and plotted and represented on . Control animals were not observed to have any sign of acute tubular necrosis.
Figure 5. Severity of acute tubular damage according to solution used. Percentage on left axis according with number of animals used.
Discussion
The aim of this study was to identify any characteristic of the tested rHb that might have association with GFR, kidney morphology, and systemic parameters. Our main findings were hypertension and bradycardia regardless k'NOD. Renal tissue analysis showed that these tested solutions caused morphological damage. There was no GFR alterations regardless morphological damage.
Nitric oxide scavenging (k'NOD)
It is well known that NO scavenging is promoted by cell-free hemoglobin and leads to hypertension. All the rHb solutions in the present study caused blood pressure increase and this is in accordance with several other studies after infusion of HBOCs (Bian et al. Citation2011, Loeb et al. Citation1997, Przybelski et al. Citation1996, Tsai et al. Citation2006, Citation2012).
Analyzing the results, we could observe hypertension compared with the baseline for all solutions. Unexpectedly, there was higher increase for blood pressure at 30 min between G3011 (low NO scavenging solution) compared with G0.1WT (high NO scavenging solution) that was statistical different. This could be explained by the amount of free hemoglobin that is significantly higher for rHb3011 at 30 minutes, although, in previous study, the increasing amount of HBOC did not further increase the hypertensive levels (Tsai et al. Citation2006). We cannot be certain why hypersive levels were higher for rHb3011 because this study did not compare different infused amounts. Another characteristic that may have contributed to the MAP elevation for G3011 is O2 affinity. Such a low affinity (P50-O2 – 65 mmHg) would release O2 earlier and perhaps induce vasoconstriction (Sakai et al. Citation2000). The instability of the molecule could also have contributed to higher hypertensive levels. Such a low stability could have resulted in more dissociated free heme at 30 minutes, which could also induce inflammation and vasoconstriction (Sakai et al. Citation2000). The HR decrease could be a hemodynamic reflex of hypertension. The HR decrease was also transient, but there was no difference among solutions.
O2 affinity (P50)
O2 affinity is a characteristic that might deserve some attention. The normal value in humans is 26.7 mmHg and in hamsters around 28 mmHg. An in vitro study found that HBOC mixture with blood may benefit from different oxygen binding properties (Page et al. Citation1998). Determining the right value is then desirable. It is speculated that a lower value could keep oxygen to deliver it in more ischemic regions. On the other hand, such a high affinity could steal oxygen from tissues. Researchers also advocate that a low P50 could precipitate early vasoconstriction. Gundersen et al. (Citation2009) were able to quantify in vivo the amount of oxygen delivered for tissues in the presence of HBOCs. Their results show that although HBOCs can increase O2 delivery to surrounding tissues in the case of blood loss, they cannot attain the same O2 transport capabilities of a similar amount of RBCs. However, they could not verify that differences in P50 would change O2 delivery capabilities. Thus, they concluded that the difference in O2 delivery was due to NO scavenging (Tsai et al. Citation2006, Yu et al. Citation2008, Citation2009).
The kidney
The control group presented with no morphologic variations, supporting the idea that the damage found on the kidneys of the studied animals were related with the solution and not with the method.
Chan et al. (Citation2000) studied the anatomy changes after stroma-free hemoglobin infusion into normoxic rat kidneys and showed that the changes were not the same as those seen in ischemic kidneys. They postulated that the kidney injury after stroma-free hemoglobin infusion is related to heme release and iron reactions. Heme contains redox-active iron, which is able to participate in organic and inorganic oxygen radical reactions, such as stimulating lipid peroxidation, catalyzing the formation of damaging hydroxyl radicals, and generating protein aggregates with subsequent tissue damage (Rohlfs et al. Citation1998). The proximal tubule of the kidney, especially the segment S1, is the most damaged area due to iron toxicity. Burhop et al. (Citation2004) found myocardial ischemic damage in swine and Cynomolgus monkeys after HBOC infusion. Despite obvious differences, kidney and heart are both organs that extract most of the blood oxygen content, meaning that small differences may result in tissue damage. Our results are seemed more compatible with heme-iron damage than ischemic damage with respect to morphological changes (Beeri et al. Citation1995).
Paller evaluated inulin clearance in rats 6 h after infusing free hemoglobin or free hemoglobin with deferoxamine. His results showed a significant decrease in renal function after free hemoglobin administration, which was not seen when deferoxamine was added. He also used glycerol on the muscle to release myoglobin. When deferoxamine was used, the biomarker for tubular damage was also significantly decreased. The author concluded that the iron released after heme breakdown was responsible for kidney damage because deferoxamine does not bind heme molecules, only free iron does (Paller Citation1988). We did not find GFR alterations that were statistically different, but looking individually we found 2 animals that presented renal failure after solutions being tested.
Half-life can be a major problem for these solutions, as their breakdown would increase free iron release, and kidney toxicity is dose dependent (Chan et al. Citation2000). The solutions we were able to test have half-lives in the blood stream of several hours, which is short compared with red blood cells. Transfused red cells have a half-life of approximately 30 days in the absence of other processes that would result in red cell loss or premature removal (Cable et al. Citation2007).
The GFR comparison between groups is a limitation in our study. We used a control group to establish a normal range for GFR and our results showed that there is a lot of variation between animals of this age and size. The standard deviation for this sample represents more than 10% of the average. Despite this limitation, an individual analysis shows that Providence and 0.1WT led to renal failure (). Further studies should measure GFR prior to any intervention that could influence it.
Conclusion
All the rHb solutions in the present study resulted in hypertension despite their differences in O2 affinities and k'NOD. Regardless of their properties, exposure of these acellular rHb caused significant morphological alteration to kidney tissue.
Acknowledgements
The authors thank Froilan Barra, Cynthia Walser for their preparation of the animal model; Daniel Ortiz for modification of the GFR technique for the animal model; and Frank DeLano for assistance with the histological sample preparation. We also thank John Olson, Jayashree Soman, Eileen Singleton, and particularly Cornelius Varnado for providing the rHb samples. A description of the methods used to produce the samples is given in Varnado et al. [Citation2013] and references therein, and was based on the original work carried out by Somatogen, Inc. (later Baxter Hemoglobin Therapeutics, Inc.). The Olson group has recently discovered that a significant fraction of rHb becomes glycated when expression is made ultra-high in bioreactors by more efficient heme transport and maintenance of high glucose concentrations to increase cell paste yields. These modifications do not appear to affect spectral characteristics or O2 affinities in phosphate buffers to any great extent but may influence various cellular interactions in vivo.
Disclosure statement
All authors declare no conflicts of interests.
References
- Abraham B, Hicks W, Jia Y, Baek JH, Miller JL, Alayash AI. 2011. Isolated Hb Providence beta82Asn and beta82Asp fractions are more stable than native HbA(0) under oxidative stress conditions. Biochemistry 50:9752–9766.
- Abramoff MD, Magalhães PJ, Ram SJ. 2004. Image Processing with ImageJ. Biophotonics Int 11:36–42.
- Beeri R, Symon Z, Brezis M, Ben-Sasson SA, Baehr PH, Rosen S, Zager RA. 1995. Rapid DNA fragmentation from hypoxia along the thick ascending limb of rat kidneys. Kidney Int 47:1806–1810.
- Bian Y, Rong Z, Chang TM. 2011. Polyhemoglobin-superoxide dismutase-catalase-carbonic anhydrase: a novel biotechnology-based blood substitute that transports both oxygen and carbon dioxide and also acts as an antioxidant. Artif Cells Blood Substitut Immobil Biotechnol 39:127–136.
- Bolton-Maggs P, Poles D. 2014. Participation in UK Haemovigilance Reporting; [Internet]. [cited 2016 Jun 19]. Available from: http://www.shotuk.org/wp-content/uploads/report-2014.pdf.
- Bonaventura J, Bonaventura C, Sullivan B, Ferruzzi G, McCurdy PR, Fox J, Moo-Penn WF. 1976. Hemoglobin providence. Functional consequences of two alterations of the 2,3-diphosphoglycerate binding site at position beta 82. J Biol Chem 251:7563–7571.
- Bunn HF, Jandl JH. 1968. Exchange of heme among hemoglobins and between hemoglobin and albumin. J Biol Chem243:465–475.
- Burhop K, Gordon D, Estep T. 2004. Review of hemoglobin-induced myocardial lesions. Artif Cells Blood Substit Immobil Biotechnol 32:353–374.
- Cable R, Carlson B, Chambers L, Kolins J, Murphy S, Tilzer L, et al. 2007. Practice guidelines for blood transfusion: a compilation from recent peer-reviewed literature [Internet]. American Red Cross [cited 2016 Jul 7]. Available from: http://www.sld.cu/galerias/pdf/sitios/anestesiologia/practical_guidelines_blood_transfusion.pdf.
- Chan WL, Tang NL, Yim CC, Lai FM, Tam MS. 2000. New features of renal lesion induced by stroma free hemoglobin. Toxicol Pathol 28:635–642.
- Chang TM. 1971. Stabilisation of enzymes by microencapsulation with a concentrated protein solution or by microencapsulation followed by cross-linking with glutaraldehyde. Biochem Biophys Res Commun 44:1531–1536.
- DeVenuto F, Zegna A. 1982. Blood exchange with pyridoxalated and polymerized hemoglobin solution. Surg Gynecol Obstet 155:342–346.
- Doherty DH, Doyle MP, Curry SR, Vali RJ, Fattor TJ, Olson JS, Lemon DD. Rate of reaction with nitric oxide determines the hypertensive effect of cell-free hemoglobin. Nat Biotechnol 1998. 16:672–676.
- Dou Y, Maillett DH, Eich RF, Olson JS. 2002. Myoglobin as a model system for designing heme protein based blood substitutes. Biophys Chem 98:127–148.
- Dudziak R, Bonhard K. 1980. The development of haemoglobin preparations for various indications. Anaesthesist 29:181–189.
- Endrich B, Asaishi K, Gotz A, Messmer K 1980. . Technical report – a new chamber technique for microvascular studies in unanesthetized hamsters. Res Exp Med (Berl) 177:125–134.
- Gundersen SI, Chen G, Palmer AF. 2009. Mathematical model of NO and O2 transport in an arteriole facilitated by hemoglobin based O2 carriers. Biophys Chem 143:1–17.
- Huang H, Olsen KW. 1994. Thermal stabilities of hemoglobins crosslinked with different length reagents. Artif Cells Blood Substitut and Immobil Biotechnol 22:719–724.
- Lacy ER, Schmidt-Nielsen B. 1979. Ultrastructural organization of the hamster renal pelvis. Am J Anat 155:403–423.
- Landers DF, Hill GE, Wong KC, Fox IJ. Blood transfusion-induced immunomodulation. Anesth Analg 1996;82:187–204.
- Lemon DD, Boland EJ, Nair PK, Olson JS, Hellums JD. 1988. Effects of physiological factors on oxygen transport in an in vitro capillary system. Adv Exp Med Biol 222:37–44.
- Loeb A, McIntosh LJ, Raj NR, Longnecker D. 1997. Regional vascular effects of rHb1.1, a hemoglobin-based oxygen carrier. J Cardiovasc Pharmacol 30:703–710.
- Looker D, Abbott-Brown D, Cozart P, Durfee S, Hoffman S, Mathews AJ, et al. 1992. A human recombinant haemoglobin designed for use as a blood substitute. Nature 356:258–260.
- Looker D, Mathews AJ, Neway JO, Stetler GL. Expression of recombinant human hemoglobin in Escherichia coli. Methods Enzymol 1994. 231:364–374.
- Moo-Penn WF, Jue DL, Bechtel KC, Johnson MH, Schmidt RM. 1976. Hemoglobin Providence. A human hemoglobin variant occurring in two forms in vivo. J Biol Chem 251:7557–7562.
- Olson JS, Foley EW, Rogge C, Tsai AL, Doyle MP, Lemon DD. 2004. No scavenging and the hypertensive effect of hemoglobin-based blood substitutes. Free Radic Biol Med 36:685–697.
- Page TC, Light WR, McKay CB, Hellums JD. 1998. Oxygen transport by erythrocyte/hemoglobin solution mixtures in an in vitro capillary as a model of hemoglobin-based oxygen carrier performance. Microvasc Res 55:54–64.
- Paller MS. 1988. Hemoglobin- and myoglobin-induced acute renal failure in rats: role of iron in nephrotoxicity. Am J Physiol 255:F539–F544.
- Palmer AF, Intaglietta M. 2014. Blood substitutes. Annu Rev Biomed Eng 16:77–101.
- Przybelski RJ, Daily EK, Kisicki JC, Mattia-Goldberg C, Bounds MJ, Colburn WA. 1996. Phase I study of the safety and pharmacologic effects of diaspirin cross-linked hemoglobin solution. Crit Care Med 24:1993–2000.
- Rohlfs RJ, Bruner E, Chiu A, Gonzales A, Gonzales ML, Magde D, et al. 1998. Arterial blood pressure responses to cell-free hemoglobin solutions and the reaction with nitric oxide. J Biol Chem 273:12128–12134.
- Sakai H, Hara H, Yuasa M, Tsai AG, Takeoka S, Tsuchida E, Intaglietta M. 2000. Molecular dimensions of Hb-based O(2) carriers determine constriction of resistance arteries and hypertension. Am J Physiol Heart Circul Physiol 279:H908–H915.
- Schock-Kusch D, Sadick M, Henninger N, Kraenzlin B, Claus G, Kloetzer HM, et al. 2009. Transcutaneous measurement of glomerular filtration rate using FITC-sinistrin in rats. Nephrol Dial Transplant 24:2997–3001.
- Schock-Kusch D, Xie Q, Shulhevich Y, Hesser J, Stsepankou D, Sadick M, et al. 2011. Transcutaneous assessment of renal function in conscious rats with a device for measuring FITC-sinistrin disappearance curves. Kidney Int 79:1254–1258.
- Schreiber A, Shulhevich Y, Geraci S, Hesser J, Stsepankou D, Neudecker S, et al. 2012. Transcutaneous measurement of renal function in conscious mice. Am J Physiol Renal Physiol 303:F783–F788.
- Stramer SL. 2007. Current risks of transfusion-transmitted agents: a review. Arch Pathol Lab Med 131:702–707.
- Tsai AG, Cabrales P, Manjula BN, Acharya SA, Winslow RM, Intaglietta M. 2006. Dissociation of local nitric oxide concentration and vasoconstriction in the presence of cell-free hemoglobin oxygen carriers. Blood 108:3603–3610.
- Tsai AG, Friesenecker B, McCarthy M, Sakai H, Intaglietta M. 1998. Plasma viscosity regulates capillary perfusion during extreme hemodilution in hamster skinfold model. Am J Physiol 275:H2170–H2180.
- Tsai AG, Intaglietta M, Sakai H, Delpy E, La Rochelle CD, Rousselot M, Zal F. 2012. Microcirculation and NO-CO studies of a natural extracellular hemoglobin developed for an oxygen therapeutic carrier. Curr Drug Discov Technol 9:166–172.
- Tuinman PR, Vlaar AP, Cornet AD, Hofstra JJ, Levi M, Meijers JC, et al. 2011. Blood transfusion during cardiac surgery is associated with inflammation and coagulation in the lung: a case control study. Crit Care 15:R59.
- Varnado CL, Mollan TL, Birukou I, Smith BJ, Henderson DP, Olson JS. 2013. Development of recombinant hemoglobin-based oxygen carriers. Antioxid Redox Signal 18:2314–2328.
- Vermeulen Windsant IC, de Wit NC, Sertorio JT, van Bijnen AA, Ganushchak YM, Heijmans JH, et al. 2014. Hemolysis during cardiac surgery is associated with increased intravascular nitric oxide consumption and perioperative kidney and intestinal tissue damage. Front Physiol 5:340.
- Von Stark G. 1898. Die resorborbarkeirt des haimatins und die bedeutungder hemoglobinpreparate. Dtsche Med Wochenschr 24:805–808.
- Yu B, Bloch KD, Zapol WM. Hemoglobin-based red blood cell substitutes and nitric oxide. Trends Cardiovasc Med 2009. 19:103–107.
- Yu B, Raher MJ, Volpato GP, Bloch KD, Ichinose F, Zapol WM. 2008. Inhaled nitric oxide enables artificial blood transfusion without hypertension. Circulation 117:1982–1990.
- Yu B, Shahid M, Egorina EM, Sovershaev MA, Raher MJ, Lei C, et al. 2010. Endothelial dysfunction enhances vasoconstriction due to scavenging of nitric oxide by a hemoglobin-based oxygen carrier. Anesthesiology 112:586–594.
- Zollner FG, Schock-Kusch D, Backer S, Neudecker S, Gretz N, Schad LR. 2013. Simultaneous measurement of kidney function by dynamic contrast enhanced MRI and FITC-sinistrin clearance in rats at 3 tesla: initial results. PLoS One 8:e79992.