
Abstract
The aim of this work is to apply Box-Behnken design to optimize the transfersomes were formulated by modified rotary evaporation sonication technique using surfactant Tween 80. The response surface methodology was used having three-factored with three levels. The prepared formulations were characterized for vesicle shape, size, entrapment efficiency (%), stability, and in vitro permeation. The result showed that drug entrapment of 84.24% with average vesicle size of 35.41 nm and drug loading of 8.042%. Thus, optimized formulation was found good stability and is a promising approach to improve the permeability of apigenin in sustained release for prolonged period of time.
Introduction
Skin cancer has become one of the most rapidly growing and ill-diagnosed disease in Asian countries. Every year the new cases are being reported. The contributing factors are environmental pollution and more exposure time in sunlight. In modern age, with the significant increase in the amount of UV radiation due to change in life style of people has led to a surge in the incidence of skin cancer. The incidence of melanoma increasing at a faster rate than almost all other cancers, cutaneous malignant melanoma is considered to be the most lethal form of skin cancer and is one of the most treatment-refractory malignancies (Mangalathillam et al. Citation2012). Advanced approach therapy options by using natural phytoconstituents or plant medicines either alone or in combination with chemotherapeutics may provide a breakthrough in the treatment of malignant melanoma (Ding et al. Citation2014, Kyaw et al. Citation2010). Apigenin common bioactive flavone is found in a wide variety of fruits, plants, and vegetables in high level in cherries, onion, apples, grapes, celery, and parsley has been reported to have numerous pharmacological properties and anticarcinogenic effects, anti-inflammatory, and antioxidant (Patel et al. Citation2009, Shen et al. Citation2014, Tong et al. Citation2007, Yousif et al. Citation2008).
Nanotechnology has been proved effectively enhance the solubility of compounds. The use of nanocrystals for improving aqueous solubility of apigenin is reported previously (Cevc et al. Citation1998, Shaal et al. Citation2011). During the past decades, the use of lipid vesicles as a tool to improve drug topical delivery has been increased. Vesicular deformable vesicles provide an alternative for improved skin drug delivery. Transfersomes as a novel vesicular drug carrier system is composed of water, surfactant, and phospholipid for enhanced skin drug delivery. These carrier systems can efficiently deliver both low and high molecular weight drug to the skin in terms of quantity and depth. Transfersomes are ultradeformable vesicles possessing an aqueous core surrounded by the complex lipid bilayer. Interdependency of local composition and shape of the bilayer makes the vesicle both self-regulating and self-optimizing (Walve et al. Citation2011). Transfersomes are supramolecular aggregates that are optimized, and contain ultraflexible lipid capable of penetrating the mammalian skin intact and then act as a drug carrier for non-invasive targeted drug delivery and sustained release of therapeutic agents (Cevc and Blume Citation1992). Surfactants such as Tween 80, Span 80 and sodium deoxycholate, have been used as edge activators. Due to their deformability, transfersomes are good candidates for the non-invasive delivery of small, medium, and large-sized drugs (Zhang et al. Citation2010). The objective of this study is to formulate ultraflexible lipid vesicles for enhanced skin delivery of apigenin. The prepared system was evaluated for its physicochemical characteristics, such as particle size, entrapment efficiency, stability, and in vitro study. The compositions of lipid in the transfersomes (phosphotidylecholine and surfactants) were evaluated. This study was to apply a mathematical model using Box-Behnken design in order to deduce the adequate conditions to prepare transfersomes of desired characteristics. The relationships between independent and dependent variables along with their responses were described by response surface methodology. Three-factor and three-level with three replicates at the center in the design was selected to obtain response surface models.
The aim of the present research work was to develop and optimize transfersomes using design expert software and to explore the in vitro characterization of the optimized formulation for particle size, zeta potential, % drug entrapment efficiency, transmission electron microscopy, powder X-ray diffraction, differential scanning colorimetry, and drug release. Stability of the developed formulation was also evaluated.
Materials and methods
Materials
Apigenin was purchased from Sigma Aldrich (Bombay, India), Tween 80, Rhodamine, and Phospholipid were purchased from Himedia, Mumbai, India. Phospholipid (phosphotidylcholine) from soya lecithin containing not less than 98% PC. All other chemicals used in the study were of analytical grade.
Methods
Preparation of apigenin-loaded transfersomes
Apigenin-loaded transfersomes were formulated using Rotary evaporation sonication technique with some modifications by a reported method by Cevc et al. (Citation1998). Briefly, soya phosphotidylecholine, tween 80, and anticancer apigenin drug were dissolved in ethanol. Ethanol was evaporated by rotary evaporation (Buchi rotavapor R-3000 with 14000 Water bath, Switzerland) under reduced pressure above the lipid transition temperature for the formation of lipid film on the wall of the flask. The film was hydrated at 45 °C using a saline phosphate buffer solution (pH 5.5) by rotation at 60 rpm (Abdallah Citation2013, Jain et al. Citation2003). The transfersomes formed were allowed to swell for 2 h at room temperature. The resulting vesicles were sonicated for 30 min in a probe sonicator to reduce the size of the vesicles in uniform. The prepared transfersomes were stored in an air tight container, which is well closed for further study. The composition of these formulations is shown in .
Table 1. Box-Behnken study of actual experimental design and obtained actual response.
Experimental design
Box-Behnken design–response surface methodology (BBD–RSM) was used to systemically investigate the influence of these three critical formulation variables on vesicle size, drug loading percentage (%, w/w), and entrapment efficiency (%, w/w) of the prepared transfersomes. The details of the design are listed in . For every factor, the ranges of experiments were selected on the basis of the results of preliminary experiments and the feasibility of preparing the transfersomes at the extreme values (Nasr and Abdel-Hamid Citation2016). The phospholipid and surfactant concentration ratio, sonication time, and rotation speed were chosen as three independent variables. Vesicle sizes, drug loading, and entrapment efficiency were selected as dependent variables. Amount of apigenin (0.05%) was kept constant. Values of all variables and batch codes are reported in . Optimized formulation was selected on the basis of the solution provided by the software.
Characterization of nanovesicular carrier transfersomes
Vesicle size analysis
The size of vesicle was analyzed by dynamic light scattering (DLS) with a Malvern Zetasizer 3000 HSA (Malvern Instruments, Malvern, UK). DLS yields the mean diameter and the polydispersity index (PI), which is a measure of the width of the size distribution. The sample was diluted by ultrapurifier water prior to the experiment. The measurements were performed in triplicate (Puri et al. Citation2015).
Zeta potential
Zeta potential, reflects the change in electric charge on the vesicle surface and indicates the physical stability of colloidal systems, was measured by determining the electrophoretic mobility using the Malvern Zetasizer 3000 HSA (Malvern Instruments, UK) (Palem et al. Citation2015). The transfersomes were diluted by ultrapurifier water prior to the experiment.
Morphology study
Surface morphology of prepared transfersomes vesicles was visualized by transmission electron microscopy (TEM) (Hitachi J 500, H7500 Japan). The sample of transfersomes were placed on carbon-coated copper grids followed by negative staining using aqueous solution of phospho-tungustic acid (1%) and viewed under the microscope with an accelerated voltage of 100 kV (Sarwa et al. Citation2014).
X-ray diffraction study
The X-ray diffraction (XRD) was performed to analyze the nature (crystalline or amorphous nature) of apigenin-loaded nanovesicular transfersomes. X-ray powder diffraction studies of pure drug apigenin, phospholipid (soya lecithin), physical mixture (apigenin and phospholipids) and transfersomes were carried out using powder X-ray diffractometer (PANalytical 3 kW X’pert Powder, Cambridge, UK). Samples were placed in sample stage and scanned from 2θ to 60θ with an operating voltage of 40 kV and current 30 mA. A Cu-Ka radiation source was used and the scanning rate (2 h/min) was 5 °C/min (Ravula et al. Citation2016).
FTIR study
The FTIR spectrum (Shimadzu 8400S) of drug samples (apigenin, soya phospholipids, and optimized formulation) was used for infrared analysis of samples using KBr pellet technique. About 1–3 mg of sample was mixed with dry potassium bromide and the samples were examined at transmission mode over wave number range of 4000-400 cm−1. The peaks are as shown in , which shows the characteristic absorption of various functional groups of drug (Mangalathillam et al. Citation2012).
Differential scanning colorimetry study
Differential scanning colorimetry studies for the pure drug, soya phospholipids, and optimized formulation were carried out individually for each drug. The study was carried out using a DSC instrument (Perkin Elmer Jade, CA, USA; Department of Pharmaceutical Sciences, Dibrugarh University, Assam, India). Samples of 5 mg were placed in aluminum pans (Al-Crucibles, 40 Al) and sealed. The probes were heated from 50 to 400 °C at a rate 10 °C/min under nitrogen atmosphere (Jain and Jangdey Citation2009). Data are shown in .
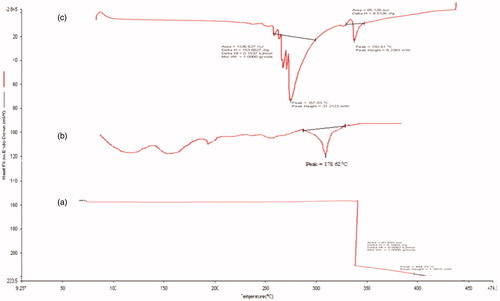
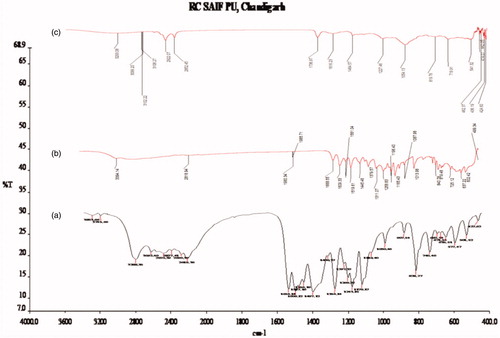
Figure 1. DSC thermogram of (a) drug apigenin, (b) soya phospholipid, and (c) optimized transfersome.
Percent entrapment efficiency and percent drug loading
The amount of apigenin entrapped within the transfersomes was determined by ultracentrifugation method. The % entrapment efficiency and % drug loading were calculated with the following equation:
where, EE is the entrapment efficacy, Qt is the amount of apigenin added, Qs is the amount of apigenin detected in the supernatant, and Qu is the total amount of polymer used in preparation. The unentrapped drug in transfersomes dispersion was separated by cooling centrifuge (Remi Instruments Ltd., Mumbai, India) at 13,000 rpm, 4 °C for 20 min and the supernatant was decanted. The concentration of apigenin in supernatant was determined using UV–visible spectrophotometer at λmax 336 nm (Perkin Elmer Lambda 25 double beam UV-Visible Spectrophotometer, Singapore). Each experiment was performed in triplicate (Saraf et al. Citation2011).
Stability of formulation
Stability study of the formulation was carried out in order to assess the ability of the developed delivery system to withstand environmental stress. Optimized formulations were stored at different temperature conditions and relative humidity, i.e. at room temperature and accelerated temperature (25 ± 2 °C, 60 ± 5%RH) and (40 ± 2 °C, 75 ± 5%RH) for 6 months (Gupta et al. Citation2016). After six-month storage, the samples were analyzed for structural integrity of transfersomes, vesicles size, zeta potential, and % entrapment efficiency (Alexander et al. Citation2015).
In vitro drug release study
In vitro release studies of drug-loaded transfersome and pure drug suspension and marketed product was carried out for each drug individually using modified Franz diffusion (Mol. Wt. cut off 6000–8000, HI Media Ltd, Mumbai, India). Vertical Franz diffusion cell was designed and validated prior to the release study. The cellophane membrane was mounted on a diffusion cell assembly having a diffusion area of 2.5 cm. The receptor compartment consisted of a 22.5 ml phosphate buffer at pH 5.5 as the receptor fluid agitated at 100 rpm, and was maintained at 37 ± 0.5 °C throughout the experiments. The prepared formulation was placed in the membrane of donor compartment (Ali et al. Citation2012). An aliquot of 2 ml sample was withdrawn at suitable time intervals and replaced immediately with an equal volume of fresh diffusion medium. The % drug release was calculated and graph of % drug release against time was plotted, release studies were performed in triplicate for each formulation (Gajra et al. Citation2016).
Ex-vivo permeation studies
The full-thickness of the skin of hairless mice (Swiss albino mice) was used for the ex-vivo permeation experiment using modified fabricated Franz diffusion cell. The skin was clamped between the donor and the receptor chamber of diffusion cell with an effective diffusion area of 2.5 cm2. The receptor chamber was filled with freshly prepared phosphate buffer pH 5.5. The diffusion cell was maintained at 37 °C and the solution of the receptor chamber was stirred continuously at 300 rpm by using magnetic stirrer with hot plate (Remi Equipments, Mumbai, India). The transfersome formulation (2 ml) bearing apigenin was gently placed in the donor chamber. At 1, 2, 3, 4, 5, 6, 12, 18 and 24 h, 5.0 ml of the solution in the receptor compartment was removed and analyzed using a UV-spectrophotometer (Systronic, Perkin Elmer Lambda 25 double beam UV-Visible Spectrophotometer, Singapore) and replaced immediately with an equal volume of fresh PBS in pH 5.5. All experiments were performed in triplicate (Khan et al. Citation2015).
Skin deposition study
The skin retention studies of optimized transfersome, pure drug suspension, and marketed product (flonida, cream, Shalak Pharmaceuticals, New Delhi, India) formulations were performed in order to analyze the content of apigenin in the skin after 24 h of diffusion. At the end of 24 h, the skin mounted on the diffusion cell was removed carefully, and the skin surface was washed five times with warm (45 °C) receptor medium (Elsayed et al. Citation2006). For the evaluation of drug retention in the skin, the cleaned skin was cut into small pieces, mashed completely in a beaker and 10 ml of 50% methanol was added to this mass. The beaker was mechanically shaken in a water shaker bath at 37 °C for 2 h for the complete extraction of the drug. After suitable dilution, the apigenin content in the filtrate was determined by UV spectroscopy.
Statistical analysis
All the data were expressed as a mean ± SD. The results were statistically analyzed by analysis of variance ANOVA test; P values less than 0.05 (P < 0.05) were considered as significant. Design-Expert software (Trial version 9.0.1, Stat-Ease, Inc., Minneapolis, MN) was utilised for statistical analysis and plotting graph.
Results and discussion
Optimization of formulas
The surface response methodology in combination with Box-Behnken factorial design is an effective tool for investigation of maximum variables at different level along with limited number of experimental runs (Duangjit et al. Citation2011). In present investigation using three factors, three-level factorial designs with three different responses were studied. From these results three dependent values were obtained ranging from 68.05 to 84.24% for EE, 0. 013 to 8.042% for DL, and 35.09 to 56.25 nm for PS. It was observed that quadratic model was best fitted for these responses, viz. mean particle size, %EE and %DL. The below mentioned quadratic equations were generated as:
(1)
(2)
(3)
where, X1, X2, and X3 represent the coded values for the ratio of phospholipid and surfactant, sonication time, and rotation speed, respectively. The positive sign of a factor in the above equation indicates a synergistic effect or an enhancement of that specific response and vice versa. The lack-of-fit was not significant in maximum cases at 94-97% confidence level. Rest of the parameters were significant at P ≤ 0.05. shows the average experimental values of the three batches of transfersomes prepared using the optimized range and very close to the predicted values. The result indicated low percentage bias, suggesting that the optimized formulation was consistent and reasonable.
Table 2. Comparison of the observed and predicted values in the prepared under predicted optimum conditions.
Response surface plots
The Box-Behnken design model was selected to obtain the surface response and 17 experimental runs were performed exclusively for three levels and three factors. depicts detailed summary of experimental runs along with dependent and independent variables. In order to study the relationship between dependent and independent variables, further surface responses were plotted. The three-dimensional (3-D) graph was generated by Design-Expert® software (trial version 9.0.1) (Durán-Lobato et al. Citation2016). The different statistical parameter values obtained like multiple correlation coefficients (R2), coefficient of variation, P values, F-value, standard deviation, and predicted residual sum of squares and mean square values are depicted in . The most statistically significant variables on the evaluated parameters are presented in (Gupta et al. Citation2016).
Figure 2. Three-dimensional surface plots showing the effect of variables on (a) particle size, (b) % entrapment efficiency, and (c) % drug loading.
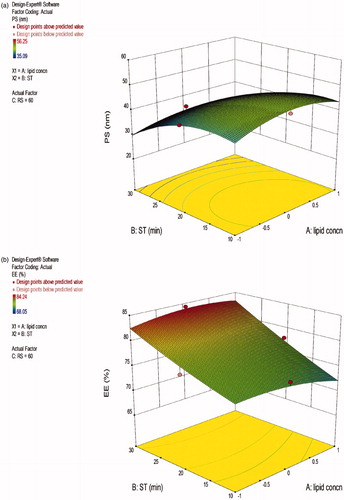

Table 3. Summary of results of regression analysis for responses and analysis of variance for particle size, % EE, and % DL.
The three-dimensional (3D) response surface graph is used for studying the interaction patterns. On the basis of three-dimensional response surface curve, it is apparent that soya phospholipid: surfactant ratio, sonication time, and rotation speed significantly affect the mean particle size, entrapment efficiency (EE), and percentage drug loading (DL). Response surface graph generated from Design Expert® software exhibited that increase in phospholipids and surfactant ratio led to an increase in mean particle size and %EE but lowering in %DL and vice versa. For second factor sonication time, the optimum time was found to be 15 min for minimum particle size with higher %EE and %DL. In case of third factor rotation speed, it was also found to be responsible for the small mean vesicle droplet size with high %EE and optimum value was found to be 60 rpm. The surface response plot showed that selected dependent variables were statistically significant. However, zeta potential in all the formulations ranged from 5.22 ± 0.7 to 14.26 ± 0.3 mV showing good stability. shows a suitable polynomial equation involving the individual main effects and interaction factors was selected based on the estimation of several statistical parameters such as the multiple correlation coefficient (R2), adjusted multiple correction coefficient (adjusted R2), and the predicted residual sum of squares (Press) provided by Design-Expert® software 9.0.1.
Effect of phospholipid: surfactant ratio on entrapment efficiency and drug loading
The % entrapment efficiency of deformable vesicle formulations were found to be in the range of 68.05 ± 0.14 to 84.24 ± 0.38 (). The % EE increased significantly (P < 0.05) with increasing surfactant concentration from 5 to 10% (w/w) for transfersomes prepared using TW80. Further increase in surfactant concentration to 10 and then to 15% (w/w) showed a significant decrease in EE% (P < 0.05) (). The ratio 90:10% (w/w) showed optimum EE%, . Upon incorporation of surfactant in low concentration, growth in vesicle size occurred, whereas further increase in the content of surfactant may have led to pore formation in the bilayers. When surfactant concentration exceeded 15%, mixed micelles coexisted with the transfersomes, with the consequence of lower drug entrapment due to the rigidity and smaller size of mixed micelles. Patel et al. (Citation2009) reported that the effect of phospholipids and surfactant ratio in the lipid components of vesicles on the entrapment efficiency of lipophilic drug, apigenin, the efficiency decreased with increasing surfactant concentration. Drug loading also depends upon the variables of phospholipid and surfactant ratio. The present study revealed that drug loading was increased with phospholipid and surfactant concentration only in few batches, and overall dependency is limited but surfactant affects greatly in a positive manner. The Model F-value of 15.76 implies the model is significant. There is only a 0.07% chance that an F-value this large could occur due to noise. Values of “Prob > F” less than 0.0500 indicate model terms are significant.
Effect of vesicle composition
illustrates the percentages of drug entrapment in optimized transfersomal formulations in comparison to pure drug suspension and marketed product. The EE of transfersomes formulations were significantly higher than the pure drug suspension and marketed formulation (P < 0.05). This result might be attributed to interactions between the surfactants and apigenin forming a complex and this complex was inserted into the transfersomes bilayer. Fang et al. (Citation2008) reported that adding surfactant, sodium stearate to phosphatidylethanolamine vesicles significantly increased the entrapment efficiency of 5-aminolevulinic acid in comparison to liposomes. Higher entrapment efficiency in case of transfersomes has also been reported by Gupta et al. (Citation2005), who found that transfersomes revealed significant higher entrapment efficiency in comparison to liposomes and niosomes.
Effect of phospholipid and surfactant ratio on the particle size, PDI, and zeta potential
Phospholipids and surfactant ratio was employed in the preparation of formulation, which produced drastic changes in the mean particle size and stability of transfersomes formulation. There was significant difference in the phospholipids and surfactant ratio with a range from 95:5 to 85:15%. The particle size significantly increased with an increase in the phospholipids and surfactant ratio. The zeta potential was in the range of −9.22 mV −14.26 mV showing good stability. Observed zeta potential values indicate that the surface charge of the particles in different formulation was negative. Thus, there was no significant correlation between the zeta potential and phospholipids and surfactant ratio. The value of PDI also increased with an increase in the Phospholipids: Surfactant ratio.
Vesicles size, PDI, and zeta potential analysis
The vesicles size analysis values for transfersomes determined by Malvern Mastersizer showed size raging from 35.09 to 56.25 nm (). The effect of less lipid ratio of phospholipids and surfactant concentration on the particle size can be seen from particle size of sample TW80–2 and TW80–16.(35.09 nm and 35.41 nm). The effect of sonication and rotation speed was not significant on decreasing the size of particle separately but together they showed decreases in particle size. Sonication time also led to an alteration in the zeta potential of the formulation. On increasing the sonication time, zeta potential changes from 5.22 mV to −14.26 mV. Additionally, there was no significant effect of rotation speed on PDI.
Morphological study
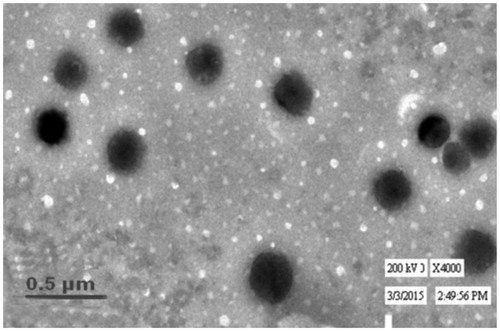
The transmission electron micrographs of TW80–16 are shown in . They showed that the prepared vesicles are nano-sized and unilamellar. Outline and core of the well-identified spherical vesicles confirming the vesicular characteristics, displaying the retention of sealed vesicular structure. The vesicles are smaller unilamellar vesicles with a more homogenous size distribution.
Figure 3. Transmission electron micrograph of optimized transfersome.
X-ray diffraction study
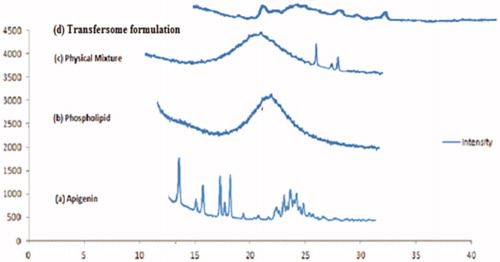
X-ray diffractogram of pure drug apigenin showed that sharp diffraction peak at 2θ value of 13.2, 15.5, 16.6, 18, and 23. Phospholipid displayed characteristic peak at 2θ value of 11.3 and 23.5. The crystalline peak of mixture for apigenin was clearly evident in . Whereas the transfersome formulation showed deformed peak for apigenin, indicating the relative reduction in the diffraction intensities in the transfersomes. The appearance of sharp peak is strongly characteristic of the pure apigenin used in the experiments. As for crystallinity, each samples are amorphous, an indication they are probably easy to be complexation.
Figure 4. X-ray diffractogram of (a) apigenin, (b) soya phospholipid, (c) physical mixture, and (d) transfersome formulation.
DSC study
A sharp melting transition of pure drug apigenin was observed at 226.98 °C. Soya phosphotidylecholine and tween 80 showed an endothermic peak at 77.52 and 222.13 °C. A DSC thermogram of optimized formulation showed a peak at 218.19 °C, these sharp melting endothermic peaks of bulk lipid indicate that the starting material was crystalline. The peak for apigenin was completely absent in optimized transfersomes. It has been reported that when the drug does not show its endothermic peaks in the optimized formulations, it is said to be in the amorphous state. Hence, it could be concluded that the drug was present in the amorphous phase and may have been homogeneously dispersed in the transfersomes.
FTIR study
The FTIR spectra of apigenin showed characteristic peaks at 3550–3200 cm−1 (O-H stretching), and the C–H stretching occurs above 3000 cm−1 with the aliphatic C–H stretching. The very strong bands in FT-IR at 3287 cm−1 and the C = O stretching bands are observed in the region 1750–1735 cm−1 (C = O stretching). The observed bands at 1651, 1500, 1354, and 1245 cm−1 in IR corresponds to ring modes, which are localized on the benzene part of the molecule but disappeared in the transfersome formulation, while the new peaks at 1559 cm−1 C–C stretching and 1607 cm−1 aromatic C–H bending were appeared. Remaining peaks also either shifted or replaced in the IR spectrum of formulation as shown in . This established drug entrapment in lipid nanocarriers.
Figure 5. FTIR spectra of (a) apigenin, (b) soya phospholipid, and (c) optimized transfersome.
In vitro drug release
The findings of in-vitro release curve of apigenin-loaded transfersomes, pure drug suspension, and marketed product in a phosphate buffer of pH 5.5 at 37 ± 0.5 °C are exhibited as shown in . In our studies, the % cumulative drug release of the optimized transfersomes, pure drug suspension, and marketed product dispersion was 61.20, 70.42, and 74.34% in 24 h, respectively. The outcomes exhibit that the formulation represents burst release phase corresponding to about 10–15% was observed within 2 h due to the drug desorption and release from the transfersomes surface. But after two hours release of drug from optimized transfersomes, there was retardation that represents the sustained release pattern. The findings of in-vitro release suggested the burst release of drug that was due to the availability of free apigenin in the outer surface of the transfersome (Mukerje and Vishwanatha Citation2009). The sustained release of the drug was due to apigenin and could be the reason for the sustained release of the drug from the internal lipid phase after the initial burst release. The results of drug release are reported in .
Figure 6. In vitro drug release profile of apigenin-loaded transfersome and marketed and pure drug suspension in skin pH 5.5.
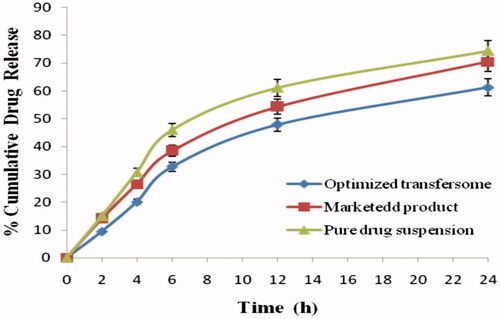
Table 4 In vitro drug release profile of apigenin-loaded transfersome, and marketed and pure drug suspension in skin pH 5.5.
Ex-vivo skin permeation and skin deposition study
The cumulative amount of apigenin permeated through the Swiss albino mice in all vesicle formulations was significantly (P < 0.05) higher than the pure drug suspension and marketed product. The amount of apigenin permeated through skin from optimized transfersome was significantly (P < 0.05) higher than that from pure drug suspension and marketed product. Flux of optimized transfersome through mice skin was 6.68 ± 0.46 and % drug retention was 0.79 ± 0.05, while pure drug suspension and marketed product were significantly lower transdermal flux and % drug retention. The nanosize as well as the influence of surfactant are the major factors for contributing to the better penetration. So, surfactant swells the stratum corneum and the intact vesicle can penetrate into and through the intact skin. The result of drug retention studies was reported in and graphically presented in .
Figure 7. Percentage drug retentation of different formulation in mice skin after 24 h.
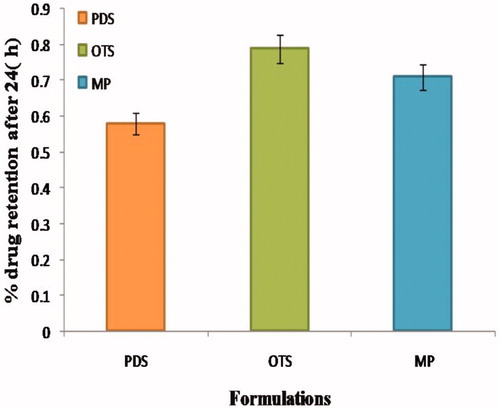
Table 5. Permeation and % drug retention data for apigenin loaded optimized formulations and pure drug suspension across (Swiss albino mice) skin.
Stability studies
The stability studies show that there was a negligible increase in the particle size from 35.41 ± 0.52 to 36.55 ± 3.34 nm during the storage conditions (4 and 25 °C). The initial % entrapment efficiency of the optimized transfersomes was found to be 84.24 ± 0.38%. After 6 months storage at 4 and 25 °C it was found to be 81.05 ± 0.62% and 79.24 ± 0.45%, respectively. In contrast, there were no significant changes in the % EE during storage of formulation for 6 months at 4 and 25 °C. Zeta potential with slight reduction after 6 months storage at 4 and 25 °C. Thus, optimized formulation was found to be stable at 4 and 25 °C temperatures for six months. The data are represented in .
Table 6. Stability study of optimized transfersome for 6 months maintained at 4 and 25 °C temperature conditions.
Summary and conclusions
This optimized transfersome (TW80–16) has excellent capacity for drug loading, desirable size, and surface properties with the burst release initially and good sustained release action subsequently. Formulated transfersomes of apigenin would be a novel approach for trafficking due to their efficiency of skin penetration through the melanocytes layers of skin. Apigenin was successfully incorporated into transfersomes. The application of Box-Behnken design proved to be a useful tool for optimization apigenin-loaded transfersome. From this study, it is concluded that transfersomes loaded with apigenin showed that prolonged action than pure drug suspension and commercial product, and it can be developed successfully to improve the skin cancer activity of any herbal or synthetic drug.
| Abbreviations | ||
| BBD | = | Box–Behnken design–response surface methodology |
| DL | = | drug loading |
| DLS | = | dynamic light scattering |
| DSC | = | differential scanning calorimetry |
| EE | = | entrapment efficiency |
| FTIR | = | Fourier transform infrared |
| MP | = | marketed product |
| PBS | = | phosphate buffer saline |
| PC | = | phosphotidylcholine, |
| TEM | = | transmission electron microscope |
| TW 80 | = | tween 80 |
| XRD | = | X-ray diffraction |
Acknowledgements
Two of the authors extend their gratitude towards the head of the cosmetic lab, Institute of Pharmacy, Pt. Ravishankar Shukla University, Raipur (C.G.) for providing facilities to carry out research work. Authors also want to thank library of Pt. Ravishankar Shukla University for providing e-resources available through UGC-INFLIBNET.
Disclosure statement
The authors report no conflicts of interest.
Funding
The authors acknowledge University Grant Commission-SAP, New Delhi, India for financial assistance.
References
- Abdallah MH. 2013. Transfersomes as a transdermal drug delivery system for enhancement the antifungal activity of Nystatin. Int J Pharm Pharm Sci. 5:560–567.
- Ali MS, Alam MS, Alam N, Alam MI, Imam F, Ali MD. 2012. Formulation, characterization and in-vivo study of nanoemulsion topical gel of beclomethasone dipropionate for psoriasis. World J Pharmacy Pharmaceut Sci. 1:839–857.
- Alexander A, Saraf S, Saraf S. 2015. A comparative study of chitosan and poloxamer based thermosensitive hydrogel for the delivery of PEGylated melphalan conjugates. Drug Dev Ind Pharm. 41:1954–1961.
- Cevc G, Blume G. 1992. Lipid vesicles penetrate into intact skin owing to the transdermal osmotic gradients and hydration force. Biochim Biophys Acta. 1104:226–232.
- Cevc G, Grbauer D, Schatzlein A, Blume G. 1998. Ultraflexible vesicles, transfersomes, have an extremely low pore penetration resistance and transport therapeutic amounts of insulin across the intact mammalian skin. Biochim Biophys Acta. 1368:201–215.
- Ding S, Zhang Z, Song J, Cheng X, Jiang J, Jia X. 2014. Enhanced bioavailability of apigenin via preparation of a carbon nanopowder solid dispersion. Int J Nanomed. 9:327–2333.
- Duangjit S, Opanasopit P, Rojanarata T, Ngawhirunpat T. 2011. Characterization and in vitro skin permeation of meloxicam-loaded liposomes versus transfersomes. J Drug Deliv. 2011:418316.
- Durán-Lobato M, Martín-Banderas L, Lopes R, Gonçalves LM, Fernández-Arévalo M, Almeida AJ. 2016. Lipid nanoparticles as an emerging platform for cannabinoid delivery: physicochemical optimization and biocompatibility. Drug Dev Ind Pharm. 42:190–198.
- Elsayed MMA, Abdullah OY, Naggar VF, Khalafallah NM. 2006. Deformable liposomes and ethosomes: mechanism of enhanced skin delivery. Int J Pharm. 322:60–66.
- Fang YP, Tsai YH, Wu PC, Huang YB. 2008. Comparison of 5-aminolevulinic acid-encapsulated liposome versus ethosome for skin delivery for photodynamic therapy. Int J Pharm. 356:144–152.
- Gajra B, Patel RR, Dalwadi C. 2016. Formulation, optimization and characterization of cationic polymeric nanoparticles of mast cell stabilizing agent using the Box?Behnken experimental design. Drug Dev Ind Pharm. 42:747–757.
- Gupta PN, Mishra V, Rawat A, Dubey P, Mahor S, Jain S, Chatterji DP, Vyas SP. 2005. Non-invasive vaccine delivery in transfersomes, niosomes and liposomes: a comparative study. Int J Pharm. 293:73–82.
- Gupta A, Kaur CD, Saraf S, Saraf S. 2016. Formulation, characterization, and evaluation of ligand-conjugated biodegradable quercetin nanoparticles for active targeting. Artif Cells Nanomed Biotechnol. 44:960–970.
- Jain S, Jain P, Umamaheshwari RB, Jain NK. 2003. Transfersomes–a novel vesicular carrier for enhanced transdermal delivery: development, characterization, and performance evaluation. Drug Dev Ind Pharm. 29:1013–1026.
- Jain SK, Jangdey MS. 2009. Lectin conjugated gastro-retentive multiparticulate delivery system of clarithromycin for the effective treatment of Helicobacter pylori. Int J Mol Pharmaceut. 6:295–304.
- Khan MA, Pandit J, Sultana Y, Sultana S, Ali A, Aqil M, Chauhan M. 2015. Novel carbopol-based transfersomal gel of 5-fluorouracil for skin cancer treatment: in vitro characterization and in vivo study. Drug Deliv. 22:795–802.
- Kyaw MH, Chun-Chieh C, Lie-Fen S. 2010. Current research and development of chemotherapeutic agents for melanoma. Cancers. 2:397–419.
- Mangalathillam S, Rejinold NS, Nair A, Lakshmanan VK, Nair SV, Jayakumar R. 2012. Curcumin loaded chitin nanogels for skin cancer treatment via the transdermal route. Nanoscale. 4:239–250.
- Mukerje A, Vishwanatha JK. 2009. Characterization and evaluation of curcumin-loaded PLGA nanospheres for cancer therapy. Anticancer Res. 29:3867–3876.
- Nasr M, Abdel-Hamid S. 2016. Optimizing the dermal accumulation of a tazarotene microemulsion using skin deposition modeling. Drug Dev Ind Pharm. 42:636–643.
- Palem CR, Dudhipala NR, Battu SK, Repka MA, Rao Yamsani M. 2015. Development, optimization and in vivo characterization of domperidone-controlled release hot-melt-extruded films for buccal delivery. Drug Dev Ind Pharm. 42:473–484.
- Patel D, Shukla S, Gupta S. 2007. Apigenin and cancer chemoprevention: progress, potential and promise. Int J Oncol. 30:233–245.
- Patel R, Singh SK, Singh S, Sheth NR, Gendle R. 2009. Development and characterization of curcumin loaded transfersome for transdermal delivery. J Pharm Sci Res. 1:71–80.
- Puri R, Mahajan M, Sahajpal NS, Singh H, Singh H, Jain SK. 2015. Self-nanoemulsifying drug delivery system of docosahexanoic acid: development, in vitro, in vivo characterization. Drug Dev Ind Pharm. 42:1032–1041.
- Ravula R, Herwadker AK, Abla MJ, Little J, Banga AK. 2016. Formulation optimization of a drug in adhesive transdermal analgesic patch. Drug Dev Ind Pharm. 42:862–870.
- Saraf S, Jeswani G, Kaur CD, Saraf S. 2011. Development of novel herbal cosmetic cream with Curcuma longa extract loaded transfersomes for antiwrinkle effect. Afr J Pharm Pharmacol. 5:1054–1062.
- Sarwa KK, Das PJ, Mazumder B. 2014. A nanovesicle topical formulation of Bhut Jolokia (hottest capsicum): a potential anti-arthritic medicine. Expert Opin Drug Deliv. 11:661–676.
- Shaal A, Shegokar L, Müller RH. 2011. Production and characterization of antioxidant apigenin nanocrystals as a novel UV skin protective formulation. Int J Pharm. 420:133–140.
- Shen L, Zhang Y, Wang Q, Xu L, Feng NP. 2014. Enhanced in vitro and in vivo skin deposition of apigenin delivered using ethosomes. Int J Pharmaceut. 460:280–288.
- Tong X, Van Dross RT, Abu-Yousif A, Morrison AR, Pelling JC. 2007. Apigenin prevents UVB-induced cyclooxygenase 2 expression: coupled mRNA stabilization and translational inhibition. Mol Cell Biol. 27:283–296.
- Walve JR, Bakliwal SR, Rane BR, Pawar SP. 2011. Transfersomes: a syrrogated carrier for transdermal drug delivery system. Int J App Bio Pharm Tech. 2:204–213.
- Yousif AO, Smith KA, Getsios S, Green KJ, Van Dross RT, Pelling JC. 2008. Enhancement of UVB-induced apoptosis by apigenin in human keratinocytes and organotypic keratinocyte cultures. Cancer Res. 68:3057–3065.
- Zhang X, Liu J, Qiao H, Liu H, Ni J, Zhang W, Shi Y. 2010. Formulation optimization of dihydroartemisinin nanostructured lipid carrier using response surface methodology. Powder Technol. 197:120–128.