
 ?Mathematical formulae have been encoded as MathML and are displayed in this HTML version using MathJax in order to improve their display. Uncheck the box to turn MathJax off. This feature requires Javascript. Click on a formula to zoom.
Abstract
The present investigation deals with synthesis of graphene oxide (GO) and fabrication of GO-based hybrid nanocomposites (Ncs). Synthesized GO and Ncs were primarily confirmed by UV visible and Fourier transform infrared (FT-IR) spectroscopy. Fabricated Ncs showed potential antimicrobial activity against Gram-positive and Gram-negative bacterial strains. Surface morphology, Elemental analysis, and FTIR imaging analysis were carried out to confirm Ncs formation. The Ncs were impregnated into the pullulan polymeric layer-by-layer (LbL) ultrathin film by using novel spin-coating approach. Mechanical properties were determined using Brookfield texture analyzer, and percentage moisture content confirmed the physicochemical stability of LbL film.
Introduction
Graphene, a unique monolayer of sp2-hybridized carbon atoms arranged in a two-dimensional lattice, has attracted tremendous attention in recent years owing to its exceptional high thermal conductivity, high charge carrier mobility, large theoretical specific surface area, and excellent mechanical and electrical properties (Goenka et al. Citation2014, Liu et al. Citation2010, Citation2011, Citation2013). One of the most promising applications is from the polymer nanocomposites (Ncs). Incorporation of nanoscale filler such as GO, Zn, Al, Si, etc. into polymer matrix gives a better activity than single component. Ncs with exfoliated layered silicate fillers have been investigated as early as 1950 which is used in recent biomedical and biotechnological applications (Ansari and Giannelis Citation2009, Bose et al. Citation2010, Fan et al. Citation2010, Kuila et al. Citation2011, Ramanathan et al. Citation2008, Stankovich et al. Citation2006, Zhang et al. Citation2010, Zhao et al. Citation2010).
The GO provides many advantages compared to other drug delivering systems because of its high drug loading capacity to different types of drugs and therapeutic molecules. Functionalization of GO with specific micro or nanomolecules through hydroxide, epoxy, carboxylic acid groups shows specific biological activity and superior biocompatibility within cells. Some noncovalently bonded molecules through surface π electrons, hydrophobic interactions, or electrostatic interactions improvise external molecular binding to sites along with stable molecular environment (Goenka et al. Citation2014, Liu et al. Citation2013).
As GO has excellent physicochemical properties, hence it offers many streamlines such as energy-related material science, field effect transistors, biomedical application to name a few. Fabricating the polymer-based composite helps a better effect of polymeric composites as biomaterial, and it works synergistically to improve the force field effect (Goenka et al. Citation2014, Liu et al. Citation2010, Citation2011, Citation2012, Novoselov et al. Citation2004, Park and Ruoff Citation2009, Pham et al. Citation2011).
The GO containing individual sheet has exogenous oxygen functional groups which allow functionalization on broad spectrum of substrate to form interbound network. Generally hydroxyl, carboxylic, carbonyl, and epoxide depict high surface area and helpful for surface functionalization. The surface modification of GO can useably convert hydrophilic to organophilic functional moiety with good dispersibility, which is convenient route for chemical functionalization and to load ions or nanoparticles over the surface of exfoliated GO (Das et al. Citation2011). To explore the properties of material is based on intrinsic properties, which could made more versatile material by hybridization of different material to enhance the properties of GO. Hybridization enables the tailor-made product with high performance compared to individual material.
Low chemical reactivity of graphene with other materials has been advantageous to explore their properties via physical adsorption of metal nanoparticles to form a heterostructure (Chook et al. Citation2015, Shen et al. Citation2010, Yang and Liu Citation2011).
As manifested by many researchers reported in literature, surface modified or immobilize with GO using various organic and inorganic material produces a hybrid composite material which have potential and crucial importance in the areas of catalysis, microelectronic, photovoltaic diodes, biological, and drug delivery applications (Chook et al. Citation2015, Das et al. Citation2011, Pandey et al. Citation2013). However, recent studies suggest that the NC-based graphene exploring the area of biomedical such as drug delivery, biosensing/bioimaging, cancer photothermal therapy, antibacterial materials, biomedical engineering, regenerative medicine, and biotechnology (Bai et al. Citation2011, Chaudhari et al. Citation2014, Das et al. Citation2011, Kuila et al. Citation2012, Patil et al. Citation2016, Sanchez et al. Citation2011, Shen et al. Citation2012, Wang et al. Citation2011, Yang et al. Citation2010)
The GO-based metal NCs exhibit wide range of activity against bacterial pathogens (Richtera et al. Citation2015). Polymer Nc formed is basically based on surface functional properties of GO which can form a hydrogen bonding between polymeric matrix chain and metal ions (Liu et al. Citation2014).
Pullulan is a biodegradable, nontoxic, nonmutagenic, biocompatible nonionic polysaccharide. Pullulan has commercially available in 1959 by Hayashibara Co. Ltd. Japan. It has tremendous good physicochemical properties such as nonhygroscopic, tasteless, and odorless, oxygen impermeable, solubility in hot and cold water along with film forming ability, and high bioadhesion (Rekha and Sharma Citation2007). From last few years, pullulan is being use in biomedical applications such as targeted drug delivery, gene transfection and delivery, tissue engineering, wound healing, etc. which also have diagnostic application in conjunction with quantum dots (Akiyoshi et al. Citation1998, Arora et al. Citation2015, Deshmukh et al. Citation2013, Pandey et al. Citation2015, Patil et al. Citation2013, Priya et al. Citation2014, Rekha and Sharma Citation2007, Saranya et al. Citation2015).
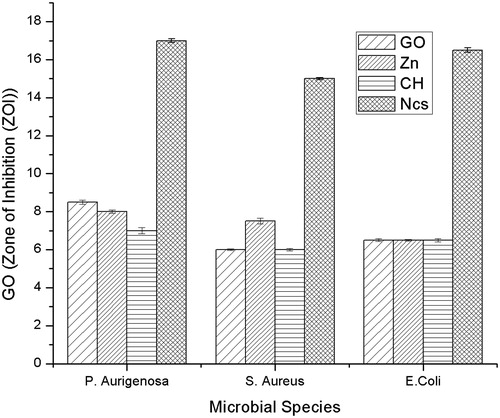
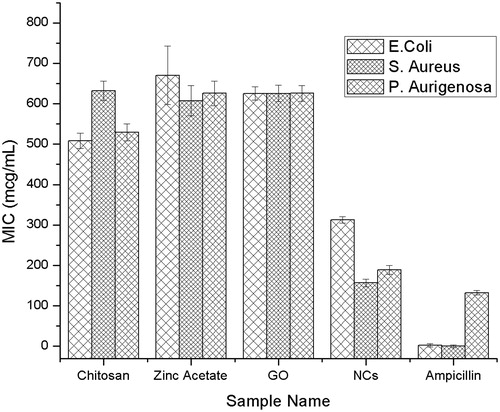
In the present investigation, GO, chitosan, and zinc nanocomposites (GO-CH-Zn Ncs) were prepared by polycationic exchange between exfoliated surface groups of GO. The one-pot synthesis strategy was used wherein GO dispersion containing Zn and separately prepared chitosan solution (1% Acetic acid) were mixed vigorously. The prepared Ncs were characterized by FT-IR, SEM, EDX, and FTIR Imaging which finally demonstrated successful fabrication of GO-CH-Zn Ncs. The Ncs retained good antibacterial activity than individual components such as GO, CH and Zn, it summarily increases the zone of inhibition (ZOI) to approximately 15–17 mm from 6–7.5 mm of Ncs and individual components. Broth dilution method showed promising and relevant results comparing individual components such as GO, CH, Zn, and Ncs. Minimum inhibitory concentration for Ncs found to be 312, 156, and 189 μg/mL for Escherichia coli, Staphylococcus aureus, and Pseudomonas aeruginosa bacterial culture, respectively. Fabricated LbL film properties improved greatly such as tensile and mechanical strength, water retention, and absorption due to novel spin-coating method. Ecofriendly, biocompatible, good antibacterial activity of Ncs containing GO-CH-Zn, suspended into homogenous solution of pullulan, was utilized for the preparation of LbL film by using novel spin-coating method. In near future, the film can be used as promising candidate for tissue engineering, wound healing, and transdermal drug delivery system.
Experimental section
Materials
Graphite was kindly gifted by Asbury Carbons Inc., Asbury, NJ. Sulfuric acid and hydrochloric acid were purchased from Merck Specialties Pvt. Ltd., Mumbai. Potassium permanganate and zinc acetate were purchased from Loba Chemie Pvt. Ltd., Mumbai, India. Hydrogen peroxide was purchased from RFCL Ltd., Mumbai, India. Chitosan was gifted by M/s South India Sea Foods, Kochi, India. All other chemical and reagent were of analytical grade.
Synthesis of GO
The GO was synthesized by modified staudenmaier’s method which was reported previously (Guo et al. Citation2010) with slight modification. The mixture of concentrated sulfuric acid and fumed nitric acid in ratio of 2:1 (v/v) with immediate addition of 2.5 g of graphite flakes was kept in ice bath and stirred above mixture for 2 h at 0 °C. Subsequently, 25 g of KMnO4 was slowly added by maintaining temperature below 15 °C to avoid explosion. Then, complete oxidation of graphite to graphene, until 44 h at room temperature, was allowed. Reaction was quenched by adding 800 mL deionized water; the black gray color transformed to golden brownish color, and by gradual addition of 7 mL H2O2 (30%) into reaction mixture, the color was changed to golden yellow from previous brownish color. The reaction mixture was repeatedly washed with 10% HCL to remove the unreacted impurities. Washed product dried at 60 °C in oven for 2 h.
Synthesis of GO-CH-Zn Ncs
The GO-CH-Zn Ncs were synthesized by using one-step synthesis method which was reported previously (Anandhavelu and Thambidurai Citation2013) with some modifications, such as zinc chloride was replaced with zinc acetate and NaOH was used to precipitate out the Ncs. Accurately weighed 0.3 g of CH dissolved into 30 mL of 1% acetic acid solution in 100 mL beaker. About 20 mL of 15% Zn solution and 50 mL of exfoliated GO dispersion (2 mg/mL) were prepared separately. Finally the Zn and GO solution were added slowly into CH solution with continuous stirring over magnetic stirrer for 3 h, and then kept overnight to settle down at the bottom. Supernatant was decanted, and semisolid mass was collected after centrifugation; it was dried further under oven at 50 °C for 2 h. The dried product obtained was stored in an airtight container.
Preparation of Ncs-impregnated layer-by-layer (LbL film) sheets
Accurately weighed quantities of Ncs and Pullulan (0.1:2.5) were added into water and ultrasonicated for 10 min to make it homogenous. Spin-coating technique was reported earlier in the field of electronics and physical science, but for biomedical application, we are the first to report spin coater to fabricate layer-by-layer (LbL) Ncs polymeric film for wound dressing, tissue engineering, and transdermal patches like applications. Then prepared viscous solution of pullulan was dropped on glass slide at feed rate of 0.2 mL. Each layer was prepared in three revolution cycles at different rpm and different time intervals, as enlisted in . After immediate drying of first layer, next drop of solution was added one after another to get next layer, in the same manner; the Ncs-impregnated ultrathin LbL film was prepared.
Table 1. Process parameters to prepare LbL films.
Table 2. Textural properties of film.
Characterization of synthesized GO andGO-CH-Zn Ncs
UV-visible spectroscopy
Analysis of synthesized samples of GO and Ncs was carried out on UV-Vis Spectrophotometer (UV 1800 Shimadzu, Japan). The measurement of samples was performed by preparing 1 mg/mL dispersion in water and scanned in photometric mode from 400 to 200. The λ max at 238 nm was selected and recorded against distilled water (DW) as blank solution.
Fourier transform infrared (FT-IR) spectroscopy
The primary confirmation of modified synthesized Go and Ncs was carried out using FTIR spectroscopy. Fabricated LbL film was subjected for identification of the functional groups present in material. For FTIR spectroscopy, the materials and dried KBr were mixed in ratio 1:10. Then the IR spectrum was taken on FTIR spectrophotometer (IR Infinity, Shimadzu by DRS 8000 technique).
Scanning electron microscopy (SEM)
The surface morphology of synthesized GO and Ncs were analyzed using scanning electron microscopy (Bruker, 1530-2 FESEM/EDX) with acceleration voltage of 15 kV at 1-μm resolution. The samples were gold-plated prior to imaging. This study was carried out for differentiating the surface morphology of GO and Ncs.
Elemental analysis using EDX
Elemental analysis of synthesized GO and GO-CH-Zn Ncs was studied using scanning electron microscopy (SEM-EDX) and EDX analysis; the synthesized GO and Ncs were prepared for study by placing a droplet onto an aluminum specimen stub, dried overnight, and spurting with gold prior to imaging using Bruker 1530-2 FESEM/EDX, with 20-Kv accelerating voltage.
Transmission electron microscopy
The progress made in transmission electron microscopy (TEM) has enabled the direct imaging of atomic structures in solids and surfaces. The TEM uses transmitted electrons to form a sample image. The study was carried out using Philips CM 200 with an accelerating voltage of 200 kV and filament LoB6 (filament/Tungston). The samples were prepared by dispersion of Ncs in distilled water ultrasonicated for 20 min; drop of dispersion on metallic grids was evaporated for the removal of solvent. The sample was observed under microscope at resolution 2.4 Å. The TEM image of GO-CH-Zn Ncs was used to compare the internal structure.
Particle size and zeta potential analysis
The average particle size diameter of GO and Go-CH-Zn Ncs was analyzed by using Malvern Zeta Sizer (Master Sizer 2000, Malvern Instruments, Malvern, UK). Samples were diluted with triple distilled water (TDS) to give the recommended scattering intensity of 1 lakh counts/s. Each sample was measured in triplicate in the analysis.
FTIR imaging
FTIR Imaging of the GO-CH-Zn Ncs was analyzed using 3000 Hyperion Microscope with Vertex 80 FTIR System (Bruker, Karlsruhe, Germany) for detection of functional groups same as like FTIR, but in FTIR imaging, the spectra were drawn such as wavenumber (cm−1) versus absorbance units. As well as it shows colored 2-D image in which various shades of colors will change because of fabricated Ncs from individual components.
Antimicrobial activity
Zone of inhibition
The antimicrobial study of synthesized GO, as well as CH, Zn acetate, and Ncs was carried out by using agar diffusion method to calculate the zone inhibited in millimeter. The method involves weighing of 2.5 g of Agar-Agar and 1.3 g of nutrient broth and dissolved into 100 mL of DW. The prepared nutrient medium placed in an autoclave and sterilization cycle was performed according to Indian Pharmacopoeia (Indian Pharmacopoeia Citation1996), in which holding time was 30–60 min at 15 psi pressure and temperature was allowed to reach upto 115–138 °C; after completion of cycle, nutrient medium was transferred into sterile petri-plates and cool it to solidify the medium under sterilized area. Fresh bacterial suspension of E. coli, S. aureus, P. aeruginosa, etc. was spread on nutrient medium. Then prepared solutions of GO, CH, Zn, and Ncs in concentration of 1 mg/mL in DW were poured into the well. The DW was used as solvent and showed the zero or diminutive zone of inhibition (ZOI) (Arora et al. Citation2015). Then, solutions were allowed to freeze for 20 min, after that petriplates were incubated for 48 h, and finally plates were observed for the calculation of ZOI.
Broth dilution method
The broth dilution assay is a standard method of measuring MIC (minimum inhibitory concentration); it was carried out with E. coli, S. aureus, and P. aeruginosa .Various concentrations (0.78, 15.6, 31.25, 62.50, 125.0, 250.0 μg/mL) of GO, CH, Zinc acetate, GO-CH-Zn Ncs, and Ampicillin in a series of test tubes containing 2 mL of sterile LB broth were inoculated with a 1–1.5 × 10⁵ CFU/mL; 20 μL of fresh bacterial culture of E. coli, S. aureus, and P. aeruginosa were inoculated. All the tubes were then incubated at 37 °C overnight. Next day, the tubes were observed for turbidity and further dilution was done in sterile saline solution, and 100 μL was spread over sterile agar plates and number of colonies counted as rate of inhibition and concentration noted as minimum inhibitory concentration.
In vitro cell viability assay
In vitro cell cytotoxicity assay for Ncs (from 1 to 50 μg/mL) was studied with regard to cell viability of HeLa cell line using MTT assay. The HeLa cells were grown in a 96-well plate and left for seeding for 24 h. After 24-h seeding, the old medium was discarded and the cells were incubated with various concentrations of Ncs from 1, 5, 10, 25, 50 μg/mL. The cells were incubated for further 24 h at 37 °C with 5% CO2. The medium was replaced with serum-free DMEM before addition of 20 μL MTT (5 mg/mL) in PBS. After 4 h, when the MTT fully integrated with cells, 150 μL of DMSO was added to the cells. The plates were then oscillated for 10 min to confirm the dissolution of Formazan in DMSO. Finally, the absorbance at 570 nm was measured by using a TRITURUS microplate reader.
Characterization of layer-by-layer film
Texture analyzer
The textural characterization of film was carried out using texture analyzer CT3 Brookfield texture analyzer. In this technique, some potential mechanical properties of film was characterized such as % deformation, time, and load required to break the film, etc. The texture analyzer used a Texture pro CT V1.4 software in which all necessary parameters were determined. While handling the texture analyzer, trigger load (4.90 N), target (30 mm), return speed (5 mm/s), test type (tension) etc parameters were set, as well as the probe (TA-3/100), fixture (TA-RT-KI), and load cell (10,000 g) were selected for analyzing the film.
Tensile strength
The tensile strength of film was analyzed on the texture analyzer. In which tensile grip was fixed to the base of texture analyzer while the other one was attached to the load cell. The sample film was placed between both tensile grips, and rupture force was taken as maximum force required to break the sample and calculating the tensile strength of film using following formula:
(1)
(1)
Percentage elongation
In the percentage elongation, stress is applied in which a film stretches, and this is referred as strain. Strain is basically the deformation of film divided by original dimension of the film sample. Generally elongation of film sample increases if the concentration of the plasticizer increases. The film was placed in between both upper and lower tensile grips of texture analyzer, and the applied force was calculated for deformation of film and increasing length of film.
Thickness
The thickness of film was determined by using digital vernier caliper (Mitutoyo Digimatic Caliper, Japan), in which the film thickness was measured at three edges of film and the mean was calculated. It shows the thickness of film in millimeters.
Folding endurance
The folding endurance test measures a combination of tensile strength, stretch, and fatigue properties of film. The folding endurance of the film was determined by folding the film multiple times on the same site and determined the breaking point of film that is when it was broken down and calculated the folding endurance of film.
Percentage moisture content
Percentage moisture content was determined by drying the film in oven at 110 °C for 24 h. The difference between initial (W0) and final (Wf) weight loss shows the moisture reduction, and the following formula was used to calculate the percentage moisture content of the film (Guo et al. Citation2010):
(2)
(2)
Water solubility test
Water solubility test was carried out to determine the film solubilization parameters that will help during percentage moisture retention during direct contact between film and test object. It was calculated after pre-weighed film of 1 × 3 cm2 was immersed under constant agitation in 50 mL of DW at 25 °C. After 6 h, the solution get filtered off and undissolved film over the surface was dried at 110 °C; the percentage water solubility was calculated using following formula, where, W0 – initial weight of film, Wf – final dried weight of the film:
(3)
(3)
Result and discussion
UV-visible spectroscopy
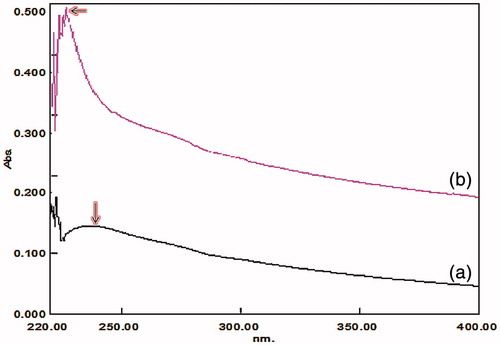
The UV visible spectra of GO exhibits a maximum absorption peak at about 235 nm, corresponding to π–π* transition of aromatic CC bonds (Jang et al. Citation2013). The synthesized GO and Ncs show the same spectral wavelength as reported earlier. The modified staudermaier method used for the synthesis of GO and the spectra obtained at 237 nm, while in Ncs-containing GO combined with zinc and chitosan, the λmax shifted to 226 nm as shown in ).
Figure 1. UV spectrum of (a) GO, (b) Ncs.
Fourier transform infrared spectroscopy (FTIR)
The FTIR (FTIR-DRS-8000, Shimadzu) spectrum was done to investigate the interaction between GO, CH, and Zn as shown in . In the spectrum of GO, , the peak observed at 1741 cm−1, which was related to stretching band for C-O, corresponds to presence of carboxylic acid. The intense bands at 3072 cm−1 and 1222 cm−1 were attributed to stretching and bending of the O-H, respectively (Zhou et al. Citation2012). The deformation of C-O was observed at 1058 cm−1. The FTIR spectrum of CH shows () two functional groups correspond to C = O stretching vibration of -NHCO- and the -NH- bending vibration of -NH- appearing at 1658 cm−1 and 1585 cm−1, respectively (Yang et al. Citation2010).
Figure 2. FTIR spectrum of following (a) GO, (b) chitosan, (c) zinc acetate, (d) Ncs.
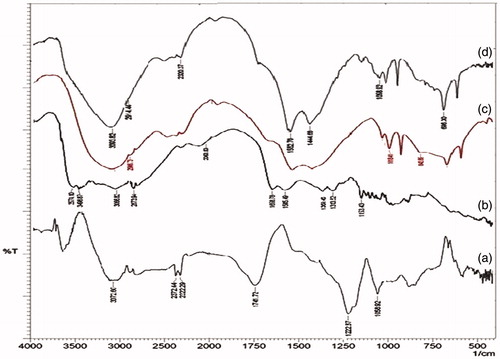
The FTIR spectrum from for zinc acetate shows characteristic peaks at 1560 cm−1 and 1458 cm−1 of COO- stretching vibration asymmetric and symmetric, respectively. As well as, the presence of Zn observed at far IR 696 cm−1, which is also documented in literature (Wang et al. Citation2011).
In the FTIR spectrum, GO-CH-Zn Ncs as shown in , the characteristics peaks were changed due to the hydrogen bond formation. In case of Ncs, all the above-mentioned peaks were disappeared (1726 cm−1, 1658 cm−1, 1585 cm−1), and bond formation peak was observed because of interactions between carbonyl and hydroxyl groups from GO and CH moieties, at 1552 cm−1. This corresponds to amide or carbamate ester formation due to the grafting reaction. The presence of GO in Ncs was confirmed by OH stretching peak at 3093 cm−1 as well as peak at 696 cm−1 showed the presence of Zn in the Ncs (Anandhavelu and Thambidurai Citation2013).
Scanning electron microscopy (SEM)
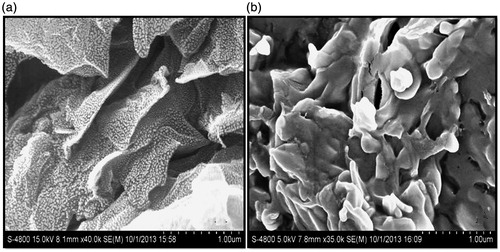
The surface morphology was studied using SEM analysis. The SEM images of plane GO and GO-CH-Zn Ncs are shown in . The GO observed as stacked structure corresponds to morphology of GO nanosheets; the SEM images of primitive graphene are also rough, alike to GO, but they do not show the presence of multiple stacked sheets. Form , the experimental results show a curly surface morphology with thin wrinkled structure, which is noticeable in the SEM images of GO. The major difference between pristine graphene and GO is an absence of oxygen-containing functional group. In the case of Ncs, the stacked structure of GO sheets converted to rough structure due to deposition of CH and Zn on the GO. The SEM images of GO and Ncs clearly indicate the distinct change in surface morphology, which gives further confirmation of successful fabrication of Ncs.
Figure 3. SEM images of (a) GO, (b) Ncs.
Elemental analysis using SEM-EDX
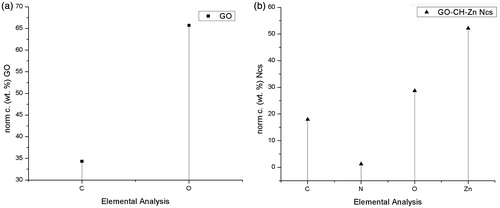
The elemental analysis of synthesized GO and Ncs was carried out to confirm the percentage elemental concentration as shown in ). EDX study confirms the presence of Zn as well as Carbon, Nitrogen, and Oxygen elements in Ncs. The elemental analysis also shows the presence of other impurities within the sample or containing byproduct formed during the reaction. Elemental analysis of synthesized GO and Ncs was studied using scanning electron microscopy (SEM-EDX) with EDX analysis. In the case of GO, carbon and oxygen were determined from the spectra, in which the presence of carbon as well as oxygen was found to be 41.03% and 58.97%, respectively. The presence of highest oxygen content on GO which is likely to be confirmed after elemental analysis, verified the oxygen containing functionality on GO. The analyzed spectrum of Ncs () demonstrates that the presence of 19.13% Zinc, 42.99% Oxygen, 35.81% Carbon, and 2.07% Nitrogen. Existence of all these elements in the Ncs with decreasing percentage concentration of oxygen species compared with GO demonstrates the formation of complex between GO-CH-Zn NC.
Figure 4. Elemental analysis of (a) GO, (b) Ncs.
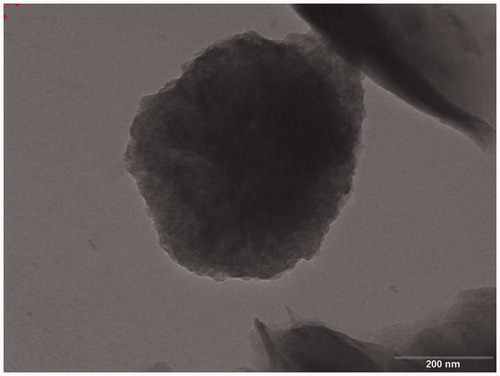
Transmission electron microscopy
The TEM images of Ncs, as shown in , clearly demonstrate the formation of NC. Crosslinked polymeric CH with deposited Zn was observed in TEM Analysis where stacked structural morphology was observed in SEM analysis. In TEM, internal structure of Ncs was more complex with roughly spherical structure. Crosslinked CH and intermediate deposited Zn ions on GO clearly showed the Ncs formation.
Figure 5. TEM image for Ncs.
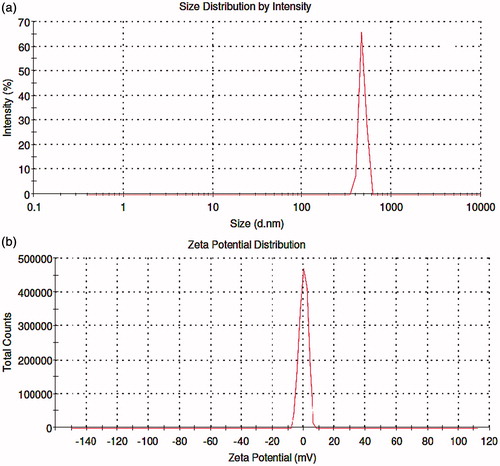
Particle size and zeta potential
Particle size is a crucial factor which helps to determine the therapeutic effect of nanoparticulate material on rate and extent of release at extracellular level. The GO and Ncs were analyzed by using Malvern Zetasizer, in which particle size of Ncs was measured and average particle size was found to be 615 nm as shown in , and the zeta potential of the Ncs was found to be −0.0657 mV ().
Figure 6. GO-CH-Zn Ncs: (a) particle size, (b) zeta potential.
FTIR imaging
The spectrum of FTIR imaging was slightly divergent as compared with the simple FTIR spectrum. The FTIR spectroscopy is a powerful tool for characterizing the chemical compositions of materials and provides both qualitative and quantitative information on molecular structure. FTIR imaging system is a supportive accessory for FTIR spectroscopy, which provides a distribution map of functional components in the sample (Kimura-Suda et al. Citation2013).
The FTIR Imaging of the Ncs spectra () shows that hydrogen bonding between peak of GO and CH was obtained at 1548 cm−1 and disappearance of some characteristic peaks of GO and CH like 1726 cm−1, 1658 cm−1, and 1585 cm−1. The image of Ncs () also shows the higher color intensity in the range of 1600–1700 cm−1 which gives the confirmation about GO-CH-Zn Nc formation.
Figure 7. FTIR imaging spectra of GO-CH-Zn Ncs.
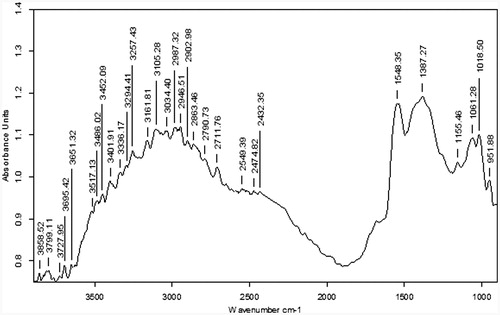
Figure 8. Three-dimensional image of GO-CH-Zn Ncs.
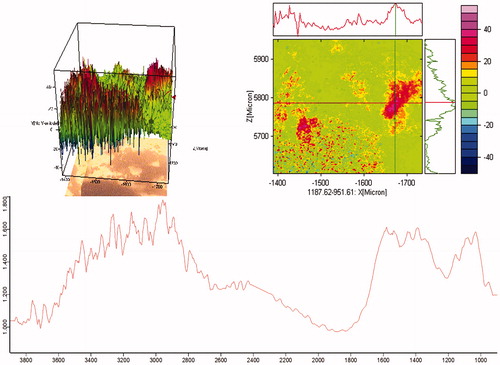
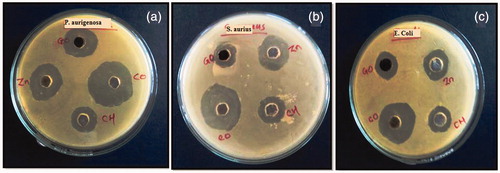
Figure 9. Antimicrobial activity of graphene oxide, chitosan, zinc acetate, and Ncs on (a) P. aeruginosa, (b) S. aureus, (c) E. coli.
Antimicrobial activity
Zone of inhibition
Antimicrobial activity of the GO-CH-Zn Ncs was carried out with the individual components such as GO, CH, and Zn using agar well diffusion method. In this method, (i) E. coli, (ii) S. aureus, and (iii) P. aeruginosa cultured microorganisms were used. The zone of inhibition (ZOI) of all components was obtained which are shown in the and , from which we can concluded that the ZOI of Ncs was larger (near about double) than the ZOI of individual components, i.e., GO, CH, and Zn.
Figure 10. Zone of inhibition (ZOI) of different microbial species.
Broth dilution method
Bacteria duplet rate is rapid, and resistance was developed by some bacteria as specific concentration. By use of NCs, we led to the conclusion that bacterial susceptibility may be prevented by individual action of each component. MIC determination was carried out to determine the microbial inhibition by broth dilution method. Quantitative method found more promising; results are shown in . Optimum level of inhibition for Ncs was 312 μg/mL for E. coli and that for S. aureus and P. aeruginosa was found to be 156 and 189 μg/mL, respectively. Qualitative and quantitative method provided potential inhibition rates compared with individual components.
Figure 11. Antibacterial study by broth dilution method.
In light of above-mentioned facts, it can be concluded that the GO-CH-Zn Ncs had great antimicrobial potential which may be further applied for various biomedical applications.
The broad spectrum antimicrobial activity of synthesized Ncs is owing to the synergistic effect of GO, Zn, and CH. The actual mechanism of action cannot be explained without carrying fully fledged study but mutual mechanism is proposed in this work that according to which GO interacts with the bacteria and fungus with a wide range of aggregated GO sheets, resulting in the local perturbation of their cell membrane which induces decrease in the membrane potential of bacteria leading to the leakage of electrolytes. According to previously published literature, it is also likely that GO interacts with the pathogens by mechanically wrapping and locally damaging the cell membrane and finally causing cell lysis, which may be one of the major toxicity actions of GO against phytopathogens. In the meanwhile, the direct contact of Zn present in Ncs with cell walls results in destructing bacterial cell integrity, liberation of antimicrobial ions mainly Zn2+ ions and ROS formation. The CH from Ncs interacts with microbial DNA leading to the inhibition of the mRNA and protein synthesis via the penetration of CH into the nuclei of the microorganisms. Apart from DNA interaction, CH has excellent metal-binding capacities where the amine groups in the CH molecules are responsible for the uptake of metal cations by chelation leading to enhanced uptake of metal ions such as copper and zinc which might interfere with metabolic working of microorganism.
Cell viability assay
Toxicity of NCs is one of the prime hurdles for their application in effective biomedical applications. Many such inorganic materials containing nanoparticles have been reported to cause cellular damage, such as membrane destabilization, cell shrinkage, reduction in frequency of mitosis, and formation of vacuoles in the cell cytoplasm. Integral stacked structure of graphene oxide has potential applicability to load the bioactive molecules and has high loading capacity. Thus, toxicological assessment of Nc is important for validating their efficacy at the sub-cellular level. It is even more critical for newly synthesized nanocomplexes due to the unavailability of their toxicological profile.
The cellular cytotoxicity assays provide a rapid way of assessing the toxicity of Nc as cell death is considered a direct indicator of the toxicity potential of the test materials. The MTT assay, used in the present investigation, is an indicator of mitochondrial activity induced by test materials. This assay is based on the ability of the mitochondrial dehydrogenases of viable cells to cause reductive conversion of the yellow tetrazolium dye (MTT) to blue formazan crystals.
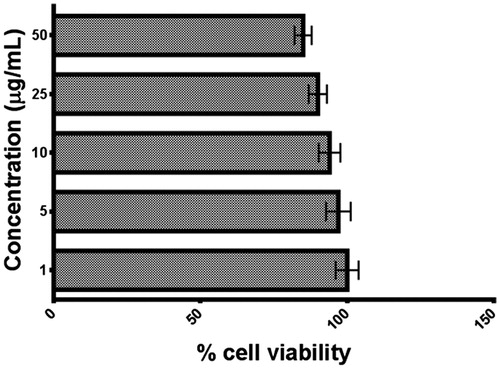
The results of the MTT assay have been depicted in . As evident from the results, the Nc did not affect the cell viability at concentration from 1 to 50 μg/mL have less for the cells. The viability of cells in sample with slightly higher concentration 50 μg/mL was found to be about 80% indicating that the selected concentration range is nontoxic to cells.
Figure 12. Cytotoxicity study for Ncs.
Characterization of LbL film
The fabrication of Ncs-impregnated LbL film was done using novel spin-coating approach. The substrates used for the preparation process was circular flat glass slides of 2.5 cm in diameter. A physical property of film depends primarily on film thickness. Rate of solvent evaporation, viscosity of solution, concentration of solvent and percentage solid concentrate, as well as rotation speed and spinning time are the critical processing parameters which directly affect the thickness of LbL film formation. Spin-coating approach is useful to fabricate a tailor-made LbL film having various biomedical applications. The general appearance of film was like an artificial skin which may be more convenient as compared to other.
Textural analysis of film
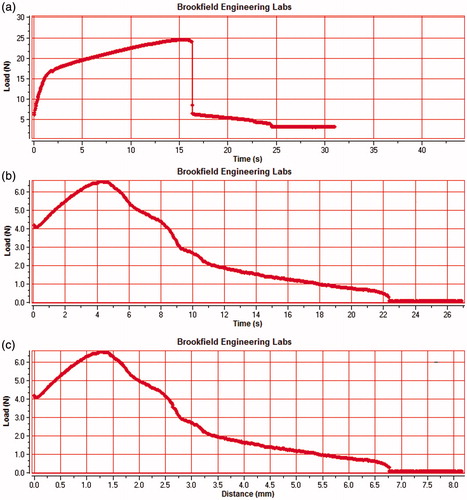
The LbL film was prepared by using novel spin-coating approach in which GO-CH-Zn Ncs was impregnated uniformly. The film was characterized for its mechanical and physiological properties by using texture analyzer. Textural analysis of film was used to determine the mean load, peak load, deformation at peak load, work, and final load; the results obtained after analysis shown in and ); plain pullulan film which has observed the deformation peak load at 16 s and 25 N force required to break the film, as shown in time (s) versus load (N). Similarly the LbL film has deformation peak found at 5 s and 6 N force required to break the film demonstrated in .
Figure 13. Texture graph of film (a) Plane pullulan film (Time versus Load), (b) LbL film (Time versus Load), and (c) LbL film (Distance versus Load).
Tensile strength
Tensile strength is a measure of rupture force of film to break down and it was analyzed by using CT3 Brookfield texture analyzer, the EquationEquation (1)(1)
(1) was used to measure the tensile strength of the film. Thickness and width of the film are important parameters to analyze the rupture force required to break the film, and tensile strength of the film was found to be 2.48 N/mm2.
Percentage elongation
Strength of film was used to measure the increasing length of film before it ruptures compared to initial length of film. The parameters used to calculate the tensile strength are useful for percentage elongation of film; by calculating the applied force and deformation length, the percentage elongation was found to be 108%.
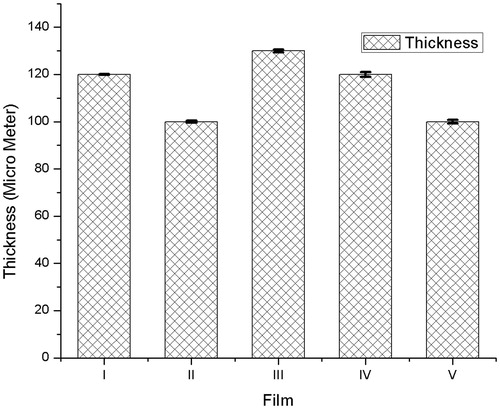
Thickness of film
The thickness of film was determined by using digital vernier caliper (Mitutoyo Digimatic Caliper, Japan). Thickness of film was obtained as 110 ± 5 to 120 ± 5 mm and shown in . The thickness of film shows consistency during the fabrication process, which leads to uniform distribution of Ncs in film.
Figure 14. Thickness of LbL film.
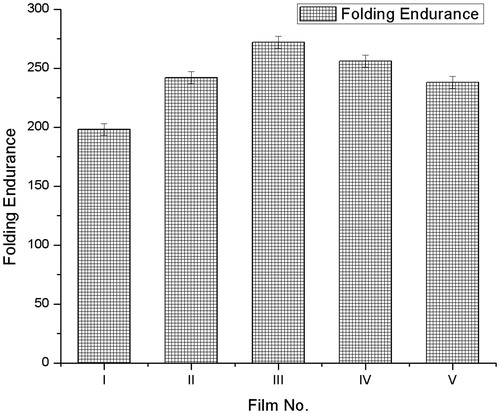
Folding endurance
The folding endurance test was used to measures the amount of folded film endures before its tensile strength falls below a standard value of 1-kg force. The folding endurance test measures a combination of tensile strength, stretch, and fatigue properties of film. At the breaking point of film, folding endurance was calculated and repeated in triplicate. From the obtained results of folding endurance of various films, the maximum folding endurance was 256 ± 5 found in film IV which may give ideal mechanical properties such as stretching and fatigue; other film parameters shown in .
Figure 15. Folding endurance of LbL film.
Percentage moisture content
The percentage moisture content was determined using EquationEquation (2)(2)
(2) which renders the presence of moisture level and stability of film. Initial (42.7 mg W0) and final weight (40.38 mg Wf) after drying at 110 °C was used to determine percentage moisture content and found to be 5.43 % complies that the percentage moisture content was less than 10 %. It suggest that the fabricated LbL film has an excellent stability, which would be rationally useful in biomedical applications.
Water solubility test
Water solubility test was carried out to determine the time-dependent solubility of LbL film into water; in the present investigation, the LbL film was immersed into water for 6 h and percentage water solubility was determined using EquationEquation (3)(3)
(3) enlisted above and it was found to be 72.91%, which corresponds to release characteristics of Ncs from the film.
Conclusion
Comparing the older fabrication of NCs with GO-CH-Zn, it is one pot and simplified strategy, which is more economical and less time consuming. The Ncs had greater antimicrobial potential compared to individual components such as GO, CH, Zn, etc., which was confirmed by zone of inhibition and broth dilution method. Cytotoxicity studies revealed that concentration ranging from 1 to 50 μg/mL is non-toxic to the normal cells. Pullulan was used as film former, which is biodegradable, water soluble. Novel approach of film fabrication was used which was spin coating and simpler than solvent casting, and there is no requirement of peeling sheet from the substrate. From the above summarized data, we can say that the GO and GO-based Ncs were successfully prepared with potential application as antimicrobial agents as well as technique used to fabricate LbL sheets. The Ncs-impregnated LbL sheets have wide application in pharmaceutical and biomedical science.
Acknowledgements
The authors are thankful to H. R. Patel Institute of Pharmaceutical Education and Research, Shirpur and North Maharashtra University, Jalgaon, for providing necessary facilities for carrying out the research effectively.
Disclosure statement
The authors report no conflicts of interest. The authors alone are responsible for the content and writing of this article.
References
- Akiyoshi K, Kobayashi S, Shichibe S, Mix D, Baudys M, Kim SW, et al. 1998. Self-assembled hydrogel nanoparticle of cholesterol-bearing pullulan as a carrier of protein drugs: complexation and stabilization of insulin. J Control Release. 54:313–320.
- Anandhavelu S, Thambidurai S. 2013. Single step synthesis of chitin/chitosan-based graphene oxide–ZnO hybrid composites for better electrical conductivity and optical properties. Electrochim Acta. 90:194–202.
- Ansari S, Giannelis EP. 2009. Functionalized graphene sheet – poly(vinylidene fluoride) conductive nanocomposites. J Polym Sci B Polym Phys. 47:888–897.
- Arora A, Sharma P, Katti DS. 2015. Pullulan-based composite scaffolds for bone tissue engineering: improved osteoconductivity by pore wall mineralization. Carbohydr Polym. 123:180–189.
- Bai H, Li C, Shi G. 2011. Functional composite materials based on chemically converted graphene. Adv Mater. 23:1089–1115.
- Bose S, Kuila T, Uddin ME, Kim NH, Lau AK, Lee JH. 2010. In-situ synthesis and characterization of electrically conductive polypyrrole/graphene nanocomposites. Polymer. 51:5921–5928.
- Chaudhari NS, Pandey AP, Patil PO, Tekade AR, Bari SB, Deshmukh PK. 2014. Graphene oxide based magnetic nanocomposites for efficient treatment of breast cancer. Mater Sci Eng C Mater Biol Appl. 37:278–285.
- Chook SW, Chia CH, Zakaria S, Ayob MK, Huang NM, Neoh HM, et al. 2015. Antibacterial hybrid cellulose–graphene oxide nanocomposite immobilized with silver nanoparticles. RSC Adv. 5:26263–26268.
- Das MR, Sarma RK, Saikia R, Kale VS, Shelke MV, Sengupta P. 2011. Synthesis of silver nanoparticles in an aqueous suspension of graphene oxide sheets and its antimicrobial activity. Colloids Surf B Biointerfaces. 83:16–22.
- Deshmukh PK, Ramani KP, Singh SS, Tekade AR, Chatap VK, Patil GB, et al. 2013. Stimuli-sensitive layer-by-layer (LbL) self-assembly systems: targeting and biosensory applications. J Control Release. 166:294–306.
- Fan H, Wang L, Zhao K, Li N, Shi Z, Ge Z, et al. 2010. Fabrication, mechanical properties, and biocompatibility of graphene-reinforced chitosan composites. Biomacromolecules. 11:2345–2351.
- Goenka S, Sant V, Sant S. 2014. Graphene-based nanomaterials for drug delivery and tissue engineering. J Control Release. 173:75–88.
- Guo P, Song H, Chen X. 2010. Hollow graphene oxide spheres self-assembled by W/O emulsion. J Mater Chem. 20:4867–4874.
- Indian Pharmacopoeia. 1996. Government of India, Ministry of Health and Family Welfare, Vol. II. Delhi: The Controller of Publication, p. 634.
- Jang S, Sohn H, Ko YC. 2013. Synthesis and characterization of soluble alkylalcohol-derivatized graphene oxide. Notes. 34:1237.
- Kimura-Suda H, Kajiwara M, Sakamoto N, Kobayashi S, Ijiro K, Yurimoto H, et al. 2013. Studies on bone metabolism by using isotope microscopy, FTIR imaging, and micro-Raman spectroscopy. J Oral Biosci. 55:61–65.
- Kuila T, Bose S, Hong CE, Uddin ME, Khanra P, Kim NH, et al. 2011. Preparation of functionalized graphene/linear low density polyethylene composites by a solution mixing method. Carbon. 49:1033–1037.
- Kuila T, Bose S, Mishra AK, Khanra P, Kim NH, Lee JH. 2012. Chemical functionalization of graphene and its applications. Prog Mater Sci. 57:1061–1105.
- Liu J, Cui L, Losic D. 2013. Graphene and graphene oxide as new nanocarriers for drug delivery applications. Acta Biomater. 9:9243–9257.
- Liu Y, Liu C-Y, Liu Y. 2011. Investigation on fluorescence quenching of dyes by graphite oxide and graphene. Appl Surf Sci. 257:5513–5518.
- Liu Y, Park M, Shin HK, Pant B, Choi J, Park YW, et al. 2014. Facile preparation and characterization of poly (vinyl alcohol)/chitosan/graphene oxide biocomposite nanofibers. J Indust Eng Chem. 20:4415–4420.
- Liu Y, Yu D, Zeng C, Miao Z, Dai L. 2010. Biocompatible graphene oxide-based glucose biosensors. Langmuir. 26:6158–6160.
- Novoselov KS, Geim AK, Morozov SV, Jiang D, Zhang Y, Dubonos SV, et al. 2004. Electric field effect in atomically thin carbon films. Science. 306:666–669.
- Pandey AP, Karande KP, More MP, Gattani SG, Deshmukh PK. 2013. Graphene based nanomaterials: diagnostic applications. J Biomed Nanotechnol. 10:179–204.
- Pandey AP, Singh SS, Patil GB, Patil PO, Bhavsar CJ, Deshmukh PK. 2015. Sonication-assisted drug encapsulation in layer-by-layer self-assembled gelatin-poly (styrenesulfonate) polyelectrolyte nanocapsules: process optimization. Artif Cells Nanomed Biotechnol. 43:413–424.
- Park S, Ruoff RS. 2009. Chemical methods for the production of graphenes. Nat Nanotechnol. 4:217–224.
- Patil GB, Ramani KP, Pandey AP, More MP, Patil PO, Deshmukh PK. 2013. Fabrication of layer-by-layer self-assembled drug delivery platform for prednisolone. Polym Plast Technol Eng. 52:1637–1644.
- Patil PO, Girase NM, Patil AG, Deshmukh PK, Bari SB. 2016. Facile green synthesis of reduced graphene oxide and fabrication of layer by layer self-assembled rGO@ chitosan@ rGO@ folic acid nanocomposite for possible biosensing application. J Bionanosci. 10:150–157.
- Pham TA, Choi BC, Lim KT, Jeong YT. 2011. A simple approach for immobilization of gold nanoparticles on graphene oxide sheets by covalent bonding. Appl Surf Sci. 257:3350–3357.
- Priya S, Rekha M, Sharma CP. 2014. Pullulan-protamine as efficient haemocompatible gene delivery vector: synthesis and in vitro characterization. Carbohydr Polym. 102:207–215.
- Ramanathan T, Abdala A, Stankovich S, Dikin D, Herrera-Alonso M, Piner R, et al. 2008. Functionalized graphene sheets for polymer nanocomposites. Nat Nanotechnol. 3:327–331.
- Rekha M, Sharma CP. 2007. Pullulan as a promising biomaterial for biomedical applications: a perspective. Trends Biomater Artif Organs. 20:116–121.
- Richtera L, Chudobova D, Cihalova K, Kremplova M, Milosavljevic V, Kopel P, et al. 2015. The composites of graphene oxide with metal or semimetal nanoparticles and their effect on pathogenic microorganisms. Materials. 8:2994–3011.
- Sanchez VC, Jachak A, Hurt RH, Kane AB. 2011. Biological interactions of graphene-family nanomaterials: an interdisciplinary review. Chem Res Toxicol. 25:15–34.
- Saranya D, Rajan R, Suganthan V, Murugeswari A, Raj NAN. 2015. Synthesis and characterization of pullulan acetate coated magnetic nanoparticle for hyperthermic therapy. Procedia Mater Sci. 10:2–9.
- Shen H, Zhang L, Liu M, Zhang Z. 2012. Biomedical applications of graphene. Theranostics. 2:283–294.
- Shen J, Shi M, Li N, Yan B, Ma H, Hu Y, et al. 2010. Facile synthesis and application of Ag-chemically converted graphene nanocomposite. Nano Res. 3:339–349.
- Stankovich S, Dikin DA, Dommett GH, Kohlhaas KM, Zimney EJ, Stach EA, et al. 2006. Graphene-based composite materials. Nature. 442:282–286.
- Wang Y, Li Y, Zhou Z, Zu X, Deng Y. 2011. Evolution of the zinc compound nanostructures in zinc acetate single-source solution. J Nanopart Res. 13:5193–5202.
- Wang Y, Li Z, Wang J, Li J, Lin Y. 2011. Graphene and graphene oxide: biofunctionalization and applications in biotechnology. Trends Biotechnol. 29:205–212.
- Yang K, Zhang S, Zhang G, Sun X, Lee S-T, Liu Z. 2010. Graphene in mice: ultrahigh in vivo tumor uptake and efficient photothermal therapy. Nano Lett. 10:3318–3323.
- Yang X, Tu Y, Li L, Shang S, Tao X-m. 2010. Well-dispersed chitosan/graphene oxide nanocomposites. ACS Appl Mater Interfaces. 2:1707–1713.
- Yang Y, Liu T. 2011. Fabrication and characterization of graphene oxide/zinc oxide nanorods hybrid. Appl Surf Sci. 257:8950–8954.
- Zhang K, Zhang LL, Zhao X, Wu J. 2010. Graphene/polyaniline nanofiber composites as supercapacitor electrodes. Chem Mater. 22:1392–1401.
- Zhao X, Zhang Q, Chen D, Lu P. 2010. Enhanced mechanical properties of graphene-based poly (vinyl alcohol) composites. Macromolecules. 43:2357–2363.
- Zhou L, Jiang H, Wei S, Ge X, Zhou J, Shen J. 2012. High-efficiency loading of hypocrellin B on graphene oxide for photodynamic therapy. Carbon. 50:5594–5604.