
 ?Mathematical formulae have been encoded as MathML and are displayed in this HTML version using MathJax in order to improve their display. Uncheck the box to turn MathJax off. This feature requires Javascript. Click on a formula to zoom.
Abstract
The aim of this study is to prepare and characterize intranasal delivery of morin hydrate loaded microemulsion for the management of Alzheimer’s diseases. After intranasal delivery, brain and blood drug concentrations were found to be higher for optimized morin hydrate loaded microemulsion as compared to plain morin hydrate. Significant (P < 0.05) reduction in assessed pharmacodynamic parameters was observed after intranasal administration of morin hydrate loaded microemulsion as compared to sham control group. Daily chronic treatment with morin loaded microemulsion till the 21st day significantly increased the memory in wistar rats with STZ-induced dementia.
Introduction
Alzheimer’s disease (AD) is an age-related progressive neurodegenerative disorder, characterized by progressive deterioration in cognitive functions in daily living activities leading to irreversible loss of neurons, cognition and formation of abnormal protein aggregates (Auld et al. Citation2002). In AD plaques in hippocampus, a part of brain encodes memories and other areas of cerebral cortex that are used in decision making and thinking (Sharma et al. Citation2016). Alzheimer’s disease has two major neuropathological features, these include extracellular accumulations mainly composed of amyloid-β (Aβ) peptide and intracellular neurofibrillar tangles of hyperphosphorylated tau protein (Drewes Citation2004). A number of cholinesterase inhibitors like donepezil, rivastigmine, tacrine, rivastigmine, etc., are used for the treatment of various cognitive disorders. However, the adverse effects associated with anticholinesterase drugs (donepezil, rivastigmine, galantamine) include anorexia, nausea, vomiting, insomnia, and diarrhea (Giacobini Citation2004). But this drug has a short half life and requires complex forms of administration. So there is a need to discover new drugs with better efficacy and less adverse effects. Morin hydrate is a choice of drug because it has antioxidant activity and inhibits two major neuropathological features in Alzheimer’s disease, these include extracellular accumulation of Aβ peptide and intracellular neurofibrillary tangles. Morin hydrate is a novel inhibitor of GSK3β that can reduce tau pathology in vivo and may have potential as a therapeutic agent in tauopathies (Gong et al. Citation2011). Morin hydrate is a poor water-soluble drug and is involved in hepatic first-pass effect, results in poor oral bioavailability that may decrease the efficacy and therapeutic plasma levels.
Intranasal delivery of morin hydrate loaded microemulsion is an approach to bypass the blood–brain barrier (BBB) and can directly deliver the drug into the brain by using nasal olfactory neurons (Ghalamfarsa et al. Citation2016). Most studies have utilized a simple morin aqueous solution via parenteral route to obtain the targeted pharmacological effect but have obvious disadvantages, such as low patient compliance, safety considerations, and high medication costs (Zhang et al. Citation2011). Intranasal delivery of morin hydrate is a potential strategy to overcome the barrier created by the BBB and is a promising option because of its non-invasiveness (Gabathuler Citation2010). The concentration–time profiles achieved after nasal administration are often similar to those after intravenous administration, resulting in a rapid onset of pharmacological activity. In the case of microemulsion, rapid drug absorption via highly vascularized mucosa may improve the brain drug concentration, which may lead to site-specific delivery to brain ultimately minimizing the side effects (Sintov et al. Citation2010).
Morin hydrate aqueous solubility is only 18 μg/ml, therefore it is necessary for the intranasal delivery to increase morin hydrate solubility. A microemulsion system may be an effective strategy to overcome this low aqueous solubility. Potential advantages of microemulsion as a drug delivery system are the enhancement of drug solubilization, higher drug-loading capacity and absorption across mucosal membranes (Talegaonkar et al. Citation2008).
In comparison with oral administration, intranasal drug delivery may provide an improvement in bioavailability while shortening tmax (Cho et al. Citation2012, Shinde et al. Citation2015). Thus keeping all these aspects in mind, the present system is designed to deliver intranasally the morin hydrate loaded microemulsion by using oil (Capmul MCM), surfactant (Cremophor EL), and (co-surfactant PEG-400). Oil (Capmul MCM) plays a vital role in ME formulation as it solubilizes the drug and helps in its absorption because it facilitates the passage of drug across the lipoidal biological membranes (Vyas et al. Citation2006). Selection of oil as a component of MEs is primarily based on the solubility of the drug used in it. The surfactant (Cremophor EL) is a basic component of microemulsion reported to inhibit the P-gp efflux and develops the space between the tight paracellular space by interacting with cell membranes and increases cellular uptake at the site of absorption at the nasal cavity which may result in absorption through transcellular (due to lipophilic nature) as well as paracellular route. This mechanism thereby increases the concentrations of the drug in the brain (Shinde et al. Citation2011). Microemulsion has shown to have increased plasma half-life and thus increased circulation time which helps the drug to remain in contact with BBB thereby increasing bioavailability to the brain. Thus, there is a pressing need to develop a morin hydrate microemulsion with improved bioavailability and, furthermore, to obtain successful therapeutic effects at a decreased dose (Fortuna et al. Citation2014).
The main aim of our study is to develop and evaluate morin hydrate loaded microemulsion and to investigate the potential of microemulsion via intranasal delivery; this is the first time to deliver the morin hydrate loaded microemulsion in AD in order to reduce the oxidative stress in brain. Furthermore, the characterization of microemulsion was carried out using several parameters such as globule size, polydispersity index, zeta potential (ZP) determination, percentage transmittance in vitro release study, pharmacokinetic study, and brain homogenate study, i.e., biochemical parameter, streptozotocin (STZ) induced animal model for brain targeting to reduce the oxidative stress in wistar rat.
Material and methods
Materials
All the chemicals were obtained from commercial suppliers and used as received: morin hydrate (Himedia Laboratories Pvt. Ltd., Mumbai, India), Castor oil, Cremophor EL (Himedia Labs, Himedia Laboratories Pvt. Ltd., Mumbai, India), Span 20 (Loba Chemie Pvt. Ltd., Mumbai, India), Tween 80 (Loba Chemie Pvt. Ltd., Mumbai, India), Polyethylene glycol 400 (Loba Chemie Pvt. Ltd., Mumbai, India), Disodium hydrogen phosphate (Himedia Laboratories Pvt. Ltd., Mumbai, India), Potassium hydrogen phosphate (Himedia Laboratories Pvt. Ltd., Mumbai, India), Sodium chloride TBA (Thiobarbituric acid) (Himedia Laboratories Pvt. Ltd., Mumbai, India), Sulfosalicylic acid (Himedia Laboratories Pvt. Ltd., Mumbai, India), Naphthylethylenediamine HCl (Himedia Laboratories Pvt. Ltd., Mumbai, India), Tris–HCl (Himedia Laboratories Pvt. Ltd., Mumbai, India), Capmul MCM (Abitec Corp, Columbus, OH), Oleic acid (Central Drug House, New Delhi, India), and Streptozotocin (Sigma Aldrich, St. Louis, MO). All other chemicals and solvents were of analytical reagent grade during the preparation and evaluation of formulation.
Preparation of morin hydrate loaded microemulsion
Estimation of solubility of morin hydrate in oils,surfactants and cosurfactants
The solubility of morin hydrate was studied in various oils, surfactants, and co-surfactants which were selected according to their applicability in nasal formulations.
The solubility of morin hydrate in various oils, surfactants and cosurfactants was determined by adding an excess of morin hydrate to a cap vial containing each of the selected vehicle (2 ml). The mixture was heated in a 40 °C water bath to facilitate the solubilization using a vortex mixer after sealing the vials. Mixtures were allowed to equilibrate in a shaker (Remi Equipments, Mumbai, India) at 25 °C for 48 h. The vials were centrifuged at 4000 rpm for 10 min after the equilibrium was achieved. The samples (500 μl of supernatant) were withdrawn and the content of microemulsion was quantified by UV–visible spectrophotometer (Shimadzu, Kyoto, Japan) at 374.7 nm after dilution with methanol (Pathak et al. Citation2014).
Preparation of phase diagrams
The pseudoternary phase diagrams of oil, surfactant, co-surfactant, and water were constructed using a water titration method to obtain the concentrations of components. Surfactant was blended with co-surfactant in fixed weight ratios (5:5, 6:4, 7:3, 8:2, and 9:1). Aliquots of each surfactant and co-surfactant mixture (Smix) were then mixed with oil at room temperature (25 °C). For each, phase diagram, the ratio of oil to the Smix was varied as 9:1, 8:2, 7:3, 6:4, 5:5, 4:6, 3:7, 2:8, and 1:9 (w/w) (Shahiwala and Dash Citation2010). Water was added drop-wise to each oil–mix mixture under vigorous stirring and then kept aside. After equilibrium, the samples were visually checked and determined as being clear microemulsion. Phase diagrams were constructed using CHEMIX School – Ternary plot phase diagram. Once the microemulsion region was identified, morin hydrate microemulsion was prepared by dissolving morin hydrate into the oil–Smix mixture, followed by the addition of required amount of water with stirring. The resultant microemulsions were tightly stored at ambient temperature, and their physical stability was measured by observing periodically the occurrence of phase separation.
Characterization of the microemulsion
Globule size, polydispersity index determination, and zeta potential determination
The globule size and polydispersity index (PDI) of the microemulsion were determined by light scattering based on laser diffraction using the particle size analyzer (Beckman Coulter, Brea, CA) and ZP was also measured by the same instrument.
Percentage transmittance
A value of percentage transmittance closer to 100% indicated that the optimized formulation was clear, transparent and increasingly stable. Transparency of emulsion was determined in terms of percentage transmittance determined using spectrophotometer at 650 nm (UV, 1601, 220X Shimadzu, Kyoto, Japan) wavelength against Capmul MCM oil as a blank.
pH measurement
pH of the each formulation was determined by using pH meter (Equiptronics, Model EQ-610, Mumbai, India). The pH meter was first calibrated using solutions of pH 4.5 and 7.
Viscosity measurement
The viscosity was determined using rotational viscosity measuring device coupled with concentric cylinders (Brookfield Rheometer, Model-RS3CPS230LS, Middleboro, MA).
Drug loading
The entrapment efficiency of morin hydrate loaded microemulsion was determined by a centrifugation method. Briefly, 20 μl methanol was added into drug-loaded microemulsion, followed by centrifugation for 10 min at 20 000 rpm. The supernatant was separated and the centrifuge tubes were washed thrice with distilled water. The free drug concentration was determined by UV–visible spectrophotometric analysis at 374.7 nm. Drug loading of morin hydrate loaded microemulsion was calculated as per equations given below. All the measurements were performed in triplicate.
where WA is the amount of drug added to formulation, WF is the amount of free drug, and WO is the weight of oil phase (Agrawal et al. Citation2015).
In vitro drug release study
Franz diffusion cells with a dialysis tubing cellulose membrane having average width 25 mm were used to determine the release rate of morin hydrate loaded microemulsion by the methods reported by Moghimipour et al. (Citation2013). Each diffusion cell was filled with 25 ml of phosphate buffer (pH −5.5). The receptor fluid was constantly stirred by externally driven magnetic bars at 300 rpm throughout the experiment. Morin hydrate loaded microemulsion (5 g) was accurately weighed and placed in donor compartment. At 15, 30, 45, 60, 75, 90, 120, 150, 180, and 210 min time intervals, 2 ml sample was removed from receptor for spectrophotometric determination and replaced immediately with an equal volume of fresh receptor medium. Samples were analyzed by UV visible spectrophotometer at 374.7 nm. The results were plotted as cumulative released drug percentage versus time (Moghimipour et al. Citation2013).
Physical stability studies
Optimized morin loaded microemulsion formulations were kept for a period of three months at room temperature and refrigerated conditions. After three months of storage, samples withdrawn were reconstituted into microemulsion and were subjected to test for drug content, particle size, and percentage transmittance (Patel et al. Citation2013).
Pharmacological studies
The experimental studies were carried out on wistar rats (200–250) obtained from central animal house of ISF College of Pharmacy, Moga, Punjab (India). The animals were kept in polyacrylic cages and maintained under standard housing conditions (room temperature 22 ± 20 °C and relative humidity of 60–65%) with 12 h light/dark reverse cycle (lights on at 7 AM). The food in the form of dry pallets and water were made available ad libitum. All behavioral experiments were carried out between 20 and 24 h. Experimental protocols were approved by Institutional Animal Ethical Committee (IAEC) of ISFCP, Moga (Approval No. IAEC/CPCSEA/M17/P299, dated: 10 December 2015) and were conducted as per the CPCSEA guidelines for animal experimentation and care.
Intracerebroventricular administration of streptozotocin
Rats were anaesthetized with ketamine (80 mg/kg, i.p.) and xylazine (5 mg/kg, i.p.). The head was placed in position in the stereotaxic apparatus (Stoelting Co., Wood Dale, IL). A midline sagittal incision was made in the scalp and two holes were drilled through the skull for placement of infusion cannula into the lateral cerebral ventricles using following coordinates: 0.8 mm posterior to bregma; 1.5 mm lateral to sagittal suture; 3.6 mm ventral from the surface of the brain. STZ was dissolved in citrate buffer (pH 4.4) just prior to administration and slowly injected (1 μl/min) (infusion pump QSI 53311) through the cannula using Hamilton microsyringe in a volume of 10 μl into each lateral cerebral ventricle (bilateral ICV) on day 1 and 3 (Deshmukh et al. Citation2009).
Drug treatment schedule
Experimental protocol consists of four groups, six animals were used in each group.
Group 1: Sham control group.
Group 2: Disease control group received STZ on the 1st and 3rd day (3 mg/kg ICV bilaterally) dissolved in citrate buffer in volume of 10 μl in each ventricle.
Group 3: [STZ (3 mg/kg ICV)+morin hydrate (160 μg/40 μl intranasal)] was given for 14 days from day 7th to 21nd, respectively.
Group 4: [STZ (3 mg/kg ICV)+morin hydrate loaded microemulsion (ME) (160 μg/40 μl intranasal)] was given for 14 days from day 7th to 21nd day from the first hour after the ICV-STZ infusion.
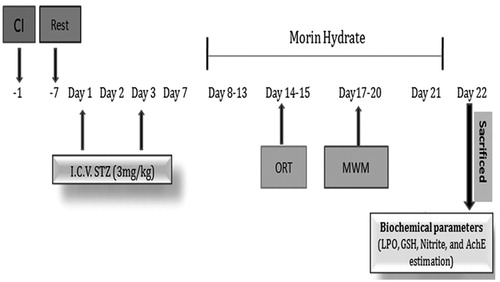
Object recognition test was performed on 14th and 15th day. Morris water maze (MWM) was performed on 17th, 18th, 19th, and 20th day and animals were sacrificed on 22nd day and biochemical parameters were estimated.
Experiment procedure and treatment schedule
Experimental protocol and treatment schedule of Huntington’s disease are mentioned in .
Figure 1. Experiment procedure and treatment schedule. CI: cannula implantation; ICV-STZ: intracerebroventricular streptozotocin; ORT: object recognition task; MWM: Morris water maze.
Behavioral assessment
Object recognition task (ORT)
The rats were acclimated to the arena (60 × 60 × 40 cm for rats) without objects for 30–45 min before testing. The ORT consisted of two trial periods (T1 and T2) separated by a 24-h intertrial period. The time required for each animal to complete 15 s of total exploration of the two identical objects, as shown by placing its nose within 2 cm of the object, was determined, with a cut off of 240 s. For the retention trial (T2) conducted 24 h later, one of the objects presented in T1 was replaced with a novel object. A criterion of minimal level of object exploration was used to exclude animals with low levels of spontaneous exploration; thus, only animals having a minimal level of object exploration of ≥5 s during the retention trial T2 (novel + familiar ≥5 s) were included (de Bruin and Pouzet Citation2006).
Morris water maze test
Spatial learning and memory of animals were tested in a MWM. It consisted of a circular water tank (180 cm diameter, 60 cm height) filled with water (25 ± 1 °C) to a depth of 40 cm. A non-toxic water dispersible emulsion was used to render the water opaque. Four equally spaced locations around the edge of the pool (North, South, East, and West) were used as start points, which divided the pool into four quadrants. An escape platform (10 cm in diameter) was placed in the pool 2 cm below the surface of water. The escape platform was placed in the middle of one of the randomly selected quadrants of the pool and kept in the same position throughout the entire experiment (north-east for this study). Before the training started, the rats were allowed to swim freely into the pool for 120 s without platform (Patil et al. Citation2009).
Biochemical analysis
All the biochemical parameters were measured in the brain homogenate on day 22.
Brain homogenate preparation
Animals were sacrificed by decapitation and brains were removed and rinsed with ice-cold isotonic saline. Whole brain tissue samples were taken and then homogenized together with ice-cold 0.1 mol/l phosphate buffer (pH 7.4) 10 times (w/v). Then homogenate was centrifuged for 15 min at 10 000×g for 15 min and aliquots of supernatant were separated and used for biochemical estimation.
Acetylcholinesterase assay
The quantitative measurement of AChE activity in brain was performed according to the method described by Ellman et al. (Citation1961). The assay mixture contained 0.05 ml of supernatant, 3 ml of 0.01 M sodium phosphate buffer (pH 8), 0.10 ml of acetylthiocholine iodide and 0.10 ml of DTNB (Ellman reagent). The change in absorbance was measured immediately at 412 nm spectrophotometer (Shimadzu, UV-1700, Kyoto, Japan). The AChE activity in the supernatant was expressed as nM/mg protein.
Estimation of malondialdehyde (MDA)
The quantitative measurement of MDA – end product of lipid peroxidation – in brain homogenate was performed according to the method of Wills (Citation1966). The amount of MDA was measured after its reaction with thiobarbituric acid at 532 nm using spectrophotometer (Shimadzu, UV-1700, Kyoto, Japan). The concentration of MDA was determined from a standard curve and expressed as nM/mg protein.
Estimation of reduced glutathione (GSH)
Reduced glutathione in brain was estimated according to the method described by Ellman (Citation1959). One milliliter supernatant was precipitated with 1 ml of 4% sulfosalicylic acid and cold digested at 4 °C for 1 h. The samples were centrifuged at 1200×g for 15 min. To 1 ml of the supernatant, 2.7 ml of phosphate buffer (0.1 M, pH 8) and 0.2 ml of 5,5′dithiobis (2-nitrobenzoic acid) (DTNB) were added. The yellow color that developed was measured immediately at 412 nm using a spectrophotometer. The concentration of glutathione in the supernatant was determined from a standard curve and expressed as μM/mg protein.
Estimation of nitrile
The accumulation of nitrile in the supernatants, an indicator of the NO production, was determined by a colorimetric assay utilizing Greiss reagent [0.1% N-(1-naphthyl) ethylenediamime dihydrochloride, 1% sulfanilamide, and 2.5% phosphoric acid] by method as described by Green et al. (Citation1982). Equal volumes of supernatant and Greiss reagent were mixed gently, and this mixture was incubated for 10 min at room temperature in the dark. Absorbance at 540 nm was measured with a Perkin Elmer Lambda 20 UV VIS spectrophotometer (Shimadzu, Kyoto, Japan). The concentration of nitrile in the supernatant was determined from a sodium nitrile standard curve.
Bioanalytical method development by HPLC method
Optimized analytical method was already developed which is a selective and sensitive method for analysis of morin hydrate on HPLC using UV detection by PDA detector. Mobile phase used was a mixture of 10 mM potassium dihydrogen phosphate (pH 5.0) and acetonitrile (60:40, v/v) (Kumar and Muralidharan Citation2015).
Instrumentation and conditions
HPLC analysis was performed using Waters 515 Series pumps combined with a Waters PDA 2998 series photo diode array detector. The column used was Agilent® C18 bonded silica (5 μm, 4.6 × 150 mm). The mobile phase used was a 10 mM potassium dihydrogen phosphate (pH 5.0) and acetonitrile (60:40, v/v) and flow rate of 1.0 ml/min. The elution was monitored at λmax 260 nm. Analyst weighing, for preparation of calibration standards and quality controls, was done on a microbalance, Mettler-Toledo AB 204-S (Columbus, OH).
Method development for detection of morin hydrate in plasma
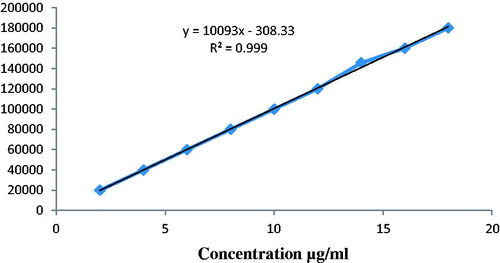
Animal plasma was taken in which 0.1 ml of drug solution of known concentration was spiked to get a linearity range from 2 μg to 18 μg/ml and 0.8 ml of acetonitrile as ppt agent was added to get total volume 1 ml. This solution was vortexed 4–5 min and then centrifuged at 10,000 rpm for 10 min at 4 °C. 0.2 ml of supernatant liquid was taken and diluted with methanol phase for up to 2 ml, this solution was injected to get response for linearity.
HPLC method development for brain homogenate studies
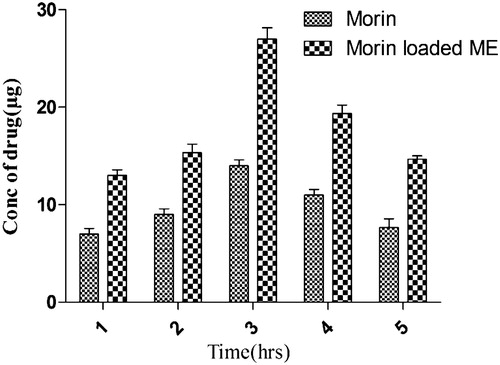
Blank brain homogenate was taken in which 0.1 ml of drug solution of known concentration was spiked to get a linearity range from 2 to 18 μg/ml and 0.8 ml of acetonitrile as precipitating agent was added to get total volume of 1 ml. This solution was vortexed 4–5 min and then centrifuged at 10,000 rpm for 10 min at 4 °C. 0.2 ml of supernatant liquid was taken and diluted with methanol for up to 2 ml, this solution was injected to get response for linearity. Animal sample – after dosing the animal was sacrificed within time interval of 1, 2, 3, and 4 h and brain was isolated subjected to homogenize in tissue homogenizer with saline solution. The homogenized material was then subjected to centrifuge at 10 000 rpm for 10 min at 4 °C and 0.2 ml supernatant solution was collected and processed as above.
Statistical analysis
All the results are expressed as mean ± standard deviation. The treated groups were compared with control by applying the analysis of variance (ANOVA). The statistical analysis was carried out at Graph Pad Software Corp. (San Diego, CA). P values <0.05 were considered significant.
Results and discussion
Formulation development
Estimation of solubility of morin hydrate in oils, surfactants, and co-surfactants
Morin hydrate exhibited good solubility in Capmul MCM (14.7 ± 0.58 mg/ml) as compared to other oils. The solubility was better in Cremophor EL (10.5 ± 0.42 mg/ml) and PEG-400 (9.6 ± 0.38 mg/ml) which were chosen as surfactant and co-surfactant, respectively. Solubility of morin hydrate in various vehicles at 25 °C temperature after incubating for 24 h is shown in .
Table 1. Solubility of morin hydrate in oils, surfactants and co-surfactants.
Preparation of microemulsion by phase diagram study
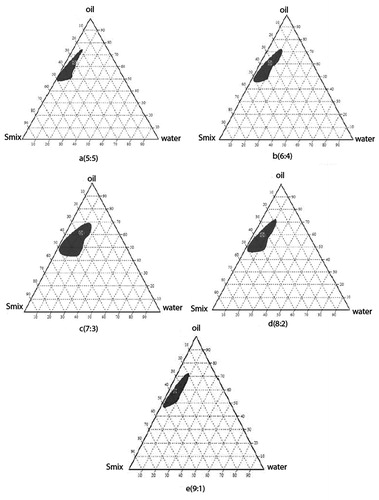
Development of pseudo-phase diagrams was performed to decide the region of microemulsion, DDW, Capmul MCM, Cremophor EL, and PEG-400 are referred to as H2O, Oil, S, and CoS, respectively. The formulation of morin hydrate microemulsion was optimized by evaluating the microemulsion regions using pseudoternary phase diagrams. A pseudoternary phase diagram of the investigated quaternary system water/Capmul MCM/Cremophor El/PEG-400 is presented in and it shows phase diagrams with different S/CoS. The shaded areas indicate the clear o/w microemulsion system. The phase study revealed that the maximum emulsification region was found to be 7:3 surfactant/co-surfactant ratio.
Figure 2. Pseudoternary phase diagram with varying ratios of the investigated quaternary system water/Cremophor EL/PEG-400/Capmul MCM with (a) Smix in the ratio of 5:5, (b) Smix in the ratio of 6:4, (c) Smix in the ratio of 9:1, (d) Smix in the ratio of 7:3, and (e) Smix in the ratio of 8:2. The shaded areas indicate the clear w/o microemulsion system. The phase study revealed that the maximum emulsification region was found to be 7:3 surfactant/co-surfactant ratio.
Characterization of microemulsion
Nasal administration volume is limited (about 150 μl in human), a high drug-solubilizing capacity is preferred as shown in . Morin hydrate microemulation achieved morin hydrate solubilities above 9.04 ± 0.36 mg/ml, whereas its aqueous solubility is only 18 μg/ml. F1 is the blank optimized microemulsion composition as shown in and F2 is the optimized drug loaded microemulsion as shown in .
Table 2. Composition of optimized blank microemulsion.
Table 3. Physicochemical properties of morin hydrate-loaded microemulsion.
Globule size and polydispersity index (PDI)
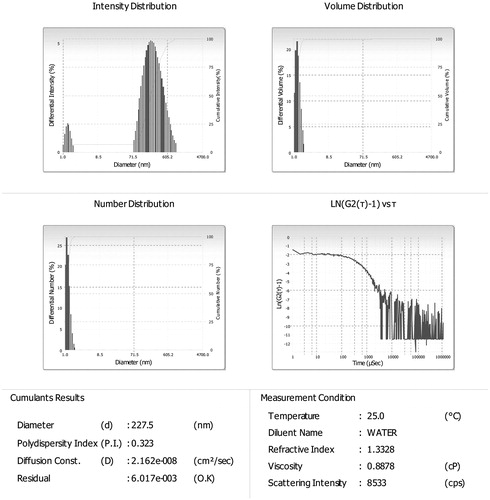
Globule size and polydispersity index of optimized (F2) formulation were found to be 227.5 and 0.323 nm as shown in .
Figure 3. Size and size distribution images of optimized morin hydrate loaded microemulsion. Globule size and polydispersity index of optimized (F2) formulation were found to be 227.5 and 0.323 nm, respectively.
Particle charge (zeta potential)
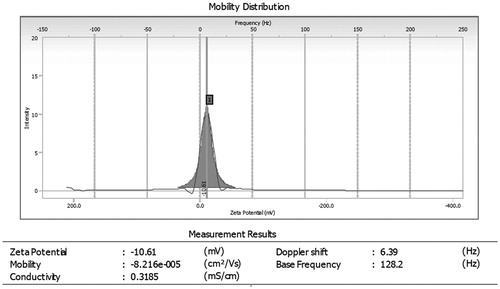
Particle charge was determined by using Beckman Coulter Counter particle analyzer (Brea, CA) and ZP of optimized morin loaded microemulsion (F2) was found to be −10.61 mV as shown in .
Figure 4. Zeta potential of optimized morin hydrate loaded microemulsion. Zeta potential of optimized morin loaded microemulsion (F2) was found to be (−10.61 mV).
Percentage transmittance
The percentage transmittance of optimized formulation (F2) was found to be 95.03 ± 2. A value of percentage transmittance closer to 100% indicated that the optimized formulation was clear and thermodynamically stable.
Drug content
The drug content of optimized formulation was found to be 98.2 ± 0.4% which is compared to reference standard and shows good loading capacity. The higher value of drug content ensured minimum drug loss during various stages of formulation development, and hence, authenticated the method of preparation.
pH measurement
The formulation pH was found to be 6.1 which lies within the pH range of the nasal cavity (5.5–7.5). Nasal irritation is minimized when formulation is delivered with pH, in the range of 5.5–6.5.
In vitro drug release of morin hydrate loaded microemulsion
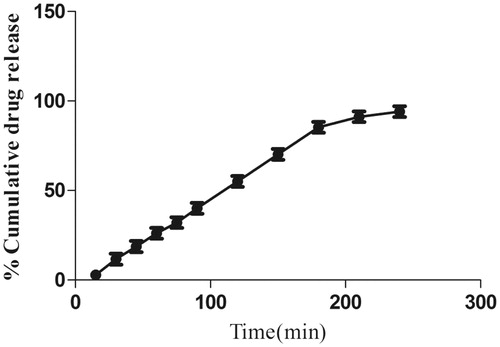
In vitro dissolution profile of morin hydrate loaded microemulsion is phosphate buffer with pH 5.5. The release profile of formulation (F2) showing 94.05% release in 240 min is shown in which is comparable with other microemulsion formulation (Patel et al. Citation2013). The small globule size and complete dissolution of drug in microemulsion permitted faster drug release rate from microemulsion.
Figure 5. Percentage in vitro release profile of morin hydrate loaded microemulsion. Each point represents mean ± SD (n = 3). The release profile of formulation (F2) showing 94.05% release in 240 min.
Physical stability studies of morin loaded microemulsion
Physical stability studies of morin hydrate loaded microemulsion formulation were carried out for 3 months on both higher temperature (25 ± 2 °C) and refrigerated temperature (4 ± 2 °C). Stability study parameters: globule size, % transmittance and drug content were optimized. As clearly observed from , formulation stored at 4 ± 2 °C for 3 months was found to be more stable in the term of % transmittance and particle size (nm) in comparison to formulation stored at 25 ± 2 °C. So we can conclude from the above result that microemulsion formulation should be stored at 4 ± 2 °C.
Table 4. Physical stability studies of morin loaded microemulsion.
Pharmacological studies
Behavioral assessment
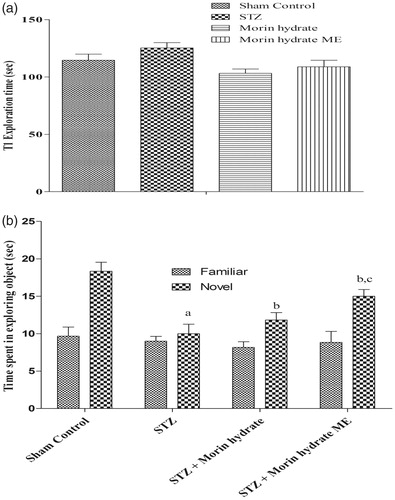
Effect of morin hydrate loaded microemulsion (ME) on memory performance in object recognition in ICV-STZ infused rats. On day 14 following ICV-STZ infusion, during the first test (T1), when both the objects are similar, time required to achieve 15 s of object exploration was similar in all the treatment groups (P > 0.05) (). Whereas, on day 15, when animals were exposed with familial and novel objects they showed significant discrimination. Two-way ANOVA analysis indicated overall significant effect of treatment. During T2 on day 15, when animals presented with familial and novel object, STZ-infused rats were not able to discriminate them and spent equal time to explore the familiar and novel object. Whereas, treatment with morin hydrate loaded microemulsion significantly attenuated STZ-induced object discriminative ability in rats and the rats spent more time on novel object, when exposed to familial and novel object ().
Figure 6. Effect of morin hydrate on memory performance in object recognition test in ICV-STZ infused rats (a) acquisition phase, trail-1 and (b) retention phase, trail-2. Values are expressed as aP < 0.05 versus sham control, bP < 0.05 versus STZ-; cP < 0.05 versus STZ + morin hydrate.
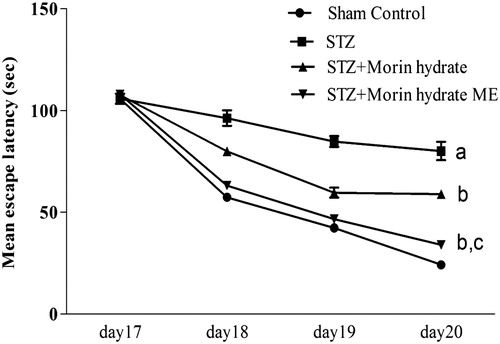
Effect of morin hydrate loaded microemulsion on memory performance in Morris water (MWM) task in ICV-STZ infused rats. Repeated measure two way ANOVA analysis indicated overall significant effect of treatment, time and a time × treatment interaction. Morin hydrate loaded microemulsion (160 μg/40 μl) treated rats show significant decreases in mean escape latencies time as compared to STZ group. On day 17, there was no significant difference between the mean escape latencies of all groups. But the mean escape latencies were found to be significantly prolonged on day 18, 19, and 20 in the STZ control rats as compared with normal control, indicating their inability to learn the task. But the STZ induced acquisition deficit was significantly attenuated by chronic treatment (for 11 days) with Morin (160 μg/40 μl). Whereas, on day 19 and 20, chronic treatment with morin hydrate loaded microemulsion (160 μg/40 μl) in ICV-STZ infused rats showed significant increase in escape latency as compared with STZ control rats, worsening the acquisition deficit ().
Figure 7. Effect of morin hydrate loaded microemulsion (ME) on mean latency in Morris water maze (MWM) task in ICV-STZ infused rats. aP < 0.05 versus sham control; bP < 0.05 versus STZ; cP < 0.05 versus STZ + morin hydrate.
Biochemical parameters
Effect of morin hydrate and morin hydrate loaded microemulsion (ME) on lipid peroxidation, glutathione, nitrite, and acetylcholinesterase in ICV-STZ administered rats. ICV administration of STZ (3 mg/kg) on 1st and 3rd day significantly (P < 0.001) increased lipid peroxidation, nitrite concentration, acetylcholinesterase, and depleted glutathione enzyme activity as compared to normal control group (). Treatment with morin hydrate (160 μg/μl) and morin hydrate loaded microemulsion (160 μg/μl) significantly (P < 0.05) attenuated lipid peroxidation, nitrite concentration, acetylcholinesterase, and restored levels of antioxidant enzyme glutathione as compared to STZ group. Morin hydrate loaded microemulsion (160 μg/μl) decreased lipid peroxidation, nitrite concentration, acetylcholinesterase, and restored glutathione levels were significant (P < 0.001) as compared to morin hydrate (160 μg/μl).
Table 5. Various parameters of oxidative stress.
Table 6. Concentration of drug reaching the blood at different time intervals.
HPLC method development for plasma
The overlay chromatogram of morin hydrate in plasma and standard curve of morin hydrate in plasma were prepared as shown in and . The linearity plot of morin hydrate in plasma was prepared in mobile phase and it was a mixture 10 mM potassium dihydrogen phosphate (pH 5.0) and acetonitrile (60:40 v/v).
Figure 8. Overlay chromatogram of morin hydrate in plasma.
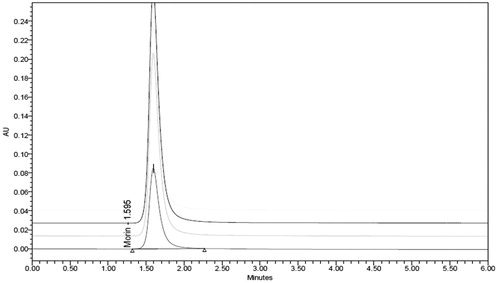
Figure 9. Standard curve of morin hydrate in plasma.
Concentration of drug reaches into blood after 1, 2, 3, 4, and 5 h as described in . Plain morin hydrate showed lower drug concentration as compared to optimized prepared morin hydrate loaded microemulsion formulation. In case of morin hydrate loaded microemulsion, 0.094 μg/ml drug concentration reached into systemic circulation after 3 h but in case of plain morin hydrate drug reached were 0.0023 μg/ml. It is clearly indicated from the above result that brain drug concentration of morin hydrate increases significantly by using nasal delivery of microemulsion.
Brain drug concentration
Morin hydrate loaded microemulsion increases the brain drug concentration as compared to plain morin hydrate as shown in .
Figure 10. Concentration of morin hydrate in brain versus time for plain morin hydrate (IN) and morin hydrate loaded microemulsion (IN).
Conclusions
Microemulsion systems consisting of Capmul MCM, Cremophor EL, and PEG-400 showed high solubilization capacities for morin hydrate. The development of optimized microemulsion formulations containing morin hydrate was confirmed in pseudo-ternary phase diagrams, and their physicochemical properties were optimized. The release profile of morin loaded microemulsion showing 94.05% release in 240 min and having small globule size and complete dissolution of drug in microemulsion eventually allowed drug release at faster rate from microemulsion. Rapid onset of action and improved bioavailability after intranasal administration of morin hydrate loaded microemulsion were achieved. The microemulsion system developed may be a suitable and effective intranasal formulation for the administration of morin hydrate. In vivo study revealed that morin hydrate microemulsion attenuated STZ-induced behavioral and biochemical alteration and restored cognitive functions in rats. On the basis of the observed outcomes, it would be safe to conclude that the improvement in learning and memory in STZ induced rats is due to antioxidant properties of morin hydrate. Thus, it can be concluded from the above observations that microemulsion containing morin hydrate is found to be effective in the management of AD.
Disclosure statement
The authors have no conflict of interest. The authors are solely responsible for the submitted manuscript.
Related Research Data
References
- Agrawal AG, Kumar A, Gide PS. 2015. Self emulsifying drug delivery system for enhanced solubility and dissolution of glipizide. Colloids Surf B Biointerfaces. 126:553–560.
- Auld DS, Kornecook TJ, Bastianetto S, Quirion R. 2002. Alzheimer's disease and the basal forebrain cholinergic system: relations to beta-amyloid peptides, cognition, and treatment strategies. Prog Neurobiol. 68:209–245.
- Cho H-J, Ku W-S, Termsarasab U, Yoon I, Chung C-W, Moon HT, et al. 2012. Development of udenafil-loaded microemulsions for intranasal delivery: in vitro and in vivo evaluations. Int J Pharm. 423:153–160.
- de Bruin N, Pouzet B. 2006. Beneficial effects of galantamine on performance in the object recognition task in Swiss mice: deficits induced by scopolamine and by prolonging the retention interval. Pharmacol Biochem Behav. 85:253–260.
- Deshmukh R, Sharma V, Mehan S, Sharma N, Bedi K. 2009. Amelioration of intracerebroventricular streptozotocin induced cognitive dysfunction and oxidative stress by vinpocetine—a PDE1 inhibitor. Eur J Pharmacol. 620:49–56.
- Drewes G. 2004. MARKing tau for tangles and toxicity. Trends Biochem Sci. 29:548–555.
- Ellman GL, Courtney KD, Andres V, Featherstone RM. 1961. A new and rapid colorimetric determination of acetylcholinesterase activity. Biochem Pharmacol. 7:88–95.
- Ellman GL. 1959. Tissue sulfhydryl groups. Arch Biochem Biophys. 82:70–77.
- Fortuna A, Alves G, Serralheiro A, Sousa J, Falcão A. 2014. Intranasal delivery of systemic-acting drugs: small-molecules and biomacromolecules. Eur J Pharm Biopharm. 88:8–27.
- Gabathuler R. 2010. Approaches to transport therapeutic drugs across the blood–brain barrier to treat brain diseases. Neurobiol Dis. 37:48–57.
- Ghalamfarsa G, Hojjat-Farsangi M, Mohammadnia-Afrouzi M, Anvari E, Farhadi S, Yousefi M, et al. 2016. Application of nanomedicine for crossing the blood–brain barrier: theranostic opportunities in multiple sclerosis. J Immunotoxicol 13:603–619.
- Giacobini E. 2004. Cholinesterase inhibitors: new roles and therapeutic alternatives. Pharmacol Res. 50:433–440.
- Gong EJ, Park HR, Kim ME, Piao S, Lee E, Jo D-G, et al. 2011. Morin attenuates tau hyperphosphorylation by inhibiting GSK3β. Neurobiol Dis. 44:223–230.
- Green LC, Wagner DA, Glogowski J, Skipper PL, Wishnok JS, Tannenbaum SR. 1982. Analysis of nitrate, nitrite, and [15N]nitrate in biological fluids. Anal Biochem. 126:131–138.
- Kumar MR, Muralidharan S. 2015. Method development and validation of Bio Flavanoid-Morin hydrate by RP-HPLC in human plasma. J Young Pharm. 7:195.
- Moghimipour E, Salimi A, Eftekhari S. 2013. Design and characterization of microemulsion systems for naproxen. Adv Pharm Bull. 3:63–71.
- Patel RB, Patel MR, Bhatt KK, Patel BG. 2013. Formulation consideration and characterization of microemulsion drug delivery system for transnasal administration of carbamazepine. Bull Faculty Pharm Cairo Univ. 51:243–253.
- Pathak R, Dash RP, Misra M, Nivsarkar M. 2014. Role of mucoadhesive polymers in enhancing delivery of nimodipine microemulsion to brain via intranasal route. Acta Pharm Sin B. 4:151–160.
- Patil SS, Sunyer B, Höger H, Lubec G. 2009. Evaluation of spatial memory of C57BL/6J and CD1 mice in the Barnes maze, the Multiple T-maze and in the Morris water maze. Behav Brain Res. 198:58–68.
- Shahiwala A, Dash D. 2010. Preparation and evaluation of microemulsion based formulations for rapid-onset intranasal delivery of zonisamide. Adv Sci Lett. 3:442–446.
- Sharma D, Bansal PK, Mishra N. 2016. Role of lipidic nanoparticles for management of Alzheimer's diseases. Asian J Biomater Res. 2:1–8.
- Shinde RL, Bharkad GP, Devarajan PV. 2015. Intranasal microemulsion for targeted nose to brain delivery in neurocysticercosis: role of docosahexaenoic acid. Eur J Pharm Biopharm. 96:363–379.
- Shinde RL, Jindal AB, Devarajan PV. 2011. Microemulsions and nanoemulsions for targeted drug delivery to the brain. Curr Nanosci. 7:119–133.
- Sintov AC, Levy HV, Botner S. 2010. Systemic delivery of insulin via the nasal route using a new microemulsion system: in vitro and in vivo studies. J Control Release. 148:168–176.
- Talegaonkar S, Azeem A, Ahmad FJ, Khar RK, Pathan SA, Khan ZI. 2008. Microemulsions: a novel approach to enhanced drug delivery. Recent Pat Drug Deliv Formul. 2:238–257.
- Vyas TK, Babbar A, Sharma R, Singh S, Misra A. 2006. Intranasal mucoadhesive microemulsions of clonazepam: preliminary studies on brain targeting. J Pharm Sci. 95:570–580.
- Wills E. 1966. Mechanisms of lipid peroxide formation in animal tissues. Biochem J. 99:667.
- Zhang J, Peng Q, Shi S, Zhang Q, Sun X, Gong T, et al. 2011. Preparation, characterization, and in vivo evaluation of a self-nanoemulsifying drug delivery system (SNEDDS) loaded with morin-phospholipid complex. Int J Nanomedicine. 6:3405–3414.