
 ?Mathematical formulae have been encoded as MathML and are displayed in this HTML version using MathJax in order to improve their display. Uncheck the box to turn MathJax off. This feature requires Javascript. Click on a formula to zoom.
Abstract
A reliable and efficient drug delivery system using PCL–PEG–PCL copolymers was established for the anti-cancer compound sulforaphane (SF) in this study. Encapsulated SF by PCL–PEG–PCL nanoparticles led to formation of SF-loaded PCL–PEG–PCL micelles. Micelles characterization and stability, the particle size and their morphology were determined by DLS and AFM. The loading efficiency of SF was 19.33 ± 1.28%. The results of AFM showed that the micelles had spherical shapes with the size of 107 nm. In vitro release of SF from SF-entrapped micelles was remarkably sustained. The cytotoxicity of free SF, PCL–PEG–PCL and SF/PCL–PEG–PCL micelles was analysis by MTT colorimetric assay on MCF-7, 4T1 and MCF10A cell lines. Expression levels of BCL-2, PARP, COX-2, Caspase-9 and ACTB genes were quantified by real-time PCR. Flow cytometry analysis was performed using the Annexin V-FITC Apoptosis Detection Kit to evaluate the apoptotic effects of free SF compared with SF/PCL–PEG–PCL micelles. Study of the in vivo pharmacokinetics of the SF-loaded micelles was carried out on SF-loaded PCL–PEG–PCL micelles in comparison with free SF. The results of in vivo experiments indicated that the SF loaded micelles significantly reduced the tumor size. In vivo results showed that the multiple injections of SF-loaded micelles could prolong the circulation period and increase the therapeutic efficacy of SF. Also, in comparison with the free-SF solution, encapsulation of the SF in micelles increased the mean residence time from 0.5 to 4 h and the area under the concentration–time curve up to 50 folds.
Introduction
Sulforaphane (SF) is an anti-tumor compound which can reduce, postpone or reverse the process of carcinogenesis. It is known as a promising and important anti-carcinogen in several types of cancers (Facchini et al. Citation2011, Sharma and Kapoor Citation2015). SF is an isothiocyanate compound found in cruciferous vegetables, especially in broccoli, cauliflower, Brussels sprouts, cabbage and kale. It is very difficult to manufacture and allocate SF in foods and pharmaceutical industries due to its instability and sensitivity to oxygen, heat and alkaline environments (Do et al. Citation2010). It has been revealed that SF has cancer chemo-protection activity through different mechanisms including apoptosis, cell cycle arrest, anti- inflammatory activity and inhibition of angiogenesis, and metastasis (Bertl et al. Citation2006, Danafar Citation2016a, Gupta et al. Citation2010). Biodegradable polymeric nanoparticles are often used for drug-controlled release in advanced anticancer drug delivery systems (Al-Musawi et al. Citation2014, Allen and Cullis Citation2004, Danafar et al. Citation2015, Danafar Citation2016b, Kumari et al. Citation2010, Ma'mani et al. Citation2014, Manjili et al. Citation2014, Citation2016, Soppimath et al. Citation2001). The amphiphilic nanoparticles which contain a hydrophobic core and a hydrophilic shell are brilliant applicants for hydrophobic drugs. Poly (caprolactone)-poly (ethylene glycol)- Poly (caprolactone) (PCL–PEG–PCL) is a tri-block copolymer which self-assembled into nanoparticles with core–shell structure: a hydrophobic PCL core and a hydrophilic PEG shell. These copolymers are safe and not accumulative in vivo because the degraded products of PCL–PEG–PCL block copolymer may move in the tricarboxylic acid cycle or be removed by kidney. These copolymers can improve the drug loading, reduce the rush influence, elongate the in vivo residence period of drugs, escape them being surrounded by macrophages, increase hydrophilicity and have a great potential for development in drug delivery (Al-Musawi et al. Citation2014, Danafar Citation2016b, Danafar et al. Citation2015). The hydrophobic PCL segment combined with the drug forms the core and the hydrophilic PEG forms the shell of nanoparticles. The entrapment of hydrophobic drugs by PCL–PEG–PCL copolymers will increase constancy and systemic delivery of drugs. PCL–PEG–PCL copolymers are recyclable, biocompatible and showing confident applications in drug-delivery systems. Recently PCL–PEG–PCL micelles were applied to carry hydrophobic drugs with the aim of bringing aqueous formulations for these drugs (Allen and Cullis Citation2004, Kumari et al. Citation2010, Soppimath et al. Citation2001). PCL–PEG–PCL surfaces can be modified. They can be tailor-made to achieve both controlled drug release and disease-specific localization by tuning the polymer characteristics and surface chemistry. A study has shown that micelles can become concentrated particularly in tumors, at infamy-amatory sites and at antigen-sampling sites by virtue of the enhanced permeability and retention effect of the vasculature. Some drug delivery systems using recyclable polymer such as nanoparticles delivering antitumor compounds are commercially available (Danafar and Hamidi Citation2015, Danafar et al. Citation2016, Wang et al. Citation2005). In order to develop therapeutic efficiency of SF, a range of approaches for entrapment of SF has been introduced (Enriquez et al. Citation2013, Izadi et al. Citation2015, Sutaria et al. Citation2012). It is revealed that 24 h after administration of a single dose of SF in rats, 72% of the SF was observed in urine as N-acetylcysteine–SF conjugate (Conaway et al. Citation2005, Gasper et al. Citation2005, Hanlon et al. Citation2008). These data give emphasis to the need of sustaining therapeutic levels of SF to provide an effective anticancer effect (Clarke et al. Citation2008, Holst and Williamson Citation2004, Zhang et al. Citation2003). It revealed that albumin-based polymeric delivery system can enhance the therapeutic effect of SF (Manjili et al. Citation2016). It seems that encapsulating SF in PCL–PEG–PCL micelles may be an efficient method for developing an improved SF formulation. In this study, an effective micellar delivery system by PCL–PEG–PCL was achieved. We introduce an efficient nano-drug delivery system to improve the therapeutic activity of SF in the breast cancer cell line.
Materials and methods
Materials
All chemicals used in this work were of analytical grade and purchased from commercial sources. PEG(Mn =6000 Da) (Aldrich, St. Louis, MO, CAS.81323), ɛ-caprolactone (98% purity) (Acros, Morris Plains, NJ, CAS.502443), SF (Aldrich, St. Louis, MO, CAS.S4441), stannous 2-ethyl-hexanoate (Sn(Oct)2) (Aldrich, St. Louis,MO, CAS. 301100), 3-(4,5-dimethylthiazol-2-yl)-2,5-diphenyltetrazolium bromide (MTT), streptomycin, penicillin G, phosphate buffer (20 mM, pH =7.8) and corresponding salts which were used throughout this research were purchased from Sigma-Aldrich or Merck. Fetal bovine serum (FBS), Dulbecco’s Modified Eagle’s Medium (DMEM) and Hams F12 were used as culture medium and other supplements were obtained from Gibco (Life Technologies, Darmstadt, Germany).
Synthesis of PCL–PEG–PCL copolymer
The synthesis of PCL–PEG–PCL copolymers was done according to our previous report (Manjili et al. Citation2016). These were synthesized by a ring-opening polymerization of ɛ-caprolactone with PEG as an initial molecule and Sn (Oct)2 as catalyst. Briefly, ɛ-caprolactone (1, 2, 4, 8, 10 g), PEG (2 g), and Sn (Oct)2 (0.01 mmol) were heated to 120 °C to start polymerization. After 12 h, the obtained polymer was incubated at room temperature (23 °C), dissolved in chloroform and precipitated in cold diethyl ether. The obtained copolymers were dried under vacuum at room temperature for 24 h. They were characterized by Fourier Transform Infrared spectroscopy (FT-IR) (Bruker, Tensor 27, Notre Dame). Proton Nuclear Magnetic Resonance Spectroscopy (1HNMR) in CDCl3 at 400 MHz was used for characterization of the chemical structure of the PCL–PEG–PCL copolymers (Bruker, Evans, 400). Thermal analysis of tri block copolymers was determined by differential scanning calorimetry (DSC) (Mettler Toledo, model Star SW 9.30, Selangor, Switzerland). The data were documented from 0 to 250 °C. Molecular weight and distribution of the PCL–PEG–PCL copolymers were calculated by gel permeation chromatography (GPC) (Knaure, Berlin, Germany) composed of an ultrastyragel column and differential refract metric detector (4.6×30 mm) (Waters, Milford, CT, model HR 4E). Tetrahydrofuran (THF) as a mobile phase with a flow-rate of 1 mL/min and the injection volume was 100 μL of stock solutions (0.1–0.5 w/v %) was used. The standards of polystyrene mono disperse in the range of 4500–29500 DA (Varian Palo Alto, CA) obtained before measurements was used as the calibration curve for the determination of average molecular weight of the PCL–PEG–PCL copolymers (Manjili et al. Citation2016).
Preparation, characterization and determination of loading efficiency of micelles
SF-loaded micelles were prepared by nanoprecipitation method using acetone. Briefly, PCL–PEG–PCL copolymer (20 mg) and SF (1, 2, 5, 10, 15, 20 mg) were dissolved in 2 mL of acetone. The solution was injected drop-wise through a syringe (G = 22) into 25 mL of distillated water under certain mixing rates and stirred magnetically at room temperature until complete evaporation of the organic solvent, which produced the amphiphilic copolymers to self-associate to form the micelles. The resulting aqueous solution was filtered through a 0.45 μm filter membrane to remove the unloaded SF. The resulting micelles were separated by centrifuging at 20,000g for 20 min and freeze-dried under a pressure of 14 Pa at −78 °C in order to remove all the residual solvents and to produce the final dried form. The morphology of micelles was determined by atomic force microscopy (AFM) (JPK, Berlin, Germany, and model Nano Wizard 2). For sample preparation, micelles were diluted in water and a droplet of 2 μL was placed onto a freshly cleaved mica substrate (1 cm2) followed by air-drying. AFM measurements were performed in intermittent contact mode. The particle size distribution of the prepared micelles was determined using dynamic light scattering (DLS) using a nano/zetasizer (Malvern Instruments, Worcestershire, UK, model Nano ZS). The physical stability of micelles was evaluated by monitoring the particle size distribution of the micelles while suspended in phosphate-buffer saline (PBS, pH =7.4) and kept at room temperature for 0, 15, and 30 days after preparation. To determine the loading efficiency of the drugs in the micelles, two parameters including the drug loading ratio and efficiency of entrapment were evaluated. Drug loading ratio was determined as:
(1)
(1)
Wdrug in micelles and Wmicelles show weight of the encapsulated drug and the total weight of the corresponding drug-encapsulated micelles, respectively, and %DL is the drug loading ratio (%). For determination of the drug-loading ratio, 1 mg of the final freeze-dried nano dispersion was dissolved in 1 mL of chloroform and the drug content was measured by high-performance liquid chromatography (HPLC). The mobile phase consisted of a mixture of acetonitrile and water (45:55, v/v), and was delivered at a flow rate of 1.0 mL/min using a double-reciprocation pump (Waters, model Breeze, USA). The sample was injected through a 20 μL sample loop. The column effluent at 5.5 min was detected at 241 nm with a variable wavelength detector (Waters, model Breeze, USA). A C18 analytical column (250 mm×4.6 mm, particle size 5 μm; Perfectsill, MZ-Analysen technik, Germany) prepared by a guard column of the same packing was used.
Entrapment efficiency was determined in reference to the loading ratio and total dried nanodispersion weight obtained using the following equation:
(2)
(2)
Drug release study
This experiment was performed to evaluate the SF release behavior from micellized copolymer. The solubility of SF in PBS, pH =7.2 is ∼10 mg/mL. Briefly, 5 mg of freeze-dried drug-loaded carriers were dispersed in 2 mL phosphate-buffered saline (PBS) and the resulting suspension was placed within a dialysis sac (Mw 12 kDa) and incubated at 37 °C while immersed in 15 mL of PBS. Then, at predetermined time intervals, 2 ml of the dialysate was taken out and replaced by 2 mL fresh PBS. The SF concentration in the dialysate was measured at 241 nm using HPLC. All the release studies were performed in triplicate. In order to study the pH-dependency of the drug release, the experiments were performed using PBS at a pH of 5.5. To investigate the drug release behavior of carriers while incubated in real human plasma, the release experiments were repeated in plasma of a healthy male volunteer in the same condition except that the samples were incubated in plasma instead of PBS. As controls, the release of free SF was studied in PBS with pH= 7.4, pH= 5.5 and human plasma.
Cell cultures and cell viability by MTT assay
Experiments were performed on human breast adenocarcinoma cell line (MCF-7), human mammary epithelial cells (MCF-10A) and mice breast adenocarcinoma cell line (4T1) purchased from Pasteur Institute (Tehran, Iran). The cells were cultured in RPMI-1640 (GIBCO, USA) containing 10% Fetal Bovine Serum (FBS) (Gibco, Germany), 2 mM l-glutamine, penicillin (50 IU/mL) and streptomycin (50 μg/mL) for 4T1 and MCF-7. for MCF10A cell line, 50:50 DMEM/Hams F12, with 2.5 mM l-glutamine, 15 mM HEPES, 0.5 mM sodium pyruvate, 1.2 g/L sodium bicarbonate, 20 ng/mL human Epidermal Growth Factor (hEGF), 100 ng/ml cholera toxin, 10 μg/mL bovine insulin, 500 ng/mL hydrocortisone and 5% horse serum were used, which were incubated at 37 °C in a humidified incubator with 5% CO2 atmosphere. The cells were then harvested with 0.5 g/L trypsin (Gibco Laboratories) and 0.2 g/L EDTA (Gibco Laboratories) after 80% confluence for 3 min in 37 °C. The concentration of the cells in the culture was attuned to allow for exponential growth. To study the cytotoxicity of free SF, PCL–PEG–PCL micelles and SF/PCL–PEG–PCL micelles on MCF-7,4T1 and MCF-10A cell lines, the colorimetric assay were applied to measure the reduction of MTT. The MTT assay was performed at 48 and 72 h of treatments. Cells were seeded into 96-well plates (5 × 10³ cells/well). After 24 h, diverse concentrations (range of 1–30 mol/L in DMEM) of free SF, PCL–PEG–PCL micelles and SF/PCL–PEG–PCL micelles were applied. Then, after 48 and 72 h of the treatment, the medium was removed and the cells were washed twice with PBS, later on 25 μL of MTT (4 mg/mL) was added to each well. Plates were incubated for 4 h at 37%. 100 μL of DMSO was added to each well and left at 37% for 10 min. The optical density was measured at 570 nm using a micro-plate reader (Biotek, Winooski, VT). The experiment of cytotoxicity of SF/PCL–PEG–PCL micelles in cell lines after 48, and 72 h of treatments were performed with six repeats, but the rest of the experiments with free SF, PCL–PEG–PCL micelles were performed in triplicate.
Gene expression profile in MCF-7 cells and apoptosis assay in 4T1 cells
Total RNA of MCF-7 cells (105 cells/mL) which were treated with 20 μmol/L of free SF, PCL–PEG–PCL micelles and SF/PCL–PEG–PCL micelles (48 h) was extracted by using TRIzol reagent according to the manufacturer’s instructions (Invitrogen Life Technologies, Waltham, MA). Total mRNA was directly processed to cDNA by reverse transcription by cDNA synthesis Kit (Fermentas) in a 25 μL total volume reaction (Izadi et al. Citation2014). The levels of mRNA of Bcl-2, Caspase 9, PARP and COX-2 were quantified by the real-time PCR and endogenous gene beta-actin was used as a control. Primers were designed using software primer express (Bcl-2 Forward: 5-AGTACCTGAACCGGCACCT-3, Reverse: 5-CAGCCAGGAGAAATCAAACA-3 amplicon size =110 bp, Caspase 9 forward: 5-CTCAGACCAGAGATTCGCAA-3, Reverse: 5-CTCAAGAGCACCGACATCAC-3 amplicon size =99 bp, PARP Forward: 5-GGCTTAATCCTGTTGGGAGA-3, Reverse: 5-CCAAACCTTTGACACTGTGC-3 amplicon size =106 bp, COX-2 Forward: 5-GCTGGAACATGGAATTACCC-3, Reverse: 5-ATCTGCCTGCTCTGGTCAAT-3 amplicon size =132 bp, ACTB Forward: 5-GACATCCGCAAAGACCTGTA-3, Reverse: 5-GGAGCAATGATCTTGATCTTCA-3 amplicon size =134 bp). The expression levels of genes were calculated by real-time PCR (ABI prism 7500) (Applied Bio systems, Waltham, MA). Amplification reactions contained 2.5 μL of cDNA, 10 μL of the SYBR Green I (SG) dye (Applied Bio systems, Waltham, MA) and 0.4 μL of each of the specific primers. PCR performed with initiated one cycle at 95 °C for 10 min, then 40 cycles at 95 °C for 15 s and 59.5 °C for 1 min. The real-time PCR data were evaluated with the melting curve analysis. The calculations for determining the relative level of gene expression were made using the cycle threshold (Ct) method. Apoptosis of 4T1 cells was studied by flow cytometry using Annexin-V/PI staining because phosphatidyl serine is unprotected and detectable by Annexin-V at the external surface of the cells at initial stages of apoptosis. Briefly, cells were seeded into 6-well plates (105 cells/well) and were treated for 48 h with free SF, PCL–PEG–PCL micelles and SF/PCL–PEG–PCL micelles at IC50 concentration (20 μmol/L). After incubation, the cells were washed twice with cold PBS and then re-suspended in 1 × binding buffer (10 mM HEPES, 140 mM NaCl, and 2.5 mM CaCl2, pH =7.2). 100 μL of the solution was transferred to 5 mL culture tube, 5 μL of Annexin V-FITC and 5 μL PI were added and incubated in dark situation for 15 min at RT. Then, 400 μL of 1 × binding buffer was added to each tube and analyzed by flow cytometry (Becton Dickinson FACS, NJ, USA) within 1 h.
In vivo anticancer activity in the 4T1 breast cancer model
Female 6–8 weeks old inbred BALB/c mice were purchased from the Pasteur Institute, Tehran, Iran. Animal care and treatment was accomplished in conformity with the guideline of animal care and research committee Zanjan University of Medical Sciences, which is in obedience with the guide for the care and use of laboratory animals. The provided 4T1 cells at logarithmic growth phase and the concentration of 2 × 10⁶ cells per 200 μL of PBS were injected subcutaneously into the right flank of animals. To allow tumor formation, the injected mice were kept in animal house until the tumor volume reached ∼150 mm3 (tumors volume was measured by a digital vernier caliper), then the mice were injected intravenously into the tail vein at a dose of 30 mg/kg (SF equivalent) at day 0, 4 and 8 with free SF, SF-loaded micelle and PBS solution, respectively. Twenty-eight mice with approximately same sizes of tumor were selected and divided to four groups. The groups were treated as follows: groups A and B as control groups received (intra peritoneal injection) PBS and micelles, respectively; groups C and D were treated by same doses of free SF and micelles. All the procedure of tumor-bearing was performed under Institutional Review Board (IRB) of Zanjan University of Medical Sciences (Foltz and Ullman-Cullere Citation1999). The tumor inhibition activity was assessed by the tumor volume (TV), which was calculated as TV = (width2 × length) × ½. The dimension of the tumor measured by a caliper and the total body weight was also measured at the same time.
Measurement of nitric oxide and in vitro hemolytic test of micelles
NR8383 macrophage cells were seeded in a 96-well plate (1 × 10⁴cells/well) and incubated in 37 °C, 5% CO2 for 24 h. Micellar solutions (PCL–PEG–PCL and SF-loaded PCL–PEG–PCL micelles) at various concentrations were added to the cells in a final volume of 0.1 mL. Accordingly, polymer concentration ranged from 0.002 to 1 mg/mL, SF concentrations from the micelle solutions were 0.479, 4.79, 47.9 and 239.5 μg/mL, respectively. The supernatants were collected after 24 h and NO production was determined by the Greiss reagent (1% sulfanilamide, 2.5% H3PO4, 0.1% naphthylethylenediamine dihydrochloride). Briefly, 100 μL of culture medium was added to 100 μL of Greiss reagent solution and incubated for 20 min. The absorbance was then measured at 540 nm. In the control experiments, macrophages were incubated in a lipopolysaccharides (LPS) solution (150 ng/mL) and a micelle-free medium. Moreover, total protein extract was determined by Micro BCA Protein Assay. The in vitro hemolytic test described here is an adjustment of standard F-756–00 (Saleem et al. Citation2013), 0.8 mL of micellar solutions (PCL–PEG–PCL and SF/PCL–PEG–PCL micelles) at various concentrations were incubated in 0.1 mL of rabbit red blood cells at 37° C and for 4 h. To make sure fresh rabbit blood was used in the test, the hemoglobin in as-harvested plasma of rabbit blood was found to be less than 220 μg/mL, which is regarded as basal level in the hemolysis test. Following incubation, the solution was centrifuged at 3500 rpm for 20 min. To determine the supernatant hemoglobin, 0.75 mL of Drabkin’s solution was added to 0.25 mL of supernatant and the sample was allowed to stand for 20 min. The amount of cyan methemoglobin in the supernatant was measured by spectrophotometer (Smart Spec 3000, New York, NY) at a wavelength of 540 nm and then compared with a standard curve (hemoglobin concentrations ranging from 0.01 to 1.5 mg/mL). The percent hemolysis refers to the hemoglobin concentration in the supernatant of a blood sample not treated with micelles to the obtained the percentage of micelle-induced hemolysis. Additionally, the absorption of the micellar SF was determined at 540 nm in order to eliminate the effect of absorption of SF. Finally, saline solution and double-distilled water were used as negative and positive controls, respectively.
Standard and sample preparation and pharmacokinetic study
A stock solution of 0.5 mg/mL SF in methanol was prepared. The concentrations of 10,15, 20, 30, 40, 50, 75 and 100 ng/mL of SF were prepared by serially diluting this solution with the proper amount of rat plasma to 100 μL of rat plasma samples. Then, 100 μL acetonitrile and 50 μL methanol were added. The mixtures were vortex mixed for 20 s. After centrifugation at 15000 × g in micro tubes for 20 min, an aliquot of 20 μL was injected into the HPLC system (Danafar and Hamidi Citation2013). Male adult Wistar rats with a mean body weight of 200–300 g were fasted overnight before the experiments with free admission to water. The experimental protocol was accepted by animal care and treatment was talented in conformity with the guideline of animal care and research committee of Zanjan University of Medical Sciences, which is in obedience with the guide for the care and use of laboratory animals. The rats were separated randomly into three groups (n = 5). The aqueous suspension of SF and dispersion of the SF-loaded nanoparticles were administered by oral administration at a dose of 30 mg/kg. The nanoparticles were discrete in ultrapure water. Blood samples (500 μL) were withdrawn from the tail vein into heparinized micro tubes at the following times: 0.25, 0.5, 1, 1.5, 2, 4, 8, 12 and 24 h after dosing. The blood samples were centrifuged at 3020 × g for 10 min. The supernatant was together, transferred to tightly potted plastic tubes and store at −20 °C until analysis by HPLC. After each example, the same volume unconcerned was replaced with a saline solution. All of the in vitro results were articulated as the mean ± standard deviation (SD) of three replicates. The in vivo results were obtainable as the mean ± SD of five replicates. Pharmacokinetic parameters were expected using the model-independent method. The terminal elimination rate constant (Ke) was predicted by a linear regression analysis of the terminal portion of the log-linear blood concentration–time profile of SF. The terminal elimination half-life (t1/2) was calculated using the Keusing formula: t1/2 = 0.693/Ke. The maximum experimental plasma concentration (Cmax) and the time taken to reach it (tmax) were obtained from the curve plotting SF concentration vs time. The area under each drug concentration time curve (AUC, ng/mL h) to the last data point was designed by the linear trapezoidal rule and extrapolated to time inanity by the addition of CLast/Ke, where CLast is the concentration of the last calculated plasma sample. The obvious body clearance (Cl) was designed using the equation Cl dose/AUC. The apparent volume of distribution (Vd) was calculated by the following equation: Vd = dose/Ke AUC. Statistical analysis of the data was performed via one-way analysis of variance (ANOVA). The results were considered statistically significant if P < 0.05.
Results
Synthesis and characterization of PCL–PEG–PCL copolymers
PCL-PEG–PCL tri-block copolymers were synthesized using the ring-opening polymerization of caprolactone in the presence of PEG, whose hydroxyl end group initiated the ring opening explained in our previous work (Manjili et al. Citation2016). The structure and composition of the synthesized PCL–PEG–PCL tri-block copolymers was determined by HNMR spectroscopy in CDCl3 .The presence of ethylene’s (CH2) in PCL was detected around 1.25, 1.59, 2.31 and 4.04 ppm, the methylene (CH2) groups of PEG were around 3.67 ppm. shows the characteristics of synthesized copolymers. FT-IR spectrum of PCL–PEG–PCL copolymer showed the sharp and intense bands at 1722 and 1106 cm−1 were due to the presence of carboxylic ester (C = O) and ether (C–O) groups, hence demonstrating that the formation of PCL–PEG–PCL copolymer has occurred successfully. GPC results showed that the weight- and number-based average molecular weights of copolymer were 17.5 and 20.4 KDa, respectively (). In DSC thermogram of copolymers, the endothermic peak (54.72 °C) was detected.
Table 1. Molecular characterics of the synthesized copolymers.
Preparation and characterization of copolymeric micelles
Amphiphilic PCL–PEG–PCL copolymer formed micelles with a core–shell structure in water, where the core and shell were a hydrophobic PCL chain and a hydrophilic PEG chain, respectively. The hydrophobic drug could then be encapsulated into a hydrophobic core by means of the hydrophobic interaction of PCL, SF and also with the interaction between water and the hydrophilic shell of PEG. The increase of the DL and EE of SF in PCL–PEG–PCL may be produced by the strong hydrophobic interaction between the longer hydrophobic PCL block chain and hydrophobic drug. After DL, the size of the micelles increased (as shown in ). This result was expected because incorporation of SF into the hydrophobic cores increased the volume of the micelles. The formation of micellar nanostructures was confirmed by AFM apparently. PCL–PEG–PCL micelles showed a homogeneous spherical morphology, as expected (). The micelle size observed by AFM was about 107 nm, a little smaller than that determined by DLS, since the micelle diameter determined by DLS represents their hydrodynamics diameter obtained by AFM is associated to the collapsed micelles after water evaporation. The size of nanoparticles was also measured by dynamic light-scattering technique. The Z-average and Zeta potential of SF/PCL–PEG–PCL micelles were found to be about 114 nm and −7.51 mV, with their corresponding PDI being 0.141 (). Also, the SF/PCL–PEG–PCL micelles had a minor negative surface charge which increased the circulation time of the drug. Surface charge is important in deciding whether the nanoparticles will cluster in blood flow or will stick to or interact with oppositely charged cell membrane. The plasma and blood cells always had a negative charge; nanoparticles with slight negative surface charge can minimize nonspecific contact with these components through electrostatic interactions. The loading ratio and encapsulation effectiveness of SF/PCL–PEG–PCL micelles were determined as 19.33% ± 1.78% and 87.1 ± 1.58%, respectively, using HPLC. To optimize the progression parameters and impending into the impact of the drug/copolymer ratio on loading and encapsulation efficiency, different SF/PCL–PEG–PCL mass ratios in the feed were evaluated. The particle size and poly-dispersity index (PDI) increased, but the stability of the SF/PCL–PEG–PCL micelles decreased. When the SF/PCL–PEG–PCL mass ratio was 0.75 and 1, the obtained SF/PCL–PEG–PCL micelles were not stable in water (micelles tended to aggregate, forming aggregates); thus, the SF/PCL–PEG–PCL mass ratio at 0.25 was chosen in our study (). The interpretation can be assigned in conditions of insolubility of SF in the aqueous solution, which could guide more drugs at high concentration to be adsorbed on the surface of micelles. To develop an ideal formulation of higher DL or EE, five series of micelles were synthesized and the effects of the ratio of PCL and PEG on DL and EE were studied. The DL and EE of NP14–18 are listed in . Micelles with fixed PEG length, the DL and EE increased with the rise of feed weight ratio of PEG:ɛ-CL (from 1:0.5 to 1:5). The maximum EE reached 87.1% and 73.05% for NP17 and NP18, respectively. Amphiphilic PCL–PEG–PCL copolymer formed micelles with a core–shell structure in water, where the core and shell were a hydrophobic PCL chain and a hydrophilic PEG chain, respectively. The increase of the DL and EE of SF in PCL–PEG–PCL may be caused by the strong hydrophobic interaction between the longer hydrophobic PCL block chain and hydrophobic drugs. After DL, the size of the micelles increased. This result was expected because incorporation of SF into the hydrophobic cores increased the volume of the micelles. In the clinical administration of micelles dispersions, the stability of the sizes and volume of the micelles is of great importance both as a measure of the particle structure integrity and as an indicator of the possible inter-particular associations. For this purpose, the particle size stability was monitored in this study over a 30-days course. The size of all micelles was increased slightly throughout the measurement period. This observation cannot be a sign of aggregation, which usually leads to several fold increases. Probably, some kind of copolymer swelling and/or hydration can be responsible for this event.
Figure 1. (a) AFM image of SF-loaded spherical core shell micelles; (b) particle size distribution; (c) zeta potential.
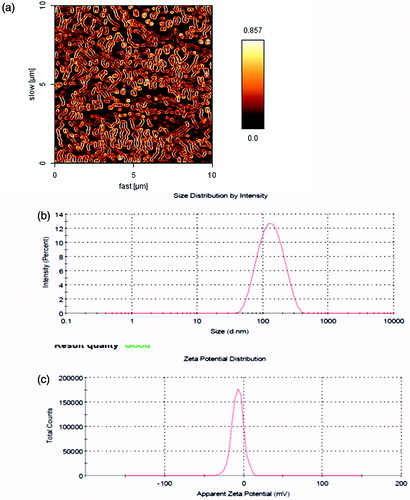
Table 2. Properties of SF-loaded PCL–PEG–PCL micelles.
Table 3. Characterisistic of micelles from the synthesized copolymers.
In vitro release of SF
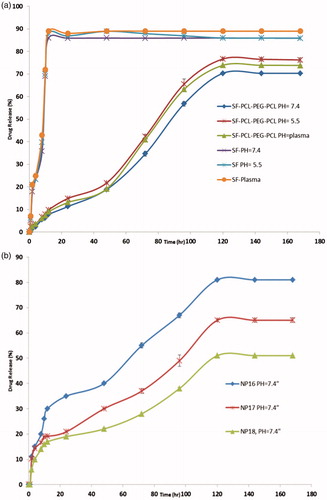
To study of the effect of the chemical and biochemical factors on the release of SF from micelles, the release test was performed on drug-loaded micelles in neutral (pH =7.4) and acidified PBS solution (pH =5.5) as well as the freshly prepared human plasma withdrawn from a volunteer. As controls, the release of free SF was studied to verify that the diffusion of drug molecules across the dialysis membrane was not a rate-limiting step during the release progression. Free SF was revealed to be rapidly released and reached its peak to 85.95%, 87.34% and 89.07% of the total in the first 12 h at pH 7.4, 5.5 and plasma, respectively. shows the release profiles of SF from the drug-loaded micelles, at pH 7.4 and 5.5 and plasma. As anticipated, no considerable initial burst SF release was detected from the micelles. As shown in , the percentage of SF released from the micelles increased as the pH value decreased from 7.4 to 5.5. For instance, after 96 h incubation, the amounts of SF released in the media with pH values of 7.4, 5.5 and human plasma were about 56.75%, 65.76% and 63.21%, respectively. This point may be as a result of the physical loading of SF in to the micelles. The results show that the maximum drug releases were70.34%, 76.67% and 73.87%, respectively, for PBS pH =7.4, pH =5.5 and plasma after a period of 120 h. The sustained release of SF can be recognized to the entrapment of SF in core of micelles. So, the obtained copolymeric micelles can be regarded as highly attractive micelles for time-controlled drug delivery for hydrophobic drugs for the achievement of different therapeutic objectives. The in vitro release behaviors of SF solution and SF/micelles in buffered solution (pH 5.5) are shown in . The typical two-phase release profile was detected for SF release from NP16, NP17 and NP18; that is, a relatively rapid release in the first stage followed by a sustained and slow release rate over a prolonged time of up to 168 h. Overall, they revealed a slower release than that of the control solution. At 120 h, 81.0%, 65.3% and 51% of the SF was released from NP16, NP17 and NP18, respectively. Apparently, the release rate of SF from drug-loaded polymeric micelles decreased as the molecular weight of PCL–PEG–PCL in pH 5.5 buffers increased. The drug’s release from amphiphilic copolymer micelles containing an ester group was due to hydrolysis disruption of the ester bonds and the drug’s diffusion. The hydrolysis and drug’s diffusion were controlled by the length of hydrophobic chain or hydrophilic chain, and pH or the temperature of medium. The slower release of NP18 at pH 5.5 may be mainly due to hydrolysis of ester groups. As the length of the hydrophobic ester chain in NP18 was longer than that in NP16 and NP17, its hydrolysis was slower, which led to the slower release of SF.
Figure 2. (a) The release profiles of SF from SF-PCL–PEG–PCL micelles in different release media. (b) The release profiles of SF from SF-PCL–PEG–PCL micelles in different copolymers composition.
Study on cancerous cell’s viability after SF/PCL–PEG–PCL micelles treatment
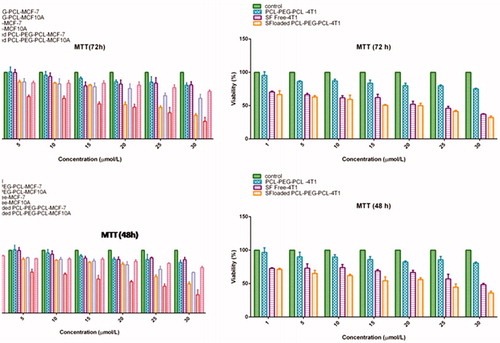
The in vitro study on the effects of SF/PCL–PEG–PCL micelles in the case of MCF-7, MCF10A and 4T1 cells was performed using MTT assay (). Statistical analysis of MTT data revealed those SF/PCL–PEG–PCL micelles at all concentrations significantly (P < 0.05) reduced cell viability compared with PCL–PEG–PCL copolymer in cancerous cells. While, this decrease of cells viability was not seen at the MCF10A cells which were treated with SF/PCL–PEG–PCL micelles. 1–30 μmol/L of free SF was used in this test. Also, it was repeated in same concentrations of SF-loaded micelles and bare micelles plus the cultured cells without any treatment as control. The MTT assay showed that SF directly inhibited MCF-7 cell growth in vitro (IC50 at 48 h, 27 ± 1.53 μM; IC50 at 72 h, 21.32 ± 1.23 μM). The MTT assay indicated that SF-loaded micelles directly inhibited MCF-7 cell growth in vitro (IC50 at 48 h, 21.31 ± 0.19 μM; IC50 at 72 h, 19.15 ± 0.72 μM) and about 4T1 cell line IC50 for free SF (48 h, 29.31 ± 0.59 μM; 72 h, 23.78 ± 0.62 μM) and IC50 for SF/micelles (48 h, 22.36 ± 0.48 μM; 72 h, 20.16 ± 0.81 μM). These results demonstrate that SF/micelles increased the SF cytotoxicity in MCF-7 and 4T1 cell lines.
Figure 3. Cytotoxicity of free SF, PCL–PEG–PCL micelles and SF-loaded micelle against MCF-7, MCF10A and 4T1 cells. The cells were incubated with SF-loaded micelle (SF concentration 1–30 μmol/L) for 48 and 72 h at 37° C each bar represents the mean of five measurements ± SD.
Detection of cell apoptosis and gene expression profile
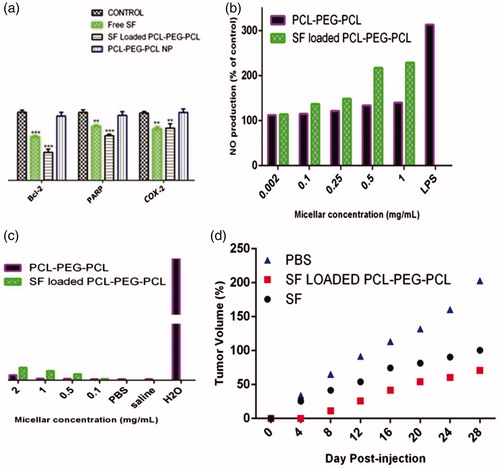
Flow cytometry by Annexin-V/FITC + PI double staining shows the percentages of cells viability (A−/PI−), early apoptosis (A+/PI−), late apoptosis (A+/PI+) and necrosis (A−/PI+) in 4T1 cell lines after treatment with free SF, PCL–PEG–PCL copolymer, and SF-loaded PCL–PEG–PCL micelles (). Statistical analysis of flow cytometry results with one-way ANOVA and Duncan’s multiple range tests showed that the percentage of live cells (A−/PI−) decreased significantly (P < 0.001) after treatment with D-L-SF and SF-loaded PCL–PEG–PCL micelles compare to the control group, while the percentage of the cells treated with PCL–PEG–PCL copolymer did not changed significantly. Also, the percentages of total apoptosis (early + late apoptosis) in cells treated with free SF and SF/PCL–PEG–PCL micelles increased significantly (P < 0.001) in comparison with control. Effects of SF/PCL-PEG-PC L micelles (20 μmol/L) on the mRNA expression of selected genes were analyzed by real-time PCR. Statistical analysis of real-time PCR results showed that after 48 h SF/PCL–PEG–PCL micelle treatments, the expression rates of Bcl-2 (anti-apoptotic) genes significantly (P < 0.05) decreased in comparison with the control group (). The cells which treated with PCL–PEG–PCL copolymer did not show significant changes versus control cells. Comparing gene expression of the cells treated with free SF versus SF/PCL–PEG–PCL micelle showed that Bcl-2 mRNA expression decreased significantly from 0.67 to 0.43 (P < 0.01) and Caspase-9 mRNA expression decreased significantly from 0.48 to 0.28 (P < 0.05); PARP mRNA expression decreased from 0.78 to 0.69, but this decrease was not significant. The expression levels of COX-2 did not decrease significantly from 0.77 to 0.75. SF inhibited proliferation of human breast cancer cells by inducing apoptosis that was considered by activating Caspases, which leads to cleavage and inactivation of key cellular proteins such as PARP. Then, it seems that SF-induced apoptosis was associated with down-regulation of Bcl-2 and activation of Caspases-9.
Figure 4. (a) Statistical analysis of flow cytometry results show total apoptosis and live cell percentages in 4T1 cells. The values represent mean ± SD. *P < 0.0001, #P < 0.0001, and +P < 0.0001 indicate significant difference between PCL–PEG–PCL, free SF, and SF/PCL–PEG–PCL, respectively. (b) The apoptosis induction by SF at [PCL–PEG–PCL] micelles (D), free SF (C), [PCL–PEG–PCL] Micelles (B) and negative control (PBS) (A) on 4T1 cell line.
![Figure 4. (a) Statistical analysis of flow cytometry results show total apoptosis and live cell percentages in 4T1 cells. The values represent mean ± SD. *P < 0.0001, #P < 0.0001, and +P < 0.0001 indicate significant difference between PCL–PEG–PCL, free SF, and SF/PCL–PEG–PCL, respectively. (b) The apoptosis induction by SF at [PCL–PEG–PCL] micelles (D), free SF (C), [PCL–PEG–PCL] Micelles (B) and negative control (PBS) (A) on 4T1 cell line.](/cms/asset/3e6f942a-f34f-48fb-ac08-56dc50f99baf/ianb_a_1282501_f0004_b.jpg)
Figure 5. (a) Statistic analysis of gene expression in MCF-7 cells after 48 h treatments with 20 μmol/L of free SF, PCL–PEG–PCL micelles and SF loaded PCL–PEG–PCL. Each experiment was repeated three times. (b) Effects of PCL–PEG–PCL micelle and SF-loaded PCL–PEG–PCL micelle on the level of nitric oxide in NR8383 cells. Data represents the mean ± standard error of The mean of four experiments (P < 0.01 is significantly different from the LPS); (c) Hemolytic test on PCL–PEG–PCL micelle and SF-loaded PCL–PEG–PCL micelle. Data represent the mean ± standard error of the mean of three experiments (P < 0.01 compared to saline group); (d) Antitumor effect of free SF, PCL–PEG–PCL micelles and SF-loaded PCL–PEG–PCL in 4T1 tumor bearing mice. Mice were administered free SF (•) and SF-loaded micelle (▪) andPBS (▴) i.v at the equivalent 30 mg/kg SF.
Stealth property and biocompatibilities of PCL–PEG–PCL micelles
Intravenously injected polymeric nanoparticles are rapidly removed from the systemic circulation because of the activation of macrophages of the reticule endothelial system (RES). Therefore, inflammatory substances including nitric oxide (NO), cytokines is produced. We performed NO assays to evaluate the in vitro cytotoxicity of polymeric micelle on macrophages. The results revealed that micelles did not affect NO production up to 0.25 mg/mL (). The NO production by micelles was close to that of the control group. In contrast, the lipopolysaccharides (LPS) (150 ng/mL) significantly increased the NO production by macrophage cells. Moreover, SF/PCL–PEG–PCL micelle exhibited higher NO level than that of PCL–PEG–PCL micelle at concentrations from 0.1 to 1.0 mg/mL. SF/PCL–PEG–PCL showed NO production 1.93 folds higher than that of control. In contrast, NO secretion of PCL–PEG–PCL micelle was increased only 1.11 fold over the control group at a micelle concentration of 0.25 mg/mL. As shown in , the percentage of hemolysis increased consequently with the concentration of micelle. Polymeric micelle at a concentration of 3 mg/mL caused a slight increase in hemolysis when compared with that of the negative control (saline solution) and blank solution (PBS buffer). However, SF-loaded micelle exhibited higher hemolytic activity than that of PCL–PEG–PCL micelle. This may be recognized to the release of SF in medium that caused hemolysis. The results also suggested that the hemolytic activity of micellar SF can be influenced by on the SF concentration.
Effect of SF/PCL–PEG–PCL micelles in tumor development and survival rate
The antitumor efficacy of free SF and SF-loaded micelles was examined with 4T1 mice breast tumor bearing BALB/c mice. The tumor growth rates of mice treated with free SF, SF-loaded micelle and PBS are presented in . The free SF and SF-loaded micelle exhibited alike efficiency in preventing tumor growth when mice were administered with single dose (data not shown). However, when the mice were treated with three injections, the SF-loaded micelle demonstrated the greater growth inhibition of tumor volume in compare with free SF. Tumor volumes were decreased up to 78.5% by SF-loaded micelle and 49.5% by free SF compared with control group, respectively. Based on the above results, SF-loaded micelle showed higher tumor targeting efficiency and more therapeutic effects than free SF. Hence, the hydrophobic and sensitive drug encapsulated in PCL–PEG–PCL micelle has advantages of prolonged blood circulation, RES uptake prevention, and passive targeting of polymeric micelles to tumor tissue through EPR effect (Nie Citation2010; 34).
Linearity of method and pharmacokinetics study
The method made linear responses throughout the SF concentration range of 10–100 ng/ml for SF to be suitable for intended purposes. The mean SF plasma concentration–time profiles after oral administrations of 30 mg/kg of SF in different formulations, SF aqueous suspension and SF/micelles are expressed in . summarizes the relevant pharmacokinetic parameters. After the oral administration of a SF aqueous suspension, the drug was absorbed quickly, and a maximum plasma concentration (Cmax) of ∼15 ± 0.203 ng/mL was reached in 30 min. So, the SF plasma concentration decreased abruptly, as the drug was distributed and rapidly metabolized, resulting in a high Ke and short t1/2, ∼1.12 h. The SF was detected up to 8 h after administration. A sustained release of SF over 24 h was observed when it was carried by the nanoparticles formulations. Thirty minutes after oral administration of the SF-loaded nanoparticles, the mean plasma concentration was 12.1 ± 1.17 ng/mL. There was a significant increase (P < 0.01) in SF absorption from the SF/micelles in the first 30 min compared to free SF. The SF concentration increased to 45.111 ± 0.123 ng/mL, Cmax, after 4 h (Tmax), with the SF/micelles. Compared to free SF, the Cmax of SF from nanoparticles was increased 3.1-fold. The increase in Cmax indicates that the nanoparticles were effective in increasing drug absorption, and the delayed Tmax demonstrates an obvious sustained release of SF. The distribution and metabolism of SF were decreased when it was carried by nanoparticles (P < 0.01). The clearance of SF from the nanoparticles was 5.1-fold lower than that of free SF. The SF/micelles decreased the SF volume of distribution by 10.35-fold compared to free SF. Thus, the t1/2 of SF from the SF/micelles increased to 5.98 h, while for free SF the t1/2 was 1.12 h. There was a significant difference in the AUC0–inf between the SF aqueous suspension and the SF/micelles (P < 0.01). Compared to the SF aqueous suspension, the SF/micelles increased the SF bioavailability 55.84-fold.
Figure 6. Comparison of in vivo plasma concentration vs. time profiles of the different SF formulations. All values reported are the mean ± SD (n = 5).
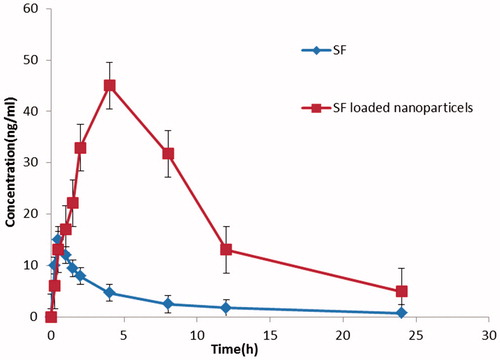
Table 4. Pharmacokinetic parameters of SF following single oral administration of SF aqueous solution and SF-loaded micelles, in rats (n = 5).
Discussion
Breast cancer progression is determined by changes in cellular proliferation, apoptosis and metastasis. The estrogen receptor signaling pathway in estrogen receptor positive breast epithelial cells provides an additional mechanism for cellular proliferations shows great promise as an anticancer agent. SF has the ability to simultaneously modulate multiple cellular targets involved in cancer development, including: (i) DNA protection by modulating carcinogen-metabolizing enzymes and blocking the action of mutagens; (ii) cell proliferation inhibition and apoptosis induction, (iii) neo angiogenesis inhibition, benign tumors progression to metastasis tumors. But, this compound is very susceptible to oxidants, light and heat, which resulted in deterioration upon exposure to such factors. It is very sensitive to changes in the temperature and pH (Danafar et al. Citation2016). Therefore, free SF should be protecting from chemical damage prior to its application in cancer therapy. Encapsulation is one way to improve its stability. Apoptosis can be talented either throughout the death-receptor Caspase cascades or the mitochondria Caspase cascades (Manjili et al. Citation2016). Caspases are the effectors of apoptosis and some of the hallmarks of apoptosis are cytoplasmic histone-associated DNA fragments, poly (ADP-ribose) polymerase (PARP) cleavage, changes in Bcl-2 protein family ratios (increased pro-apoptotic proteins and decreased anti-apoptotic proteins), and cytochrome C release from the mitochondrial membrane (Clarke et al. Citation2008). In this study, to demonstrate the induction of apoptosis in breast cancer MCF-7 cells by SF/PCL–PEG–PCL, we used Bcl-2 gene, for the reason that it is the best described protein family involved in the apoptotic cell death regulation and consisting of anti-apoptotic and pro-apoptotic members. The anti-apoptotic members of this family, such as Bcl-2 prevent apoptosis either by dropping activity of Caspases or by preventing the release of mitochondrial apoptogenic factors such as cytochrome C into the cytoplasm, another chose gene was Caspase-9 because procaspase-9 is activated in apoptotic conditions and it is involved in the activation of the Caspase cascade responsible for apoptosis execution. These results support testing SF in vivo and warrant future studies examining the clinical potential of SF in human breast cancer. SF protection against tumor development and mechanisms for SF suppression effects, including cell cycle arrest and apoptosis induction are of particular interest in future.
Conclusions
The results showed that the obtained PCL–PEG–PCL micelles had spherical structure. In vitro release of SF from SF-entrapped micelles was clearly sustained in all the media tested for this purpose. The in vitro cytotoxicity study confirmed that the micelles were safe. The results of flow cytometry analysis confirmed that the rates of apoptosis and SF cytotoxicity significantly increased after loading onto the synthesized PCL–PEG–PCL micelles vehicles in comparison with free SF. Our study showed that these micelles provided a suitable and appropriate system for delivery of SF to breast cancer cells. This study developed a nano-drug delivery system which could be used as a promising base to design further nanoparticle systems to improve the therapeutic effect of SF in the future.
Acknowledgements
This work has been supported financially by Faculty of Pharmacy, Zanjan University of Medical Sciences, Zanjan, Iran.
Disclosure statement
The authors report no conflicts of interest. The authors alone are responsible for the content and writing of this article.
Additional information
Funding
References
- Allen TM, Cullis PR. 2004. Drug delivery systems: entering the mainstream. Science. 303:1818–1822.
- Al-Musawi S, Naderi-Manesh H, Mohammad Hassan Z, Yeganeh H, Nikzad S, Kheiri Manjili H. 2014. Construction of polyurethane polymeric-based nano-carriers for curcumin in cancer therapy. Modares J Med Sci Pathol. 17:25–39.
- Bertl E, Bartsch H, Gerhäuser C. 2006. Inhibition of angiogenesis and endothelial cell functions are novel sulforaphane-mediated mechanisms in chemoprevention. Mol Cancer Ther. 5:575–585.
- Clarke JD, Dashwood RH, Ho E. 2008. Multi-targeted prevention of cancer by sulforaphane. Cancer Lett. 269:291–304.
- Conaway CC, Wang C-X, Pittman B, Yang Y-M, Schwartz JE, Tian D, et al. 2005. Phenethyl isothiocyanate and sulforaphane and their N-acetylcysteine conjugates inhibit malignant progression of lung adenomas induced by tobacco carcinogens in A/J mice. Cancer Res. 65:8548–8557.
- Danafar H, Hamidi M. 2013. A rapid and sensitive LC–MS method for determination of ezetimibe concentration in human plasma: application to a bioequivalence study. Chromatographia. 76:1667–1675.
- Danafar H, Hamidi M. 2015. Simple and sensitive high-performance liquid chromatography (HPLC) method with UV detection for mycophenolic acid assay in human plasma. Application to a bioequivalence study. Adv Pharm Bull. 5:563–568.
- Danafar H, Manjili H, Najafi M. 2016. Study of copolymer composition on drug loading efficiency of enalapril in polymersomes and cytotoxicity of drug loaded nanoparticles. Drug Res. 66:495–504.
- Danafar H, Rostamizadeh K, Davaran S, Hamidi M. 2016. Drug-conjugated PLA–PEG–PLA copolymers: a novel approach for controlled delivery of hydrophilic drugs by micelle formation. Pharm Dev Technol. [Epub ahead of print]. DOI: 10.3109/10837450.2015.1125920
- Danafar H. 2016a. Applications of copolymeric nanoparticles in drug delivery systems. Drug Res. 66:506–519.
- Danafar H. 2016b. Study of the composition of polycaprolactone/poly (Ethylene Glycol)/polycaprolactone copolymer and drug-to-polymer ratio on drug loading efficiency of curcumin to nanoparticles. Jundishapur J Nat Pharm Prod. [Epub ahead of print]. DOI: 10.17795/jjnpp-34179
- Do D, Pai S, Rizvi SA, D'Souza MJ. 2010. Development of sulforaphane-encapsulated microspheres for cancer epigenetic therapy. Int J Pharm. 386:114–121.
- Enriquez GG, Rizvi S, D'Souza MJ, Do DP. 2013. Formulation and evaluation of drug-loaded targeted magnetic microspheres for cancer therapy. Int J Nanomedicine. 8:1393–1402.
- Facchini A, Stanic I, Cetrullo S, Borzì RM, Filardo G, Flamigni F. 2011. Sulforaphane protects human chondrocytes against cell death induced by various stimuli. J Cell Physiol. 226:1771–1779.
- Foltz CJ, Ullman-Cullere M. Guidelines for assessing the health and condition of mice. RESOURCE. 1999;28.
- Gasper AV, Al-janobi A, Smith JA, Bacon JR, Fortun P, Atherton C, et al. 2005. Glutathione S-transferase M1 polymorphism and metabolism of sulforaphane from standard and high-glucosinolate broccoli. Am J Clin Nutr. 82:1283–1291.
- Gupta SC, Kim JH, Prasad S, Aggarwal BB. 2010. Regulation of survival, proliferation, invasion, angiogenesis, and metastasis of tumor cells through modulation of inflammatory pathways by nutraceuticals. Cancer Metastasis Rev. 29:405–434.
- Hanlon N, Coldham N, Gielbert A, Kuhnert N, Sauer MJ, King LJ, Ioannides C. 2008. Absolute bioavailability and dose-dependent pharmacokinetic behaviour of dietary doses of the chemopreventive isothiocyanate sulforaphane in rat. Br J Nutr. 99:559–564.
- Holst B, Williamson G. 2004. A critical review of the bioavailability of glucosinolates and related compounds. Nat Prod Rep. 21:425–447.
- Izadi A, Manjili HK, Ma’mani L, Moslemi E, Mashhadikhan M. 2015. Sulforaphane loaded PEGylated iron oxide-gold core shell nanoparticles: a promising delivery system for cancer therapy. Am Int J Contemp Sci Res. 2:84–94.
- Izadi A, Moslemi E, Poorhosseini SM, Yassaee VR, Kheiri HR, Elikai HR. UBD identify in paraffin tissues in patients with colorectal cancer. 2014.
- Kumari A, Yadav SK, Yadav SC. 2010. Biodegradable polymeric nanoparticles based drug delivery systems. Colloids Surf B. 75:1–18.
- Ma'mani L, Nikzad S, Kheiri-Manjili H, al-Musawi S, Saeedi M, Askarlou S, Foroumadi A, Shafiee A. 2014. Curcumin-loaded guanidine functionalized PEGylated I3ad mesoporous silica nanoparticles KIT-6: practical strategy for the breast cancer therapy. Eur J Med Chem. 83:646–654.
- Manjili HK, Ghasemi P, Malvandi H, Mousavi MS, Attari E, Danafar H. 2016. Pharmacokinetics and in vivo delivery of curcumin by copolymeric mPEG-PCL micelles. Eur J Pharm Biopharm. [Epub ahead of print]. DOI: 10.1016/j.ejpb.2016.10.003
- Manjili HK, Malvandi H, Mousavi MS, Danafar H. 2016. Preparation and physicochemical characterization of biodegradable mPEG-PCL core-shell micelles for delivery of artemisinin. Pharm Sci. 22:234–243.
- Manjili HK, Naderi-Manesh H, Mashhadikhan M, Ma'mani L, Nikzad S. 2014. The effect of iron-gold core shell magnetic nanoparticles on the sensitization of breast cancer cells to irradiation. J Paramed Sci. 5:85–90.
- Manjili HK, Sharafi A, Danafar H, Hosseini M, Ramazani A, Ghasemi MH. 2016. Poly (caprolactone)–poly (ethylene glycol)–poly (caprolactone) (PCL–PEG–PCL) nanoparticles: a valuable and efficient system for in vitro and in vivo delivery of curcumin. RSC Adv. 6:14403–14415.
- Nie S. 2010. Understanding and overcoming major barriers in cancer nanomedicine. Nanomedicine (Lond). 5:523–528.
- Saleem K, Wani WA, Haque A, Lone MN, Hsieh M-F, Jairajpuri MA, Ali I. 2013. Synthesis, DNA binding, hemolysis assays and anticancer studies of copper (II), nickel (II) and iron (III) complexes of a pyrazoline-based ligand. Future Med Chem. 5:135–146.
- Danafar H, Sharafi A, Kheiri Manjili H, Andalib S. 2016. Sulforaphane delivery using mPEG–PCL co-polymer nanoparticles to breast cancer cells. Pharm Dev Technol. [Epub ahead of print]. DOI: 10.3109/10837450.2016.1146296
- Sharma P, Kapoor S. 2015. Biopharmaceutical aspects of Brassica vegetables. J Pharmacogn Phytochem. 4:140–147.
- Soppimath KS, Aminabhavi TM, Kulkarni AR, Rudzinski WE. 2001. Biodegradable polymeric nanoparticles as drug delivery devices. J Control Release. 70:1–20.
- Sutaria D, Grandhi BK, Thakkar A, Wang J, Prabhu S. 2012. Chemoprevention of pancreatic cancer using solid-lipid nanoparticulate delivery of a novel aspirin, curcumin and sulforaphane drug combination regimen. Int J Oncol. 41:2260–2268.
- Wang F, Bronich TK, Kabanov AV, Rauh RD, Roovers J. 2005. Synthesis and evaluation of a star amphiphilic block copolymer from poly (ɛ-caprolactone) and poly (ethylene glycol) as a potential drug delivery carrier. Bioconjugate Chem. 16:397–405.
- Zhang Y, Tang L, Gonzalez V. 2003. Selected isothiocyanates rapidly induce growth inhibition of cancer cells. Mol Cancer Ther. 2:1045–1052.