
 ?Mathematical formulae have been encoded as MathML and are displayed in this HTML version using MathJax in order to improve their display. Uncheck the box to turn MathJax off. This feature requires Javascript. Click on a formula to zoom.
Abstract
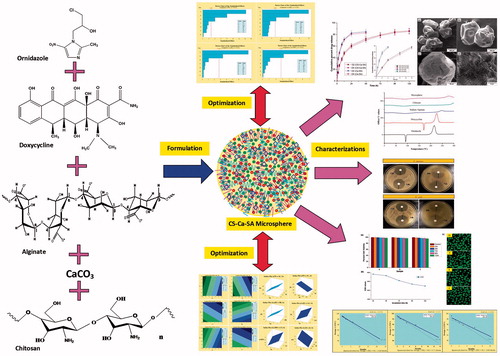
Periodontal disease is chronic, highly prevalent infectious disease that requires prolonged and controlled delivery of antimicrobial agents into pockets. To achieve this objective, dual antimicrobials encapsulated chitosan fortified calcium alginate (CS-Ca-SA) microspheres were formulated by application of Plackett-Burman factorial design. The microspheres were optimized for particle size (PS), entrapment efficiency (EE) and drug release. The optimized microspheres presented average PS of 74–461 µm and EE of 62.45–86.20% with controlled drug delivery for 120 hours. FTIR disclosed successful complexation between SA and CS. DSC and XRD studies showed changes in the crystallinity of drugs in microspheres. Shape factor and SEM demonstrated spherical to pear-shaped microspheres. Release exponent >0.43 and high diffusion coefficients revealed non-Fickian-based diffusion-limited drug release. CS-Ca-SA microspheres exhibited surface pH of 6.5 ± 0.5, moderate swelling, less erosion and improved mucoadhesion over Ca-SA microspheres. Also, significant antimicrobial activity against Escherichia coli and Staphylococcus aureus and cytocompatibility with L929 cell lines were observed. Further, microspheres exhibited long-term stability on refrigeration. The outcomes of study supported the potential of dual polymer and dual drug-based biodegradable, stable, non-toxic, mucoadhesive, controlled and prolonged drug release microspheres as more patient compliant by administration into periodontal pockets for the management of periodontal disease.
Graphical Abstract
Introduction
Periodontal disease (PD) is highly prevalent disease with 96.30% sufferers in India [Citation1]. PD is a group of inflammatory, microbial-induced infection involving damages to supporting tissues of teeth and gingiva leading to formation of pocket between the tooth and gums [Citation2,Citation3]. Treatment of PD is challenging to dentists due to shortcomings of systemic administration of antimicrobials [Citation4].
Thus, development of localized intrapocket controlled drug delivery strategy has gained attention of dentists as it offers higher drug concentration at the targeted sites at low dose, minimizes the unwanted systemic side effects, prevents antibiotic resistance and increases patient compliance [Citation5]. Controlled release systems like films and fibres currently marketed are costlier due to use of synthetic polymers and do not reach deep pockets due to folding [Citation4].
On the contrary, natural polymer-based controlled release biodegradable microspheres have emerged as better alternatives to existing intrapocket delivery systems due to their simplicity, safety, cost-effectiveness and accessibility to deeper pockets because of small size [Citation6,Citation7].
Sodium alginates (SA) are natural, non-toxic and anionic polymers with biodegradable, biocompatible and mucoadhesive characteristics which favours its utility in pharmaceuticals and biomedical applications [Citation8]. It is obtained from marine brown algae, formed of alternating units of 1–4 linked α-l-guluronic (G) and β-d-mannuronic (M) acid residues [Citation9]. The success of SA in drug delivery is established on its competence of interactions with cationic divalent ions such as calcium (Ca).
Ca has strong affinity for carboxylic acid moieties of G and M blocks of SA. These cationic–anionic interactions form “egg-box-like structure” whereby carboxylate units of SA molecules (box) are coordinated by divalent cations (eggs) [Citation9,Citation10]. Ca-SA networks had shown entrapment of large range of products like lipid droplets or lipophilic drugs [Citation9], thyme oil [Citation11], eucalyptus oil [Citation12] and insulin [Citation13]. However, use of SA-based drug delivery systems had several limitations such as formation of highly porous, weak microspheres, with low mucoadhesion property and high burst release of entrapped drugs [Citation9,Citation11,Citation13].
The combination of chitosan (CS) and SA in a drug delivery offers superior features over the use of SA alone [Citation14–18]. CS is a natural, non-toxic, biodegradable, biocompatible and mucoadhesive linear, polysaccharide polymer used in drug delivery applications since decades [Citation19,Citation20]. Previous investigations reported use of CS as surface coating or matrix material to strengthen the weak gel particles of SA [Citation13,Citation15,Citation21]. In addition, CS fortifies SA particles by endowing positive charge on the surface and increasing its mucoadhesion [Citation21], minimizing burst effect [Citation15,Citation22] and enhancing entrapment efficiency of drugs [Citation23].
Reportedly, SA with pKa values of 3.4–4.4 gets ionized at pH >5, responsible for its instability at physiological pH (6.8 and 7.4) [Citation24]. Nevertheless, non-ionized CS improves the stability of SA microspheres at pH >5 [Citation25].
Consequently, in the following study, antimicrobial drugs encapsulated CS-Ca-SA microspheres were formulated for controlled release therapy. The combination of antibiotics has been more effective for the treatment of microbial infections of oral cavity [Citation26]. Ornidazole (OZ) is a nitroimidazole antiprotozoal drug that also has potent antibacterial activity against 94% of oral anaerobic bacteria and Bacteroides and Clostridium species [Citation27]. Doxycycline hyclate (DX) is an FDA-approved, potent broad-spectrum tetracycline antibiotic active against oral aerobic microorganisms [Citation28]. Thus, OZ and DX combination has been proposed to eradicate broad range of microbes (both aerobic and anaerobic) living in the periodontal cavity.
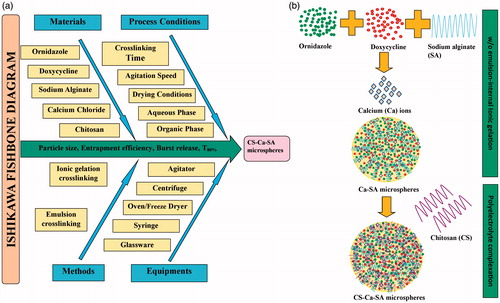
Fabrication of drug-loaded CS-Ca-SA microspheres involves consideration of a large number of critical quality attributes (CQA) as represented by Ishikawa fishbone diagram (). Screening designs like Plackett-Burman factorial designs (PBFDs) are ideal for identifying the key critical formulation variables (CFVs) affecting dependent response variables (DRVs), where interactions are not significant [Citation29]. The present study aims to fabricate, optimize and evaluate microspheres of SA and CS loaded with OZ and DX using PBFD for controlled drug therapy for chronic infections.
Figure 1. (a) Ishikawa fishbone diagram illustrating CFV and DRV involved in fabrication of CS-Ca-SA microspheres and (b) steps involved in formulation CS-Ca-SA microspheres.
Materials and methods
SA (molecular weight 216 Da) and CS (medium molecular weight, degree of deacetylation ≈80%) were procured from Sigma-Aldrich (New Delhi, India). OZ and DX were received as gift sample from Endoc Lifecare Pvt., Ltd. (Gujarat, India) and Sunpharma Industries Ltd. (Gurgaon, India), respectively. Anhydrous CaCO3 and liquid paraffin were purchased from HiMedia Laboratories (Mumbai, India). Tween 80, Span 80 and glacial acetic acid were obtained from Merck Ltd. (Mumbai, India). All the solvents and chemicals were of analytical grade. Millipore Direct-Q water was used in all experiments.
Design of experiments
PBFD was generated using Minitab® 17 software as described in . Seven CFVs, viz. SA concentration, CS concentration, CaCO3 concentration (CaC), surfactant concentration (SC), cross-linking time (CT), agitation speed (AS) and aqueous:oil phase ratio (PR) at low (−) and high (+) levels, were entered into Minitab® to generate runs (). Particle size (PS), average encapsulation efficiency (avEE), average burst release (avB) within 12 h and the average time for attaining 80% cumulative drug release (avT80%) for both drugs were selected as desirable responses ( and Citation2).
Table 1. Fabrication variables and dependent variables associated with microsphere formulation.
Table 2. Plackett-Burman factorial design for fabrication of CS-Ca-SA microspheres.
Fabrication of CS-Ca-SA microspheres
CS-Ca-SA microspheres were formulated using formulation conditions mentioned in , by two-stage process; w/o emulsion-internal ionic-gelation technique followed by polyelectrolyte complexation () [Citation16,Citation30,Citation31]. Briefly, SA and drugs solution were prepared on bath sonicator (Thermo Fisher Scientific, Mumbai, India) and mixed under agitation. Then, SA-drugs aqueous mixture was added dropwise into paraffin oil containing CaCO3 and Tween 80:Span 80 (1:1) under agitation (Remi Instruments, Mumbai, India). Agitation was carried for one hour to stabilize w/o emulsion and solidification of droplets. Then, 10 ml of liquid paraffin containing glacial acetic acid (1% v/v) was added for dissolving CaCO3. After 12 h of agitation, the formed gelled microspheres were collected by filtration followed by subsequent 5–6 washings with n-hexane, with acetate buffer pH 5.5 and finally with water to remove paraffin oil and excess of Ca2+/CS, respectively, and then observed in an optical microscope (Dewinter, optical Inc., Delhi, India) for confirmations regarding oily phase removal. Thus, Ca-SA microspheres were collected. At the second stage, fortified CS-Ca-SA microspheres were formed by immersing Ca-SA microspheres into CS solution (pH 6.5) for specified time (CT) under mild agitation of 50 rpm. The CS-Ca-SA microspheres were filtered, washed with 1% w/v acetic acid solution (to remove non-cross-linked CS) followed by water and oven-dried.
Determination of dependent response variables
Calculation of particle size (PS)
PS of microspheres was determined using Dewinter optical microscope equipped with Dewinter Biowizard 4.1 software. The average PS was calculated by measuring 100 random microspheres using Edmondson’s equation.
where n is the number of microspheres counted and d the mean size range. Further, shape factor or sphericity factor (SF) of microspheres was calculated from the maximum diameter (Dm) of particles and the diameter perpendicular to Dm (Dp) as follows [Citation32,Citation33]:
More detailed morphology of microspheres was observed using scanning electron microscope (SEM) (FEI Quanta 200 F, Tokyo, Japan).
Calculation of entrapment efficiency (EE)
Fifty microgram of microspheres was soaked in 10 ml of phosphate-buffered solution pH 6.8 (PBS) and bath sonicated for 30 min, and then centrifuged (Eltek RC 4100F, Mumbai, India) at 6000 rpm and filtered. Free drug was calculated from filtrate using simultaneous UV method (Shimadzu UV 1800, Tokyo, Japan) [Citation6]. The entrapment efficiency of drugs was determined using the following equation:
Average entrapment efficiency (avEE) was calculated from individual EE of OZ and DX.
In-vitro drug release studies
For in-vitro drug release, about 100 mg of microspheres was suspended in PBS containing dialysis membranes (HiMedia Laboratories, Mumbai, India), placed in 500 ml of PBS in USP paddle apparatus (Campbell Electronics, Mumbai, India) maintained at 50 rpm and 37 ± 0.5 °C [Citation34]. At predefined time intervals, 5 ml of samples was withdrawn from the dissolution medium and equivalent volume of fresh dissolution medium was added to maintain sink condition. Further, avT80% was calculated after calculating total drug released.
Characterization of optimized CS-Ca-SA microspheres
Solid state characterization
Fourier transform infrared (FTIR) spectroscopic studies of drugs, polymers and microspheres were done on Shimadzu, Model 8400 (Tokyo, Japan), by pressed pellet technique. Differential scanning calorimetry (DSC) thermograms of samples were plotted using Mettler DSC 25 (Maharashtra, India), at a heating rate of 10° C/min. X-ray diffraction (XRD) patterns of samples were obtained on portable X-ray diffractometer (Rigaku, Tokyo, Japan) using Ni-filtered Cu-Kα radiation operated at a voltage of 40 kV and 20 mA.
Assessment of drug release kinetics
The kinetic release models, zero-order, first-order, Higuchi, Hixson–Crowell and Korsmeyer–Peppas, were fitted to the release data to examine the release mechanism.
Korsmeyer–Peppas model is as follows:
where Mt/M∞ is the fraction of drug released at time t, k is release constant, and n is release exponent, which is indicative of the drug release mechanism [Citation18].
Furthermore, the diffusion constant (D) was determined as follows:
where m is the slope of the curve (Mt/M∞ vs. t−1/2) and r is the average diameter of microspheres [Citation19].
Swelling capabilities and erosion studies
The swelling capabilities (S) of microspheres were estimated by soaking about 50 mg of microspheres into 5 ml of simulated saliva (pH 6.8) contained in glass vials kept in a beaker containing water maintained at 37 °C. The swollen microspheres were weighed after blotting with filter paper to remove surface water [Citation35].
For erosion studies, blotted microspheres were dried at 40 °C until constant weight. After drying, the remaining dry weight was determined [Citation24,Citation36]. The erosion was estimated regarding % remaining weight as follows:
Surface pH measurement
About 2 mg of microspheres was allowed to swell in 1 ml of PBS placed in glass test tubes for 5 min [Citation36]. The surface pH was recorded using glass microelectrode of Deluxe pH meter (PERFIT, Ambala, India) on the surface of microspheres.
In-vitro mucoadhesion studies
In brief, specified quantity of microspheres was spread on cleaned and cut (1 × 1 cm2) bovine cheek membrane (obtained from local slaughter houses) fixed on a glass plate with cyanoacrylate, and kept for 10 min for proper hydration and adhesion [Citation34]. Afterward, the glass plate was inclined at an angle of 45° and membrane was washed with PBS. The washings were collected and oven-dried (40 °C) to determine non-adhered microspheres. In-vitro mucoadhesion (%M) was calculated in terms of weight percentage of microspheres that remain adhered to the mucosal surface as follows:
Antimicrobial activity
For estimating antimicrobial activity, drug release samples were assessed for zone of inhibition by disc diffusion method. Drug release samples collected at 12, 24, 48 and 72 h were tested for antimicrobial activity for Staphylococcus aureus (MTCC96) and Escherichia coli (MTCC723) using molten Muller-Hinton agar media (HiMedia Laboratories, Mumbai, India). About 10 µl of release samples were poured on sterile disc (6 × 6 mm) placed on the surface of media and incubated for 24 h at 37 ± 0.5 °C. The diameter (mm) of zone of growth inhibition was calculated by subtracting disc diameter from the total zone of inhibition.
Cytocompatibility evaluation
Mouse skin fibroblasts cell lines (L929) were cultured in Dulbecco’s modified Eagle’s medium (DMEM), 10% foetal bovine serum and 100 μg/mL streptomycin and 100 IU/mL penicillin as antibiotics. The cells were preserved at 37 °C in a humidified atmosphere with 5% CO2 and were subcultured twice a week.
The extracts were prepared by incubating microspheres at concentrations of 0.01 g/ml (A), 0.05 g/ml (B) and 0.1 g/ml (C) in DMEM culture for 24 h at 37 °C. 100 µl of filtered, sterile extracts was incubated with L929 cells for 120 h (n = 6) in 96-well microplates. Control wells were treated with 100 μL DMEM.
At established time points, cell numbers were estimated using Sulphorhodamine (SRB) assay. Optical density was read at 540 nm using microplate reader (ELISA plate reader; Bio-Rad, Hercules, CA). The percentage cell viability and growth inhibition were calculated by the following equation:
Concentration vs. % inhibitions curve was plotted, and IC50% (concentration for 50% cell growth inhibition) values were estimated by regression analysis. Moreover, the cells treated with A, B and C concentrations of microspheres for 24 h and stained with fluorescein diacetate and ethidium bromide, and evaluated microscopically using confocal laser scanning microscope (Carl Zeiss, Oberkochen, Germany).
Stability studies
The stability study of an optimized batch of microspheres was performed at three storage conditions 5 ± 3 °C, 40 ± 2 °C and 75 ± 5%, 25 °C and 70% RH by keeping in the refrigerator, humidity-controlled oven and room temperature, respectively, for six months. The microspheres were investigated for morphology, PS, EE and total drug content (TDC) to assess the stability. The shelf-life of microspheres was evaluated using Minitab® 17.
Statistical analysis
All determinations were expressed as mean ± standard deviation (SD) (n = 3). For cytocompatibility and antimicrobial studies, all groups were compared with control using two-way ANOVA followed by Bonferroni post-tests and results are reported as mean ± standard error mean using GraphPad Prism software. Results of stability studies were statistically compared with fresh sample by one-way ANOVA followed by Dunnett’s multiple comparison tests at 95% confidence interval. p < .05 was considered as level of significance.
Results and discussion
Formation of microspheres
CS-Ca-SA microspheres were successfully formulated by using combination of w/o emulsion-internal ionic-gelation and polyelectrolyte complexation methods. Reportedly, Ca-SA microspheres can be produced by external or internal gelation techniques. In external gelation, microspheres were formed spontaneously after injecting alginate solution into CaCl2 (water-soluble salt) solution. In contrast, in internal gelation method, first droplets were emulsified by dropping in the oil phase containing CaCO3 (water-insoluble salt) to form microemulsion (w/o) (). Subsequently, CaCO3 was dissolved to liberate Ca2+, CO2 and H2O by lowering pH by addition of acetic acid [Citation37,Citation38]. The released Ca2+ ions interact with –COO- moiety of alginate by partitioning internally to aqueous droplets yielding homogeneous microspheres [Citation37]. Liberation of CO2 introduces porosity to the structure [Citation39]. Furthermore, polyelectrolyte complexation of SA with CS circumvents the homogeneity and porosity of structure. Heterogeneity is caused by the presence of two types of interactions, i.e. alginate-Ca2+ (ionic interaction) and alginate-CS (polyelectrolyte complexation) [Citation18].
Screening of variables
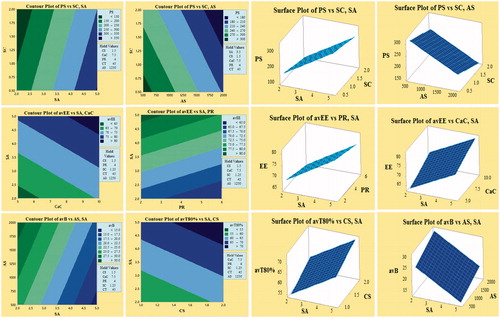
PBFD was successfully applied, and 12 batches of CS-Ca-SA microspheres were formulated based on selected CFVs and optimized by desired DRVs (). The selected responses PS, avEE, avB and avT80% were observed in the range of 74–461 (µm), 62.45–86.20 (%), 12.21–34.63 (%) and 52.73–76.78 (h), respectively, indicated a significant role of formulation variables on DRVs. Pareto plots disclosed most significantly influencing formulation variables on the responses (. Out of seven CFVs, only CT had non-significant (p > .05) effect on all responses. The significantly influencing factors included SA, AS and SC on PS; SA, CaC and PR on avEE; SA and AS on avB; and SA and CS on T80%. This pattern of influence is well correlated by contour and surface plots (.
Figure 2. Demonstration of Pareto plots for the selection of CFV having significant effect on desired DRVs, viz. particle size (PS), average encapsulation efficiency (avEE), average burst release (avB) and average time for 80% cumulative drug release (avT80%).
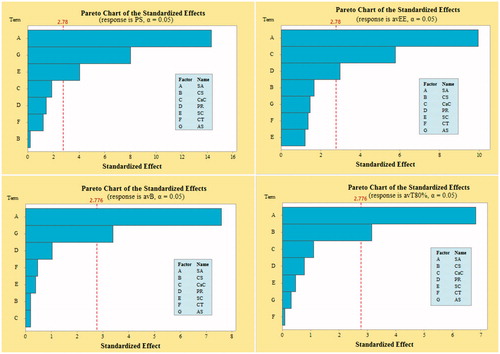
Figure 3. Contour and corresponding surface plots describing most influencing factors on particle size (PS), average encapsulation efficiency (avEE), average burst release (avB) and average time for 80% cumulative drug release (avT80%).
The summary of regression parameters and associated p-values and F-values is given in . The mathematical model generated for each response was found statistically significant (p < .05). The closeness of adjusted R2 to R2 values indicated that good fit of generated model.
Table 3. Summary of ANOVA results and regression parameters.
Particle size
SA with positive coefficient had positive effect on PS, whereas AS and SC having negative coefficient had inverse effect on PS as elaborated by linear equations. An increase in SA content increases the viscosity of aqueous droplets and thereby increases the resistance force during stirring and decreases the shrinkage due to water loss during drying process, causing increase in PS. Conversely, high AS and high SC offer decrement in PS by lowering the surface tension between aqueous and organic phase and providing interfacial stabilization against coalescence of particles. Moreover, AS imparted breakdown force to aqueous emulsion droplets and decreased the size of microspheres.
Entrapment efficiency
From linear equations, CaC and SA are found directly proportional to avEE, while PR is inversely proportional to avEE. Increased SA and CaC have increased entrapment of drugs by increasing cross-linking networks and decreasing porosity [Citation9]. Reduced avEE was observed with increase in PR due to drug leakage by aggregation of droplets due to formation of a less stable emulsion.
In-vitro drug release
In polymer-controlled drug delivery, drug release pattern is characterized by burst effect and controlled effect signified by avB and avT80%, respectively:
From linear equations, it is clear that avB is inversely related to SA concentration and directly related to AS. This pattern is ascribed to an increase in entrapment of drugs on increasing SA concentration as lesser drug is available for burst release. Similarly, on increasing agitation, smaller particles are formed bringing lower entrapment of drugs which in turn increases the burst release. Alternatively, avT80% had a direct relation with SA and CS concentrations. The increment in both polymer concentrations had offered more matrix and cross-link networks causing slow release of entrapped antimicrobials with higher T80%.
Optimization
Optimum formulation was selected based on the criteria of obtaining the minimum particle size and burst release and maximum entrapment and T80%. The CFVs obtained for optimized batch are as follows: SA-5%, CS-2%, CaC-5%, PR-1:2, SC-1%, CT-30 min, AS-2000 rpm with composite desirability (D) of 0.7309. Bias (%) was found within accepted limits for the experimentally obtained DRVs, thus validating the predictability of the model ().
Table 4. Comparison of predicted and experimental value for validation of model.
Characterization of optimized batch
FTIR
The compatibility and interactions between polymers and drugs were determined by FTIR studies. The infrared peaks of CS were observed at 3424, 2876, 1655, 1599, 1423 and 1381 cm−1 corresponding to the –NH2, –OH stretching, carbonyl (C = O) stretching of the secondary amide (amide I band), and bending vibrations of the N–H (N-acetylated residues, amide II band), N–H stretching of the amide and ether and N–H bonds (amide III band), respectively () [Citation40].
Figure 4. Overlay spectrum: (a) FTIR spectra of ornidazole, doxycycline, chitosan, alginate, physical mixture, placebo CS-Ca-SA and drug-loaded CS-Ca-SA microspheres; (b) DSC graphs of ornidazole, doxycycline, alginate, chitosan and CS-Ca-SA microspheres; and (c) XRD pattern of ornidazole, doxycycline, chitosan, alginate and CS-Ca-SA microspheres.
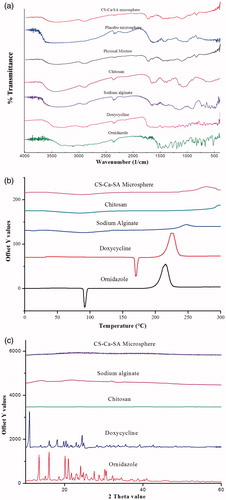
In spectra of SA, 1030 cm−1 band (C–O–C stretching) represents its saccharide structure. Moreover, two strong absorption peaks at 1611 and 1415 cm−1 belong to asymmetrical and symmetrical stretching vibrations of the –COO– group, respectively. A little shifting of these peaks to 1637 and 1415 cm−1 was observed in placebo CS-Ca-SA microspheres and drug-loaded CS-Ca-SA microspheres. In addition, peaks of CS at 1599 and 3424 cm−1 were shifted to 1559 and 3448 cm−1 in microspheres. These alterations and shifting in the peaks of CS and SA evidence the cross-linking of NH4+ of CS to carboxylate ions of SA via electrostatic interactions.
Infrared spectra of OZ exhibited characteristic peaks at 3165, 3088, 1154 and 832 cm−1 owing to the presence of O–H stretching, aromatic C–H stretching, aliphatic C–H stretching and C-Cl group, respectively. Absorption at 2961, 1620, 1600, 3280, 3455 and 3330 cm−1 corresponds to C–H, C–C, aromatic C = C, C–O, primary O–H and N–H bond present in DX, respectively. These peaks of drugs are conserved in CS-Ca-SA microspheres and were absent in placebo CS-Ca-SA microspheres. Physical mixtures exhibited all the peaks of OZ, DX and polymers with decreased transmittance indicating the lack of any type of interaction between drugs and polymers.
DSC
DSC of polymers and drugs was plotted between intensity and increasing temperature. The DSC thermograms of SA and CS exhibited endothermic peaks at 86.6 °C and 72.0 °C, respectively, contributed by dehydration of hydrophilic groups (). Additionally, the exothermic peaks of SA (250 °C) and CS (300 °C) resulted from degradation of polymers. CS-Ca-SA microspheres exhibited broad endotherm formed by coalescence of peaks of SA and CS as a result of cross-linking. Exothermic peak at 250 °C corresponds to degradation or partial decarboxylation and oxidation of CS-Ca-SA microspheres. DX and OZ thermograms recorded sharp melting peaks at about 169 °C and 92 °C, respectively, belonging to their crystal lattice structure (). These drugs peaks were absent in microspheres, concluding their transformation to amorphous state during formulation and uniform dispersion into polymers.
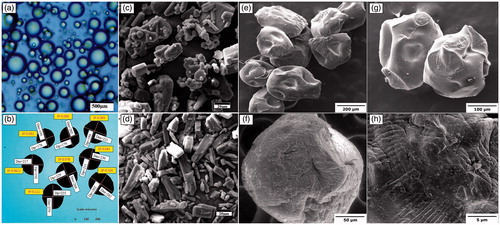
Figure 5. Microscopic view of microspheres. Optical microscopic images of (a) w/o microemulsion alginate drops dispersed in oil phase and (b) calculation of sphericity factor of microspheres. SEM images of (c) ornidazole powder, (d) doxcycline hyclate, (e, f, g) CS-Ca-SA microspheres and (h) surface view of microspheres.
XRD
XRD plots of polymers and drugs are presented in . The XRD patterns of SA and CS do not present any diffraction peaks which confirm their amorphous and water-soluble properties (). Sharp characteristic 2θ peaks for OZ and DX explain their crystallite structure. Besides, microspheres showed absence of any peak because of changes in crystalline drugs to amorphous forms. This change in crystallinity of drugs is ascribed to an increase in number of water molecules possessing higher degrees of freedom in the crystal structure [Citation41]. The outcomes of XRD and DSC studies supported uniform dispersion of drugs into polymers and amorphous feature of microspheres.
Microscopic studies
The hydrated particles of optical microscopic images () were more spherical than dried microspheres from SEM images (). This difference can be attributed to difference in instruments and energy sources and resolution used for viewing [Citation12]. The surface roughness of microspheres was added by free drug particles and polymer deposits ().
SF is an efficient dimensionless shape indicator classified as tear-shaped (0.22), egg-shaped (0.077), pear-shaped (0.050) and spherical (0.0016) [Citation33]. The 0.01 < SF >0.1 indicated particles ranged from spherical to pear-shaped (). Therefore, the deviation of SF from zero could be assigned to surface depressions formed by solvent evaporation during drying process [Citation25].
Drug release kinetics
The in-vitro drug release profiles of OZ and DX from optimized microspheres in PBS exhibit initial burst release and then extended release (. Burst release might likely be due to rapid diffusion and desorption of surface-adsorbed drugs. It acts as loading dose especially for treatment of microbial infections, preceding that subsequent prolonged and controlled release for 120 h was observed.
Figure 6. In-vitro dissolution profiles of ornidazole (OZ) and doxycycline hyclate (DX) from optimized CS-Ca-SA microspheres in phosphate buffer pH 6.8. Vertical bars indicate mean ± SD.
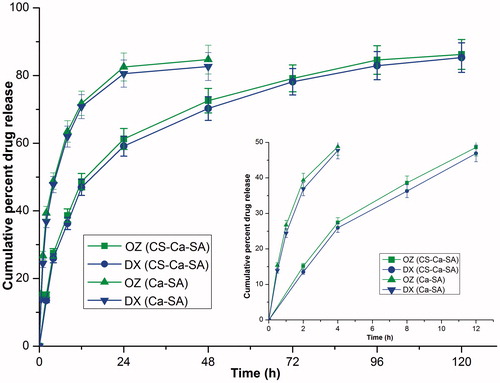
The swelling, drug release and kinetics of CS-Ca-SA microspheres are dependent of interactions between polymers: (i) between NH3+ (CS) and –COO- (SA); (ii) between Ca2+ and –COO− (SA); and (iii) interchain hydrogen bonds. Further, CS-Ca-SA microspheres exhibited prolonged release in PBS, which is more probably due to stabilizing effect of phosphate ions on polycation salts (CS) [Citation42].
The drug release showed good correlation with Higuchi model (R2 = 0.98) revealing the matrix system of microspheres. This observation supported the movement of chitosan inside the porous alginate microspheres during preparation. Further, release exponent “n”>0.43, indicated non-Fickian mechanism revealing release of both drugs, was controlled by diffusion plus swelling of hydrophilic polymer chains of CS and SA [Citation43,Citation44]. A high “D” for OZ and DX indicated their greater tendency of diffusion across hydrophilic polymers (). The “D” in the case of CS-Ca-SA was lower than Ca-SA microspheres because of increased density of polymer matrix [Citation45].
Table 5. Drug release kinetics of ornidazole (OZ) and doxycycline hyclate (DX) from CS-Ca-SA and Ca-SA microspheres.
Swelling and erosion studies
The swelling and erosion of microspheres were dependent on relaxation of polymer networks due to differences in osmotic pressure inside the microspheres and outside (. The swelling was continued till equilibrium between osmotic pressure and forces of the cross-linking bonds were attained. When these two forces become equal, water absorption within microspheres stopped and maximum swelling was attained [Citation45].
Figure 7. Comparative (a) swelling curve and (b) erosion curve of optimized batches of Ca-SA and CS-Ca-SA microspheres in simulated saliva pH 6.8. Vertical bars show mean ± SD.
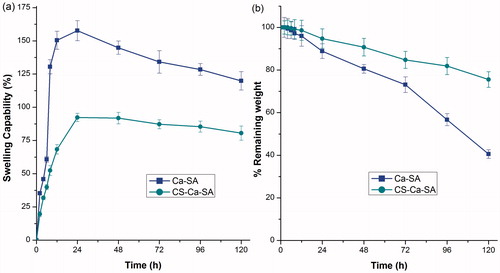
After certain point, a decrease in swelling curve and erosion curve was observed due to dissolution and erosion of polymers. When compared to Ca-SA microspheres, the CS-Ca-SA showed minimal swelling and greater erosion, caused by presence of additional cross-link networks, non-solubility and non-ionization of CS at neutral pH (. Excessive swelling of Ca-SA could be explained by weak cross-link networks and extraction of Ca2+ ions by PO4− ions of buffer leading to disruption of structure [Citation35].
Surface pH
Extreme pH conditions cause damage and irritation to the oral mucosa. In particular, formulations with pH 6–7 are recommended for oral, buccal, mucosal and periodontal pocket infections. The surface pH of optimized batch of CS-Ca-SA microspheres was 6.5 ± 0.45 and Ca-SA was 6.6 ± 0.67. In both cases, it was near neutrality and acceptable.
Mucoadhesion studies
Mucoadhesion is an important parameter for estimation of stay of microspheres at its site of action, viz. periodontal pockets. Optimized CS-Ca-SA microspheres provided good mucoadhesivity with 78.48 ± 0.49% microsphere remained adhered to mucosal surface after washing. On the other hand, Ca-SA showed lower 42 ± 0.67% mucoadhesion. Such high mucoadhesive property of microspheres was contributed by cationic nature of CS having high affinity for negatively charged mucus membranes [Citation16].
Antimicrobial activity
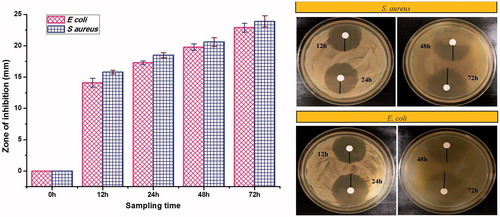
In all cases, a significant (p < .05) zone of inhibition had been observed confirming antimicrobial potency of microspheres against S. aureus and E. coli (. Furthermore, the sample collected at 12 h corresponds to burst release of drugs and could be well correlated with the significant zone of inhibition desirable for initiation of antimicrobial action. Also, the zone of inhibitions of samples increased with sampling time, indicating antimicrobial activity of drugs is dose dependent.
Figure 8. Zone of inhibition of dissolution study samples against S. aureus and E. coli. Vertical bars indicate mean ± standard error mean.
Cytocompatibility
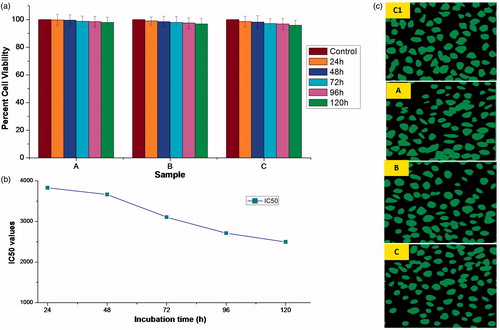
Microsphere samples showed cytocompatibility with L929 cell lines by SRB assay () and high cell viability with non-significant difference (p < .05) was observed in all samples (A, B and C). Furthermore, anti-proliferative effects of microspheres were disclosed by very high values of IC50 at different incubation times of 24 h (3829.42 mg/ml), 48 h (3663.23 mg/ml), 72 h (3105.57 mg/ml), 96 h (2711.34 mg/ml) and 120 h (2497.57 mg/ml) (). These results ensure the long-term safety of microspheres for in-vivo applications. However, IC50 values decreased with increasing incubation time. Apparently, microsphere extracts (A, B and C) showed the substantial number of L929 cells when observed under fluorescent microscope as compared to control ().
Figure 9. (a) Percentage cell viabilities of microsphere samples, A (0.01 g/ml), B (0.05 g/ml), C (0.1 g/ml) and control, prepared by incubating in DMEM media for 120 h against L929 cell lines. Vertical bars represent mean ± standard error mean (n = 6); (b) incubation time vs. IC50 plot; and (c) fluorescent microscopic images showing cytocompatibility of various microsphere samples (A, B, C and control (C1)) with L929 cell lines.
Stability studies
Stability studies were performed by storing microspheres for six months at three storage conditions. Optimized batch observed non-significant (p > .05) differences in PS, EE, avB and T80% for both drugs at all storage conditions (). The shelf-life of a product is defined as the time for which its potency remains within an approved specification and was predicted as time in which TDC reaches 90%.
Figure 10. Stability study of optimized batch of microspheres at different storage conditions, viz. Storage 1 (refrigeration), Storage 2 (room temperature) and Storage 3 (high temperature). (a) Histograms representing stability parameters. Vertical bars indicate mean ± SD. (b) Shelf-life plots. LS: lower specification (90%).
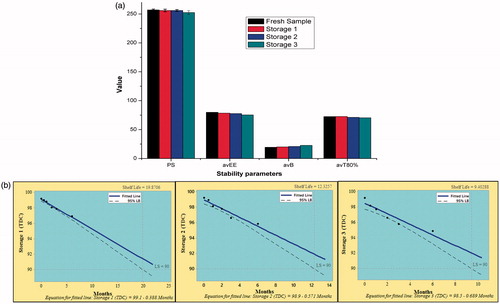
The shelf-life of microspheres was found to be 19.87, 12.35 and 9.40 months when stored at refrigeration, room temperature and high temperature storage, respectively (. This indicated high stability of microspheres for long period especially at refrigerated storage.
Conclusion
Periodontal disease requires prolonged treatment and present study provided deep insight into the captivating features of CS-Ca-SA microspheres for the simultaneous controlled delivery of OZ and DX desirable for the treatment of chronic periodontal infections. By virtue of PBFD, successful efforts have been made for minimizing PS and burst release as well as for maximizing EE and T80%. Microspheres provided controlled and prolonged delivery of drugs with burst effect. Antimicrobial studies showed that the drug released from microspheres was effectively inhibiting the growth of E. coli and S. aureus. Thus, formulated microspheres were found biodegradable, mucoadhesive, non-toxic and stable for prolonged use. Conclusively, CS-Ca-SA microspheres showed fortified characteristics with high potential applicability for the prolonged treatment of periodontal infections.
Acknowledgements
First author acknowledges Teaching Assistantship from Indian Institute of Technology (BHU), Varanasi, India, for carrying out this research work.
Disclosure statement
All authors declare that there is no conflict of interest between them.
References
- Bansal M, Mittal N, Singh TB. Assessment of the prevalence of periodontal diseases and treatment needs: a hospital-based study. J Indian Soc Periodontol. 2015;19:211–215.
- Oh TJ, Eber R, Wang HL. Periodontal diseases in the child and adolescent. J Clin Periodontol. 2002;29:400–410.
- Armitage GC. Development of a classification system for periodontal diseases and conditions. Ann Periodontol. 1999;4:1–6.
- Yadav SK, Khan G, Mishra B. Advances in patents related to intrapocket technology for the management of periodontitis. Recent Pat Drug Deliv Formul. 2015;9:129–145.
- Khan G, Yadav SK, Patel RR, et al. Development and evaluation of biodegradable chitosan films of metronidazole and levofloxacin for the management of periodontitis. AAPS PharmSciTech. 2016;17:1312–1313.
- Yadav SK, Khan G, Bansal M, et al. Screening of Ionically Crosslinked Chitosan-Tripolyphosphate Microspheres Using Plackett-Burman Factorial Design for the Treatment of Intrapocket Infections. Drug Dev Ind Pharm. 2017;1–16. [Epub ahead of print]. doi: 10.1080/03639045.2017.1349782
- Pandey G, Yadav S, Mishra B. Preparation and characterization of isoniazid and lamivudine co-loaded polymeric microspheres. Artif Cells Nanomed Biotechnol. 2016;44:1867–1877.
- Hoad C, Rayment P, Cox E, et al. Investigation of alginate beads for gastro-intestinal functionality, Part 2: In vivo characterisation. Food Hydrocolloids. 2009;23:833–839.
- Zeeb B, Saberi AH, Weiss J, et al. Retention and release of oil-in-water emulsions from filled hydrogel beads composed of calcium alginate: impact of emulsifier type and pH. Soft Matter. 2015;11:2228–2236.
- Li Y, Hu M, Du Y, et al. Control of lipase digestibility of emulsified lipids by encapsulation within calcium alginate beads. Food Hydrocolloids. 2011;25:122–130.
- Benavides S, Cortés P, Parada J, et al. Development of alginate microspheres containing thyme essential oil using ionic gelation. Food Chem. 2016;204:77–83.
- Noppakundilograt S, Piboon P, Graisuwan W, et al. Encapsulated eucalyptus oil in ionically cross-linked alginate microcapsules and its controlled release. Carbohydr Polym. 2015;131:23–33.
- Silva CM, Ribeiro AJ, Figueiredo IV, et al. Alginate microspheres prepared by internal gelation: development and effect on insulin stability. Int J Pharm. 2006;311:1–10.
- Tsirigotis-Maniecka M, Gancarz R, Wilk KA. Preparation and characterization of sodium alginate/chitosan microparticles containing esculin. Colloids Surf A Physicochem Eng Asp. 2016;510:22–32.
- Mennini N, Furlanetto S, Cirri M, et al. Quality by design approach for developing chitosan-Ca-alginate microspheres for colon delivery of celecoxib-hydroxypropyl-β-cyclodextrin-PVP complex. Eur J Pharm Biopharm. 2012;80:67–75.
- Zhang Y, Wei W, Lv P, et al. Preparation and evaluation of alginate-chitosan microspheres for oral delivery of insulin. Eur J Pharm Biopharm. 2011;77:11–19.
- Li X, Kong X, Shi S, et al. Preparation of alginate coated chitosan microparticles for vaccine delivery. BMC Biotechnol. 2008;8:1–10.
- Dai YN, Li P, Zhang JP, et al. Swelling characteristics and drug delivery properties of nifedipine‐loaded pH sensitive alginate–chitosan hydrogel beads. J Biomed Mater Res. 2008;86:493–500.
- Gupta K, Jabrail FH. Glutaraldehyde cross-linked chitosan microspheres for controlled release of centchroman. Carbohydr Res. 2007;342:2244–2252.
- Amiji MM. Tetracycline-containing chitosan microspheres for local treatment of Helicobacter pylori infection. Cellulose. 2007;14:3–14.
- De S, Robinson D. Polymer relationships during preparation of chitosan-alginate and poly-l-lysine-alginate nanospheres. J Control Release. 2003;89:101–112.
- Silva CM, Ribeiro AJ, Figueiredo M, et al. Microencapsulation of hemoglobin in chitosan-coated alginate microspheres prepared by emulsification/internal gelation. The AAPS Journal. 2005;7:E903–E913.
- Vandenberg G, De La Noue J. Evaluation of protein release from chitosan-alginate microcapsules produced using external or internal gelation. J Microencapsul. 2001;18:433–441.
- Sriamornsak P, Thirawong N, Korkerd K. Swelling, erosion and release behavior of alginate-based matrix tablets. Eur J Pharm Biopharm. 2007;66:435–450.
- Mladenovska K, Raicki R, Janevik E, et al. Colon-specific delivery of 5-aminosalicylic acid from chitosan-Ca-alginate microparticles. Int J Pharm. 2007;342:124–136.
- Aitken S, Birek P, Kulkarni G, et al. Serial doxycycline and metronidazole in prevention of recurrent periodontitis in high-risk patients. J Periodontol. 1992;63:87–92.
- Ogrendik M. Treatment of rheumatoid arthritis with ornidazole: a randomized, double-blind, placebo-controlled study. Rheumatol Int. 2006;26:1132–1137.
- Raval JP, Naik DR, Amin KA, et al. Controlled-release and antibacterial studies of doxycycline-loaded poly (ε-caprolactone) microspheres. J Saudi Chem Soc. 2014;18:566–573.
- Analytical Methods Committee AN. Experimental design and optimisation (4): Plackett-Burman designs. Anal Methods. 2013;5:1901–1903.
- Poncelet D, Lencki R, Beaulieu C, et al. Production of alginate beads by emulsification/internal gelation. I. Methodology. Appl Microbiol Biotechnol. 1992;38:39–45.
- Ribeiro AJ, Silva C, Ferreira D, et al. Chitosan-reinforced alginate microspheres obtained through the emulsification/internal gelation technique. Eur J Pharm Sci. 2005;25:31–40.
- Chan E-S. Preparation of Ca-alginate beads containing high oil content: influence of process variables on encapsulation efficiency and bead properties. Carbohydr Polymers. 2011;84:1267–1275.
- Chan E-S, Lee B-B, Ravindra P, et al. Prediction models for shape and size of ca-alginate macrobeads produced through extrusion-dripping method. J Colloid Interface Sci. 2009;338:63–72.
- Jha RK, Tiwari S, Mishra B. Bioadhesive microspheres for bioavailability enhancement of raloxifene hydrochloride: formulation and pharmacokinetic evaluation. AAPS PharmSciTech. 2011;12:650–657.
- Xu Y, Zhan C, Fan L, et al. Preparation of dual crosslinked alginate-chitosan blend gel beads and in vitro controlled release in oral site-specific drug delivery system. Int J Pharm. 2007;336:329–337.
- Govender S, Pillay V, Chetty D, et al. Optimisation and characterisation of bioadhesive controlled release tetracycline microspheres. Int J Pharm. 2005;306:24–40.
- Poncelet D, De Smet BP, Beaulieu C, et al. Production of alginate beads by emulsification/internal gelation. II. Physicochemistry. Appl Microbiol Biotechnol. 1995;43:644–650.
- Lopes M, Abrahim B, Veiga F, et al. Preparation methods and applications behind alginate-based particles. Expert Opin Drug Deliv. 2017;14:769–782.
- Leong J-Y, Lam W-H, Ho K-W, et al. Advances in fabricating spherical alginate hydrogels with controlled particle designs by ionotropic gelation as encapsulation systems. Particuology. 2016;24:44–60.
- Li P, Dai Y-N, Zhang J-P, et al. Chitosan-alginate nanoparticles as a novel drug delivery system for nifedipine. Int J Biomed Sci. 2008;4:221–228.
- Mishra B, Singh AK, Yadav SK. Study of comparative aspects of gastroretentive delivery of cefixime trihydrate from microspheres and microsphere based tablets. J Pharm Investig. 2015;45:541–554.
- Liu L-S, Liu S-Q, Ng SY, et al. Controlled release of interleukin-2 for tumour immunotherapy using alginate/chitosan porous microspheres. J Control Release. 1997;43:65–74.
- Martinez A, Arana P, Fernández A, et al. Synthesis and characterisation of alginate/chitosan nanoparticles as tamoxifen controlled delivery systems. J Microencapsul. 2013;30:398–408.
- Ma N, Xu L, Wang Q, et al. Development and evaluation of new sustained-release floating microspheres. Int J Pharm. 2008;358:82–90.
- Pasparakis G, Bouropoulos N. Swelling studies and in vitro release of verapamil from calcium alginate and calcium alginate-chitosan beads. Int J Pharm. 2006;323:34–42.