
Abstract
Hyperthermia treatment of cancerous cells has been recently developed drastically with the help of nanostructures. Heating of gold nanoparticles in non-invasive radiofrequency electric field (RF-EF) is a promising and unique technique for cancer hyperthermia. However, because of differences between particles (i.e. their surface chemistry and dispersion medium) and between RF-EF sources, the research community has not reached a consensus yet. Here, we report the results of investigations on heating of gold nanoparticles and gold nanorods under RF-EF and feasibility of in-vitro cancer hyperthermia. The heating experiments were performed to investigate the role of particle shape and surface chemistry (CTAB, citrate and PEG molecules). In-vitro hyperthermia was performed on human pancreatic cancer cell (MIA Paca-2) with PEG-coated GNPs and GNRs at concentrations that were found non-toxic based on the results of cytotoxicity assay. Application of RF-EF on cells treated with PEG-GNPs and PEG-GNRs proved highly effective in killing cells.
Introduction
Cancer is a major cause of death worldwide. Based on American Cancer Society estimation until 2030, cancer will be cause of death in more than 13.2 million death reports, and more than 21.4 million new cancer cases will be detected worldwide, mostly because of increasing ageing population [Citation1]. Since tumour resection through surgery is only possible for 40% of cancer patients, other cancer treatment modalities have to be considered by physicians. Chemotherapy and radiotherapy as common methods have some serious side effects like systematic and local toxicity that have to be considered [Citation2]. Because of these problems, there is a lot of effort to investigate new techniques or improve current techniques to fight cancer with less implication and more effectiveness [Citation3].
Nanotechnology as a multidisciplinary field of research has made marvellous advances in engineering, physics, chemistry, biology and medicine. Nanotechnology has proved great potential for different medical applications, such as cancer diagnosis and treatment [Citation4].
Different types of gold nanostructures have found unique capabilities in detection and treatment of cancerous cells. Interesting properties, like surface plasmon resonance (SPR) and instinct biocompatibility, make gold nanostructures as useful tools in many types of detection/diagnosis and treatment techniques [Citation5–7]. One of these interesting methods is hyperthermia that uses gold nanostructures in two different approaches. The first approach is photo-thermal therapy, where gold nanostructures are irradiated by high-intensity near-infrared (NIR) light and produce heat through SPR in gold nanostructures [Citation8]. The second approach that has been investigated recently is radiofrequency electric field (RF-EF) exposure of gold nanoparticles (GNPs) [Citation9,Citation10].
RF ablation has been used for decades for degradation of malignant tissues, but this invasive treatment needs insertion of electrodes into tumour which makes it less applicable for most of the cancers. In addition, because of inhomogeneous heat distribution in tumour tissue around electrode, this technique is not too effective [Citation11]. The idea of using GNPs under non-invasive exposure of RF-EF for cancer treatment by Kanzius et al. [Citation10,Citation12] attracted a lot of interest and even critics among researchers, because theoretically one could treat any tumour in human body with this technique. Cancerous cells have been heated and killed in vitro and in vivo using RF-EF exposure [Citation13]. However, there are some contradictory results. Initially, Joule heating model was developed to explain this phenomenon [Citation14], but later Joule heating by ionic background was demonstrated as a primary reason for heating [Citation15,Citation16]. Many other theoretical mechanisms have been proposed for RF-EF heating of GNPs. The shape of the sample holder has also been suggested as an important factor [Citation17,Citation18]. Electrophoretic mechanism has been introduced for sub-10 nm GNPs [Citation19] and has been investigated [Citation9]. In another report, it has been demonstrated that small thiol-capped gold clusters have shown ferromagnetic properties that did not exist in larger particles or bulk gold [Citation20] and magnetic heating of gold clusters under magnetic radiofrequency exposure along with heating under electric field is reported [Citation21]. A recent report suggested that absorption of the RF-EF energy by the Fermi electrons occurs with involvement of the longitudinal acoustic vibrational mode [Citation22].
For RF-EF heating of GNPs, two different classes of affecting factors including particle-related factors and RF-EF sources have been emphasized. For first group, size, concentration and aggregation of GNPs are the most effective factors that are considered [Citation23]. Elongated nanostructures like carbon nanotubes (CNTs) have been investigated for RF-EF heating [Citation24], but shape effect of GNPs has not been considered as a factor that might interfere with heating phenomenon.
It is clear that particle size is an important factor in the biodistribution of nanoparticles. It has been shown that small GNPs which can be used for RF-EF hyperthermia get cleared rapidly mostly by renal clearance or reticuloendothelial system (RES). However, particles with proper size and surface chemistry could circulate much longer in blood stream. In case of polyethylene glycol (PEG)-coated gold nanorods, it has been demonstrated that intravascular injection results in sufficient accumulation of gold nanorods in tumour site that could be used for photo-thermal destruction of cancer cells [Citation25–27].
Here, we report the application of GNPs and nanorods (GNRs) with different surface chemistries for RF-EF heating and in-vitro hyperthermia studies. Gold nanostructures were synthesized with cetyltrimethylammonium bromide (CTAB) coating. As CTAB is toxic to cells [Citation28], it was washed in steps and was finally replaced with PEG molecules. This makes nanostructures more favourable for biomedical applications because of passive surface and long circulation times [Citation29,Citation30].
Materials and methods
Materials
Gold(III) chloride trihydrate (HAuCl4.3H2O, 99.9%), poly(ethylene glycol) methyl ether thiol 6000 kDa (mPEG-SH) and hydrochloric acid (HCl, ACS reagent, 37%) were obtained from Sigma-Aldrich (St. Louis, MO). Sodium borohydride (NaBH4, 99%) and cetyltrimethylammonium bromide (CTAB, 97%) were obtained from Merck Chemicals (Darmstadt, Germany). Silver nitrate (AgNO3, 99%) was purchased from Dr. Mojallali Chemicals Company (Tehran, Iran). Ascorbic acid (99%) was purchased from Acros Organics (New Jersey, USA). All aqueous solutions were prepared with deionized (DI) water (Barnstead E-Pure™18.3 MΩ water). Glassware was cleaned with aqua regia and rinsed thoroughly with DI water.
Human pancreatic carcinoma cell line ((NCBI C459) (MIA Paca-2)) was purchased from Pasteur Institute (Tehran, Iran). Cells were maintained in RPMI-1640 culture medium (Biosera, Nuaillé, France) supplemented with 10% foetal bovine serum (FBS) (Hyclone, Utah, USA) and 1% penicillin/streptomycin (Hyclone, Utah, USA) at 37 °C and 5% CO2. Thiazolyl blue tetrazolium bromide (MTT) dye and dimethyl sulphoxide (DMSO) were purchased from Sigma (Steinheim, Germany).
Synthesis of GNPs
GNPs with two different surface chemistries have been synthesized by using wet chemical routes. For preparing CTAB-coated GNPs, briefly 12 ml solution of HAuCl4.3H2O (0.001 M) and 0.5 ml solution of CTAB (0.05 mM) in DI water were mixed under vigorous stirring for 15 min. Then, 0.5 ml solution of fresh and ice-cold sodium borohydride (0.1 M) was injected to the above solution and stirred vigorously for another 15 min. Synthesis of 10 nm citrate-coated GNPs has been carried out based on our previous reports [Citation31–33].
Synthesis of GNRs
Gold nanorods have been synthesized based on a report by Nikoobakht and El-Sayed with some modifications [Citation34]. For preparation of seed solution, 50 µl of 0.05 M solution of HAuCL4.3H2O has been added to 10 ml of CTAB (0.1 M). 60 µL of ice-cold and fresh NaBH4 (0.1 M) was injected to this solution under vigorous stirring. The reaction was completed after 2 h and the final solution was kept at 28 °C. This seed solution was used for synthesis of gold nanorods. Growth solution was prepared by adding 30 ml of CTAB (0.1 M), 0.4 ml of HAuCl4.3H2O (0.05 M), 0.4 ml of AgNO3 (0.01 M) and 0.35 ml of 0.1 M solution of ascorbic acid in order. After 15 min, 0.1 ml of seed solution was added and the solution was kept at 28 °C overnight.
Sample preparation
To understand the role of ions and surface chemistry in RF-EF heating behaviour of gold nanostructures, supernatant was removed step by step through centrifugation at first and subsequently through the protocol reported by Corr et al. [Citation35]. Washed samples, samples with specific amount of CTAB and supernatant of centrifuged pristine nanostructures were prepared for RF-EF heating experiments. Nanostructures with specific amount of CTAB were prepared through discarding specific part of supernatant after centrifugation of nanostructures at 14,000 rpm (15 min for GNRs) and 40,000 rpm (30 min for GNPs) and replacing it with DI water based on previous report [Citation36]. For preparing washed samples, synthesized GNPs and GNRs have been concentrated and washed through sequences of centrifugation with 50 kDa and 100 kDa centrifugation filter tube at 3000 rpm for 4 min and redispersion in DI water [Citation35].
PEG coating on gold nanostructures
For preparation of PEG-coated gold nanostructures, after the second step of centrifugation, pellets were redispersed in 1 ml of 0.5 mM solution of mPEG-SH6000 and were incubated at 30 °C for 24 h with gentle shaking. In order to remove unbound mPEG-SH, another centrifugation step was performed and pellets were dispersed in DI water and dialyzed for 24 h with 14 kDa dialysis bag.
Characterization
Size and morphology of all synthesized samples were studied by using transmission electron microscopy (TEM) on a Zeiss EM 900 microscope operated at 80 kV and a Leo 912 AB operated at 80 kV. Size distribution graphs were generated by measuring the size of 100 particles out of at least five images from different parts of the grid. UV-Vis absorption spectroscopy was applied for estimation of average particle size of GNPs [Citation37] and aspect ratio of GNRs [Citation38] (SPEKOL 2000, Analytik Jena, Jena, Germany). Average particle size (hydrodynamic) and size distribution were measured based on dynamic light scattering data collected on Qudix Scatteroscope I. The zeta potential was measured by using Malvern Nanosizer (Malvern Instruments, Malvern, UK).
The presence of functional groups on the surface of the particles was studied by Fourier-transform infrared spectroscopy (FTIR). The spectra were recorded on Nicolet iS10 FT-IR (Thermo Scientific, Massachussetts, USA) Spectroscope. To further investigate the interaction of functional groups with particles and taking advantage of near-field enhancement of metallic particles, Raman scattering spectra of PEG-coated samples were also recorded by AvaSpec-ULS2048x64TEC, Avantes Spectroscope (Apeldoorn, Netherlands).
In order to find out the exact concentration of gold atoms in GNPs and GNRs after washing and centrifugation steps, inductively coupled plasma-atomic emission spectroscopy (ICP-AES) was applied (Vista-Pro, Varian, Palo Alto, USA). Epoch microplate spectrophotometer (BioTek, Winooski, VT) was used to read MTT absorbance.
Cell studies
To study the cytotoxicity of different nanostructures under different conditions, 5000–10,000 cells were seeded into each well of a 96-well plate, and after 24 h, cells were treated with fresh, FBS-free culture medium containing specific concentration of gold nanostructures and were then incubated for another 24 h. Before MTT assay, cells were washed with PBS.
For RF-EF hyperthermia studies, in 64 inner wells of a 96-well flat bottom plate, cells have been incubated with nanostructures for 24 h and finally have been washed with PBS and filled with fresh culture medium. After 24 h, the plate was exposed to RF-EF for different periods of time and after that cell medium was replaced and plate was incubated for another 24 h. Before MTT assay, cells were washed with PBS.
MTT assay
Cells with different treatments have been washed with PBS for removing free nanoparticles. Cells were then incubated with 100 μl, 0.5 mg/ml solution of MTT in PBS for 2–4 h which was then replaced with 100 μl DMSO. Absorbance of each well was read at the wavelength of 570 nm.
RF-EF heating and thermometry
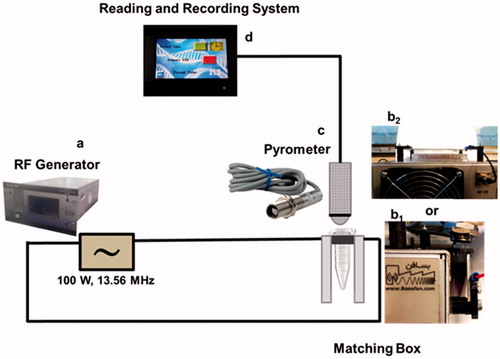
RF-EF heating experiments were carried out with a RF generator (Basafan Company, Tehran, Iran) operating at the fixed frequency of 13.56 MHz (allowed for research purpose) connected to a matching box which tunes the output power to 100 W (fixed). The output of the matching box is connected to an aluminium plate parallel to the body wall of the box (earthed) between which the samples are placed. The plate was of the size of 3.5 × 5 cm2 for microtube heating and 15 × 15 cm2 for well plate heating experiments.
The sample temperature and the heating rate under RF-EF exposure were recorded by a non-contact pyrometer system (THERMO-HUNTER SA-80 T-4 A, OPTEX, Shiga, Japan) connected to a reading and recording system. A schematic representation of experimental set-up including images of each part is presented in . The electronic set-up of the RF generator and impedance matching box is schematically shown in Supplemental file.
Figure 1. Schematic diagram of the RF-EF source, matching box and thermometry system: RF-EF generator (a), RF-EF matching box (b) and non-contact pyrometer (c) connected to reading and recording system (d). For temperature recording experiments, microtubes containing 1 ml of each sample were used (b1), and for RF-EF hyperthermia of cells, 96-well plates were used (b2).
Different solutions of colloidal gold nanostructures at a concentration of 100 ppm were used for RF-EF heating experiments. RF-EF heating experiments of colloidal solutions started at room temperature and the heating response was presented as the amount of temperature rise, ΔT (°C) [Citation27].
Gold nanostructures induced hyperthermia with RF-EF
RF-EF hyperthermia of cells was performed using the setup of . The procedures were based on the protocol reported by Corr et al. for assessing RF-EF hyperthermia effect on cancerous cells as in-vitro experiment [Citation35]. Cells were seeded into each well of 64 inner wells of a 96-well flat bottom plate and were incubated with nanostructures for 24 h at standard condition (5% CO2– 37.5 °C). After 24 h, for removing free gold nanostructure, cells were washed with PBS and wells were filled with fresh culture medium. The plate was then exposed to RF-EF ()). Experiments were initiated at plate temperature of 31 °C. Finally, the plates were incubated for another 24 h before MTT assay.
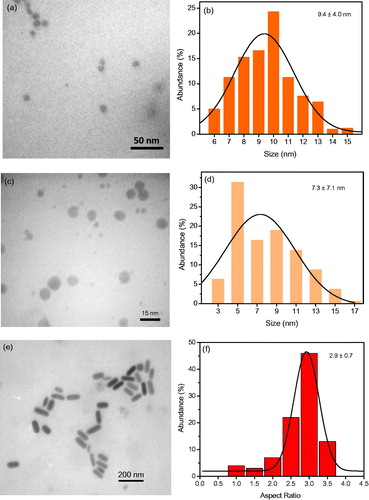
Figure 2. TEM and size distribution histogram of citrate-coated GNPs (a,b), CTAB-coated GNPs (c,d), and TEM and aspect ratio distribution histogram of GNRs (e,f).
Statistical analysis
One-way analysis of variance (ANOVA) has been used for statistical analysis of data unless it has been mentioned. A “p” value of < .05 was considered to be statistically significant for all tests. Data were presented in the form of mean ± standard deviation.
Results and discussion
GNRs were synthesized via seed-mediated growth method and GNPs were synthesized by chemical reduction of Au ions at room temperature. The size and morphology of nanostructures were studied by means of TEM. Based on micrographs presented in , sizes of GNPs coated with citrate and CTAB molecules were determined as a 9.4 nm ± 4.0 nm and 7.3 nm ± 7.1 nm, respectively. Aspect ratio of GNRs was 2.9 ± 0.6.
The size and stability of nanostructures were studied by UV-Vis absorption spectroscopy. represents the UV-Vis absorption spectra of GNPs. As it could be observed, absorption spectra of GNPs coated with citrate (λmax= 516 nm) and CTAB molecules (λmax= 515 nm) are very close, indicating that the sizes of the samples are close, too. The average particle sizes of citrate- and CTAB-coated particles estimated based on UV-Vis absorption spectra were ∼6.2 nm and 7.0 nm, respectively, which is in good agreement with the sizes measured by using TEM.
Figure 3. UV-Vis absorption spectra of citrate- and CTAB-coated GNPs (a). UV-Vis absorption spectra of GNRs in different centrifugation and washing step (b). UV-Vis absorption spectra of PEG- and CTAB-coated GNPs (c). UV-Vis absorption spectra of PEG- and CTAB-coated GNRs (d).
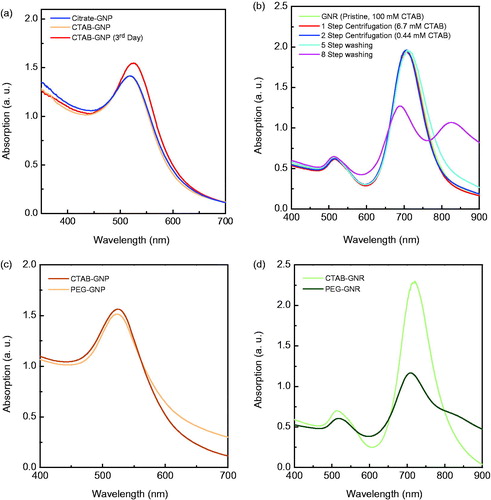
CTAB-coated GNPs kept growing in size gradually. Therefore, samples were washed through five steps of centrifugation with filter tube. This leads to remove the unreacted gold ions and prevent further growth of particles.
Ions and hence CTAB contribute to Joule heating under RF-EF and CTAB is also considerably cytotoxic. Thus, it becomes important to quantify the amount of CTAB, by repeated centrifugation and redispersion for heating experiments under RF-EF. For cytotoxicity experiments, CTAB was removed from all GNPs and GNRs through five steps of washing with filter tubes (). These washed samples were then used for PEG coating.
presents the absorption spectra of GNRs after different steps of washing or centrifugation. As depicted in the graph, when the samples were washed beyond five times, the absorption spectrum of the sample changed drastically as an indication of particle growth or aggregation. Therefore, five steps of washing were chosen for PEG coating on nanostructures.
After PEG coating, the absorption spectrum of nanoparticles did not change noticeably but the absorption spectrum of GNRs changed considerably (). The slight blue shift in the absorption peak can be attributed to change in the refractive index of the medium near the surface of particle. The absorbance of PEG-coated GNPs and GNRs increased at higher wavelengths, which means more scattering because of larger size of particles when coated with PEG molecules (the absorption spectra presented here are all extinction spectra).
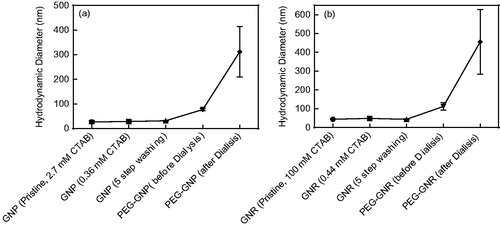
PEG-coated GNPs and GNRs were characterized by means of DLS, FTIR and Raman spectroscopy. DLS was applied to study the average hydrodynamic size of the particles. Centrifugation and washing steps did not change the hydrodynamic size of particles but the average hydrodynamic size of GNPs and GNRs increased as a result of PEG coating (). It was revealed that after 24-h dialysis of PEG-coated gold nanostructures, average hydrodynamic size increased significantly. This could probably be because of removing unbound mPEG-SH and CTAB molecules from the particle surface that lead to stretching of long-chain, covalently bound PEG molecules.
Figure 4. Average hydrodynamic diameters of GNPs (a) and GNRs (b) at different steps. Error bar represents the SD of prepared sampled (n = 3).
Zeta potential of gold nanostructures in every step of centrifugation and washing was measured (). Both CTAB-coated (pristine) structures had high and positive zeta potential even after two steps of centrifugation and dispersing in DI water. This is clearly because of the presence of intact CTAB double layer on nanostructures’ surface. But after five steps of washing with centrifugation filter tube, zeta potential decreased significantly. Zeta potential of PEG-coated gold nanostructures was negative while, before dialysis, PEG-coated gold nanostructures exhibited small positive or nearly neutral zeta potential. Because of the importance of PEG coating in in-vivo and in-vitro studies, FTIR and Raman spectroscopy were carried out to further confirm the presence of covalently bound PEG on the surface of nanostructures. To further confirm the presence of PEG molecules on the surface of nanostructures, FTIR spectra of CTAB- and PEG-coated nanostructures were recorded (). The strong band observed at 1100 nm−1 in the spectra of PEG-coated nanostructures is attributed to stretching of C–O bond which is a clear sign of the presence of PEG molecules on the surface of PEG-coated nanostructures. To finally confirm PEG coating, gold nanostructures made it possible to take advantage of Raman spectroscopy for surface-enhanced Raman scattering. Raman spectra of CTAB-GNRs exhibited a strong band around 170 cm−1 which can be attributed to stretching of Au–Br bond which shifts to 175 cm−1 in PEG-GNRs for stretching of Au–S bond (). However, Raman spectrum of PEG-GNRs exhibits another band at 255 cm−1 which can be assigned to bending of Au–S–C bond. Nikoobakht et al. reported an absorption band around 174 cm−1 attributed to Au–Br vibration from bromide ion which is the bridge between the gold nanostructure surface and the positively charged quaternary nitrogen of the CTA+ cation [Citation39]. But based on another report on structural information of the Au–S interface of thiolate-protected gold clusters, strong band at 175 cm−1 was assigned to Au–S–C bending [Citation40]. Additionally, four bands at around 320, 300, 270 and 240 cm−1 were attributed to Au–S vibrations by Dolamic et al. [Citation41]. Therefore, the data are direct indication of PEG coating through Au–S bond.
Figure 5. FT-IR spectra of PEG- and CTAB-coated GNPs (a) and GNRs (b). Raman spectra of PEG- and CTAB-coated GNRs (c).
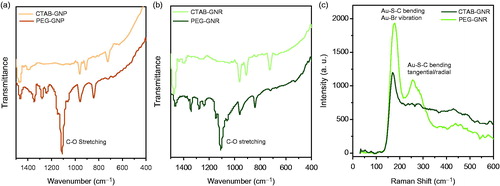
Table 1. Zeta potential of GNPs (a) and GNRs (b) in different steps (the bar represents the Z deviation).
Many factors related to particles and the RF system (power, frequency, etc.) affect the heating behaviour of colloidal gold nanostructures under RF-EF. Particle size, shape, surface chemistry and the amount of ions coexisting in colloidal solution of nanoparticles are among the factors related to particles. So far, all the gold nanostructures applied in RF-EF heating studies were spherical [Citation23] and there has been no report on use of gold nanorods for RF-EF heating experiments or even effect of different surface chemistry has not been investigated critically. Besides these factors, the amount of ions in the colloidal solution of nanoparticles could be an important factor for phenomenal studies.
Heating studies under RF-EF exposure were performed at the power of 100 W which is relatively low but still heats up nanostructures and ionic solutions significantly [Citation21]. As reports claim that tube-shaped sample holder is more appropriate for heating of gold particles under RF-EF exposure [Citation18], in all experiments, 1.5-ml microtubes as sample holder containing 1 ml of sample were used.
represents the heating response of pristine GNRs under RF-EF, for five times repeat. The trend of heating response was similar in every time that experiment was repeated. Therefore, for rest of the experiments, average over 5–10 times repetition was reported.
Figure 6. Thermal response of different GNR and GNP samples exposed to 100 W RF-EF. Repeated results for thermal response of pristine GNRs at 100 ppm (a). Thermal response of pristine GNRs, surfactant of pristine GNRs and 100 mM CTAB solution (b). Thermal response of GNRs with different CTAB concentrations (c). Thermal response of pristine GNPs, surfactant of pristine GNPs and 2.7 mM CTAB solution (d). Thermal response of GNPs with different CTAB concentration (e). Average thermal response of citrate- and CTAB-coated GNPs at 100 ppm (f). The starting temperature in all experiments was 25 °C.
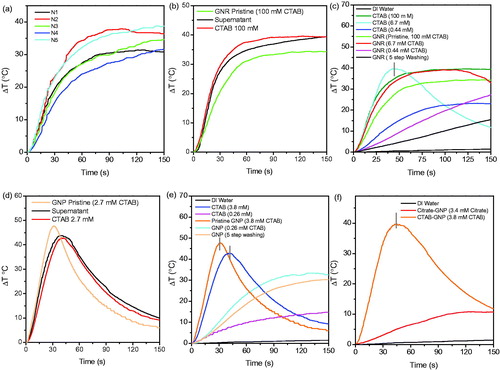
Because of complex heating behaviours observed for GNPs and GNRs, heating of supernatant of centrifuged samples was investigated under RF-EF exposure. The supernatant mainly consists of CTAB and the amount of other components is negligible, although in every supernatant some nanoparticles could be found. Therefore, samples with quantified amount of CTAB were also prepared and tested for RF-EF heating as control (ionic background) for heating behaviour of different gold nanostructures. CTAB content of samples was controlled/quantified by the methods explained in experimental section. Initial concentration of CTAB in GNRs was 0.1 M which was then reduced to 6.7 mM and 0.44 mM through two steps of centrifugation and discarding excess amount of supernatant (equivalent to 15 times dilution in each step). Final concentration of gold was confirmed by ICP-AES and if necessary, it was adjusted by addition of some amount of purified GNRs [Citation9].
As depicted in , heating behaviour of CTAB (100 mM) and supernatant of pristine GNRs is almost similar, but CTAB (100 mM) and supernatant are better heat generators in comparison with pristine GNRs (which contain 100 mM CTAB). Similar results were observed for GNPs, their supernatant and CTAB solution (2.7 mM). However, unlike pristine GNRs, pristine GNPs were better heat generators in comparison with CTAB and supernatant (). Li et al. claimed that the heating was from supernatant [Citation16] but they did not investigate the combination effect of nanoparticles and ions as reported by Sassaroli et al. [Citation19] or McCoy et al. [Citation21]. They suggest that ionic medium enhances the heat attributed to nanoparticles.
RF-EF heating response of GNRs with different concentrations of CTAB and solutions of CTAB with similar concentrations was investigated, too (). It was observed that by varying the CTAB content of GNRs, the heating response changed in a manner similar to response of CTAB alone. High concentrations of CTAB in GNR solution (0.1 mM) exhibited lower heating rate than respective CTAB solution, but by decreasing CTAB concentration to 6.7 mM heating rate increased significantly for both GNRs and CTAB solution. Further decreasing of CTAB concentration (0.44 mM) leads to decreasing the Joule heating of ionic solution at different concentrations as it reported before [Citation42]. These results indicate the complexity of heating mechanisms of solution. To differentiate between CTAB and nanostructures’ heating rate, one should consider the optimum concentration of ion for RF-EF heating investigations. Very high or very low concentrations of ionic solution have been found not heating significantly under RF-EF, as it has been reported for heating of ionic solutions [Citation42]. Heating response of normal saline under RF-EF has been investigated, too [Citation21]. It has been mentioned in the report that conductive solutions may be necessary for effective field penetration and interaction with nanoparticles.
The heating results of CTAB-coated GNPs and CTAB solutions of the similar concentration were similar to that of CTAB-coated GNRS, except that in this case CTAB-coated GNPs exhibited higher heating rate than CTAB molecules alone which could be because of effect of particle size in comparison with GNRs ().
To further understand the effect of ions in the solution, CTAB-coated GNPs were compared with citrate-coated GNPs (). The performance of CTAB-coated GNPs was far greater than citrate-coated GNPs. Previous reports show a similar heating rate for citrate-capped particles [Citation29]. As could be observed in TEM micrographs of citrate- and CTAB-coated GNPs, the size distribution of CTAB-coated GNPs is wider, meaning that the sample contains many smaller particles which contribute to larger heating in CTAB-coated GNPs [Citation9,Citation27]. In terms of electrophoretic movement of charged nanoparticles that have been mentioned for sub-10 nm particles under RF-EF exposure based on previous reports [Citation9,Citation19], it must be noticed that CTAB molecules stick to nanoparticles’ surface much stronger than loosely bound citrate molecule as a result of which nanoparticles could move faster in alternative electric field.
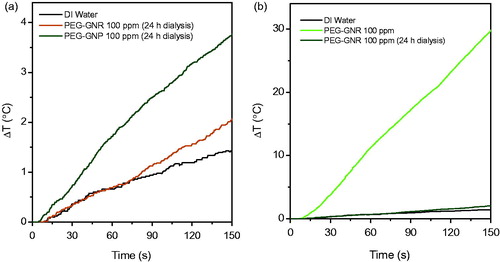
In order to apply gold nanostructures in clinical RF-EF cancer hyperthermia, they must be injected intravenously. Therefore, RF-EF heating with PEG-coated gold nanostructures was investigated, too (). It must be noted that the net charge on the surface of PEG-coated gold nanostructures did not change significantly after dialysis (based on zeta potential data presented in ) but amount of heat, generated under RF-EF, decreased dramatically after performing dialysis process (). Two justifications could be valid for this observation. One is the removing of unbound mPEG-SH and CTAB molecules from nanostructures’ solution and second is increasing the hydrodynamic size of the nanostructures as a result of PEG coating.
Figure 7. Thermal response of pegylated gold nanostructures. Average thermal response of PEG-coated GNRs and GNPs at 125 ppm (a). Average thermal response of PEG-coated GNRs before and after dialysis (b). The starting temperature in all experiments was 25 °C.
Cytotoxicity is a major concern for clinical application of nanoparticles [Citation43]. For GNPs with different surface chemistry, there is a general belief that negatively charged particles are more compatible than positively charged particles in biological environments and show less cytotoxicity when studied in vitro. Probably, this is the result of higher binding affinity between positively charged nanoparticles and negatively charged surface of cells that interferes with cell functions and increases the uptake of nanoparticles [Citation44,Citation45]. In case of GNRs, cytotoxicity effect is much more severe simply because of CTAB molecules present on the surface of GNRs [Citation28,Citation46]. MTT assay is considered as a “gold standard” for in-vitro nano-cytotoxicology studies [Citation47], which represents mitochondrial enzymatic function of cells [Citation44]. MTT assay has been used in several reports for cytotoxicity assessment of gold nanostructures and no interference has been reported [Citation31,Citation47–49]. Washed GNPs and GNRs were found highly toxic mainly because of the presence of residue amount of CTAB molecules on the surface of the particles as approved by zeta potential values (). As explained before, surface of the GNPs and GNRs was coated with PEG molecules and then unbound mPEG-SH and residue of CTAB were removed through centrifugation and dialysis.
Figure 8. MTT results for MIA Paca-2 cells treated with washed GNPs and GNRs (a,b) and PEG-coated GNPs and GNRs (c,d). MTT results for MIA Paca-2 cells treated with PEG-coated GNPs + RF and PEG-coated GNRs + RF (e,f).
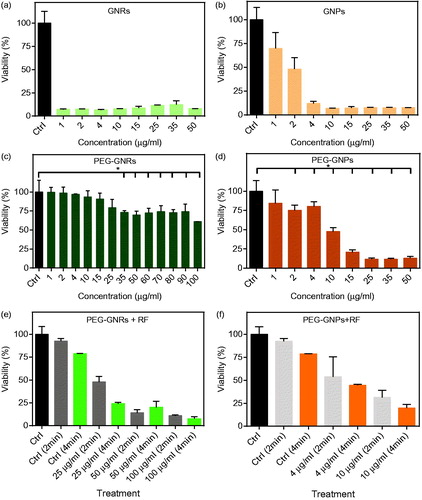
PEG-GNRs showed no or very low cytotoxicity at examined concentrations (1–100 µg/ml), which was expected as per earlier reports () [Citation26,Citation30,Citation48]. However, PEG-GNPs became toxic at concentrations above 10 ppm (∼50% cell death) (). These results could be attributed to less number of PEG molecules on the surface of GNPs in comparison with GNRs and also larger number of GNPs at the same concentration as compared to GNRs. Larger hydrodynamic size of PEG-GNRs in comparison with PEG-GNPs could be another important factor. In addition, many small GNPs were observed in TEM micrographs of CTAB-coated GNPs as a result of wide size distribution which may contribute to higher cytotoxicity of PEG-GNPs. It has been reported that uptake of larger nanoparticles is much less than smaller nanoparticles [Citation50].
Effect of RF-EF hyperthermia on cells was investigated at different concentrations of PEG-GNRs and PEG-GNPs (). Application of RF-EF alone on cells did not decrease the viability. However, addition of PEG-GNRs and PEG-GNPs both decreased the viability below 50% and proved to be very effective to cause cell death.
Results of variation of RF-EF exposure time on cells showed no significant difference with control group. Duration of RF-EF exposure has been reported as an important factor in results of cell studies. Curley et al. reported that RF-EF exposure could cause mitochondrial damage and induce autophagy in in-vitro studies [Citation51]. Treatment with PEG-GNRs caused significant cell death when exposed to RF-EF. In case of PEG-GNPs, cell death was significant with respect to control group but was not significantly different from cell death by PEG-GNPs with no RF-EF applied. It is therefore concluded that PEG-GNRs when exposed to RF-EF could cause considerable cell death, whereas they were found non-toxic when no RF-EF was applied.
Conclusions
GNRs and GNPs with different surface chemistries were synthesized and characterized. PEG coating of gold nanostructures was performed and proved with different methods, such as DLS, zeta potential analysis, Raman, FTIR and UV-Vis spectroscopy. Heating of gold nanostructures under RF-EF exposure was investigated with different ion concentrations. PEG-GNPs and PEG-GNRs were used for in-vitro hyperthermia analysis of human pancreatic carcinoma cell line. Our results indicate that PEG-coated nanostructures were not a good heating agent under RF-EF in comparison with CTAB- or citrate-coated gold nanostructures. However, they caused tremendous cell death under RF-EF exposure. PEG-GNRs can be suggested as a good candidate for intravenous injection and in-vivo RF-EF hyperthermia.
Disclosure statement
No potential conflict of interest was reported by the authors.
| Abbreviations | ||
| ANOVA | = | analysis of variance |
| CTAB | = | cetyltrimethylammonium bromide |
| CNTs | = | carbon nanotubes |
| DI water | = | deionized water |
| DMSO | = | dimethyl sulphoxide |
| DLS | = | dynamic light scattering |
| FBS | = | foetal bovine serum |
| FTIR | = | Fourier-transform infrared spectroscopy |
| GNPs | = | gold nanoparticles |
| GNRs | = | gold nanorods |
| ICP-AES | = | inductively coupled plasma-atomic emission spectroscopy |
| M | = | mole/L |
| MTT | = | thiazolyl blue tetrazolium bromide |
| NIR | = | near infrared |
| PBS | = | phosphate buffered saline |
| PEG | = | polyethylene glycol |
| RES | = | reticuloendothelial system |
| RF-EF | = | radiofrequency electric field |
| rpm | = | round/rotation per minute |
| SPR | = | surface plasmon resonance |
| TEM | = | transmission electron microscopy |
| UV-Vis | = | ultraviolet–visible |
Seyed_Mohammad_Amini_et_al_Supplemental_content.docx
Download MS Word (32 KB)Additional information
Funding
References
- Statistics from the American Cancer Society. [Internet]. 2012. Available from: https://www.cancer.org/research/cancer-facts-statistics/global.html.
- Custodio A, Puente J, Sastre J, et al. Second-line therapy for advanced pancreatic cancer: a review of the literature and future directions. Cancer Treat Rev. 2009;35:676–684.
- Murali VS, Wang R, Mikoryak CA, et al. The impact of subcellular location on the near infrared-mediated thermal ablation of cells by targeted carbon nanotubes. Nanotechnology. 2016;27:425102.
- Ferrari M. Cancer nanotechnology: opportunities and challenges. Nat Rev Cancer. 2005;5:161–171.
- Huang X, Jain PK, El-Sayed IH, et al. Gold nanoparticles: interesting optical properties and recent applications in cancer diagnostics and therapy. Nanomedicine. 2007;2:681.
- Emami T, Madani R, Golchinfar F, et al. Comparison of gold nanoparticle conjugated secondary antibody with non-gold secondary antibody in an ELISA Kit model. Monoclon Antib Immunodiagn Immunother. 2015;34:366–370.
- Daraee H, Pourhassanmoghadam M, Akbarzadeh A, et al. Gold nanoparticle–oligonucleotide conjugate to detect the sequence of lung cancer biomarker. Artif Cells Nanomed Biotechnol. 2016;44:1417–1423.
- Huang X, El-Sayed MA. Gold nanoparticles: optical properties and implementations in cancer diagnosis and photothermal therapy. J Adv Res. 2010;1:13–28.
- Corr SJ, Raoof M, Mackeyev Y, et al. Citrate-capped gold nanoparticle electrophoretic heat production in response to a time-varying radiofrequency electric-field. J Phys Chem C. 2012;116:24380–24389.
- Kanzius J. System and method for RF-induced hyperthermia. 2004, Google Patents.
- Haemmerich D, Laeseke P. Thermal tumour ablation: devices, clinical applications and future directions. Int J Hyperthermia. 2005;21:755–760.
- Kanzius J, Steinbrink W, McDonald R, et al. Systems and methods for combined RF-induced hyperthermia and radioimmunotherapy. 2009, Google Patents.
- Glazer ES, Curley SA. Non-invasive radiofrequency ablation of malignancies mediated by quantum dots, gold nanoparticles and carbon nanotubes. Ther Deliv. 2011;2:1325–1330.
- Moran CH, Wainerdi SM, Cherukuri TK, et al. Size-dependent joule heating of gold nanoparticles using capacitively coupled radiofrequency fields. Nano Res. 2009;2:400–405.
- Hanson GW, Monreal R, Apell SP. Electromagnetic absorption mechanisms in metal nanospheres: bulk and surface effects in radiofrequency-terahertz heating of nanoparticles. J Appl Phys. 2011;109:124306.
- Li D, Jung YS, Tan S, et al. Negligible absorption of radiofrequency radiation by colloidal gold nanoparticles. J Colloid Interface Sci. 2011;358:47–53.
- Li D, Jung YS, Kim HK, et al. The effect of sample holder geometry on electromagnetic heating of nanoparticle and NaCl solutions at 13. 56 MHz. IEEE Trans Biomed Eng. 2012;59:3468–3474.
- Kim HK, Hanson GW, Geller DA. Chemistry. Are gold clusters in RF fields hot or not? Science. 2013;340:441–442.
- Sassaroli E, Li K, O'Neill B. Radio frequency absorption in gold nanoparticle suspensions: a phenomenological study. J Phys D Appl Phys. 2012;45:075303.
- Crespo P, Litrán R, Rojas TC, et al. Permanent magnetism, magnetic anisotropy, and hysteresis of thiol-capped gold nanoparticles. Phys Rev Lett. 2004;93:087204.
- McCoy RS, Choi S, Collins G, et al. Superatom paramagnetism enables gold nanocluster heating in applied radiofrequency fields. ACS Nano. 2013;7:2610–2616.
- Postnikov A, Moldosanov K. Phonon-assisted radiofrequency absorption by gold nanoparticles resulting in hyperthermia. arXiv Preprint arXiv1508.00735; 2015.
- Collins CB, McCoy RS, Ackerson BJ, et al. Radiofrequency heating pathways for gold nanoparticles. Nanoscale. 2014;6:8459–8472.
- Corr SJ, Raoof M, Cisneros BT, et al. Radiofrequency electric-field heating behaviors of highly enriched semiconducting and metallic single-walled carbon nanotubes. Nano Res. 2015;8:2859–2870.
- LIN K, Bagley A, Zhang A, et al. Gold nanorod photothermal therapy in a genetically engineered mouse model of soft tissue sarcoma. Nano Life. 2010;01:277–287.
- Lankveld DPK, Rayavarapu RG, Krystek P, et al. Blood clearance and tissue distribution of PEGylated and non-PEGylated gold nanorods after intravenous administration in rats. Nanomedicine. 2011;6:339–349.
- Amini SM, Kharrazi S, Jaafari MR. Radio frequency hyperthermia of cancerous cells with gold nanoclusters: an in vitro investigation. Gold Bull. 2017;50:43–50.
- Schachter D. The source of toxicity in CTAB and CTAB-stabilized gold nanorods. Rutgers University-Graduate School-New Brunswick; 2013.
- Bogdanov AA, Jr, Gupta S, Koshkina N, et al. Gold nanoparticles stabilized with MPEG-grafted poly (L-lysine): in vitro and in vivo evaluation of a potential theranostic agent. Bioconjugate Chem. 2014;26:39–50.
- Rayavarapu RG, Petersen W, Hartsuiker L, et al. In vitro toxicity studies of polymer-coated gold nanorods. Nanotechnology. 2010;21:145101.
- Amini SM, Kharrazi S, Hadizadeh M, et al. Effect of gold nanoparticles on photodynamic efficiency of 5-aminolevolenic acid photosensitiser in epidermal carcinoma cell line: an in vitro study. Nanobiotechnology. 2013;7:151–156.
- Darabpour E, Kashef N, Amini SM, et al. Fast and effective photodynamic inactivation of 4-day-old biofilm of methicillin-resistant Staphylococcus aureus using methylene blue-conjugated gold nanoparticles. J Drug Deliv Sci Technol. 2017;37:134–140.
- Tavakol S, Hoveizi E, Kharrazi S, et al. Organelles and chromatin fragmentation of human umbilical vein endothelial cell influence by the effects of zeta potential and size of silver nanoparticles in different manners. Artif Cells Nanomed Biotechnol. 2017;45:817–823.
- Nikoobakht B, El-Sayed MA. Preparation and growth mechanism of gold nanorods (NRs) using seed-mediated growth method. Chem Mater. 2003;15:1957–1962.
- Corr SJ, Cisneros BT, Green L, et al. Protocols for assessing radiofrequency interactions with gold nanoparticles and biological systems for non-invasive hyperthermia cancer therapy. JoVE. 2013; e50480–e50480.
- Wu W-C, Tracy JB. Large-scale silica overcoating of gold nanorods with tunable shell thicknesses. Chem Mater. 2015;27:2888–2894.
- Haiss W, Thanh NTK, Aveyard J, et al. Determination of size and concentration of gold nanoparticles from UV-vis spectra. Anal Chem. 2007;79:4215–4221.
- Link S, Mohamed M, El-Sayed M. Simulation of the optical absorption spectra of gold nanorods as a function of their aspect ratio and the effect of the medium dielectric constant. J Phys Chem B. 1999;103:3073–3077.
- Nikoobakht B, Wang J, El-Sayed MA. Surface-enhanced Raman scattering of molecules adsorbed on gold nanorods: off-surface plasmon resonance condition. Chem Phys Lett. 2002;366:17–23.
- Varnholt B, Oulevey P, Luber S, et al. Structural information on the Au–S interface of thiolate-protected gold clusters: a Raman spectroscopy study. J Phys Chem C. 2014;118:9604–9611.
- Dolamic I, Varnholt B, Burgi T. Far-infrared spectra of well-defined thiolate-protected gold clusters. Phys Chem Chem Phys. 2013;15:19561–19565.
- Liu X, Chen H-J, Alfadhl Y, et al. Conductivity and frequency dependent specific absorption rate. Journal of Applied Physics. 2013;113:074902.
- Kaur G, Narang RK, Rath G, et al. Advances in pulmonary delivery of nanoparticles. Artif Cells Nanomed Biotechnol. 2012;40:75–96.
- Sharifi S, Behzadi S, Laurent S, et al. Toxicity of nanomaterials. Chem Soc Rev. 2012;41:2323–2343.
- Murphy CJ, Gole AM, Stone JW, et al. Gold nanoparticles in biology: beyond toxicity to cellular imaging. Acc Chem Res. 2008;41:1721–1730.
- Chompoosor A, Saha K, Ghosh PS, et al. The role of surface functionality on acute cytotoxicity, ROS generation and DNA damage by cationic gold nanoparticles. Small. 2010;6:2246–2249.
- Marquis BJ, Love SA, Braun KL, et al. Analytical methods to assess nanoparticle toxicity. Analyst. 2009;134:425–439.
- Niidome T, Yamagata M, Okamoto Y, et al. PEG-modified gold nanorods with a stealth character for in vivo applications. J Control Release. 2006;114:343–347.
- Goodman CM, McCusker CD, Yilmaz T, et al. Toxicity of gold nanoparticles functionalized with cationic and anionic side chains. Bioconjugate Chem. 2004;15:897–900.
- Oh E, Delehanty JB, Sapsford KE, et al. Cellular uptake and fate of PEGylated gold nanoparticles is dependent on both cell-penetration peptides and particle size. Acs Nano. 2011;5:6434–6448.
- Curley SA, Palalon F, Lu X, et al. Noninvasive radiofrequency treatment effect on mitochondria in pancreatic cancer cells. Cancer. 2014;120:3418–3425.