
 ?Mathematical formulae have been encoded as MathML and are displayed in this HTML version using MathJax in order to improve their display. Uncheck the box to turn MathJax off. This feature requires Javascript. Click on a formula to zoom.
Abstract
This paper reports an electrochemical paper analytical device (EPAD) for detection of recreational drug; methylenedioxymethamphetamine (MDMA). MDMA is used as an addictive narcotic by youth and there is an urgent need to detect this drug as it is a potential neurotoxic agent. The proposed EPAD represents many advantageous features of being simple, low-cost, consistent and disposable. The working electrode of the EPAD features zinc oxide nanorods (ZnONRs). The morphological, optical, elemental composition and phase analysis of the synthesized ZnONRs has been characterized by field emission scanning electron microscopy (FESEM), UV–Vis spectroscopy, energy dispersive X-ray spectroscopy (EDAX), photo-luminescence (PL) and X-ray diffraction (XRD). The developed sensor showed optimum response at 7.0 pH and wide linear range of 1 µM–1 mM with a low detection limit of 0.1 µM for MDMA. Evaluation of the sensor also revealed best results in terms of analytical recovery (95%) and accuracy (95%). The designed EPAD could prove to be very effective in case of forensic diagnostic applications. This work provides a reliable diagnostic method for remote areas with limited resources, and will also help people who cannot afford expensive medical tests and have limited access to power and trained personnel.
Introduction
Amphetamine and related drugs are popularly used as recreational drugs as they are very powerful stimulants of central nervous system. Amongst the many amphemaine derivatives, we have focused on methylenedioxymethamphetamine (MDMA). This is because it is the most abused and is illicit in many countries [Citation1–4]. This drug can act both as psychomotor stimulant amphetamines and the hallucinogen mescaline. This drug is now a frequently misused drug which confers severe health problems as it acts as a neurotoxic agent [Citation4,Citation5]. Individuals including athletes and recreational users are fascinated by this drug and MDMA abuse has the potential of giving rise to a serious public health concern [Citation2]. Conventional methods of testing involves bulky and time consuming techniques like gas chromatography–mass spectrometry (GC–MS), high-performance liquid chromatography (HPLC), liquid chromatography–mass spectrometry (LC–MS), ion mobility spectrometry (IMS), capillary electrophoresis (CE) and immunoassays [Citation6–9]. Due to the drawbacks like complexity, large time consumption there is an urgent need of a suitable technique for efficient and rapid detection of MDMA in biological samples such as saliva, sweat and urine. Our work in this direction will bridge existing gaps in current methods.
Paper microfluidics has fascinated many researchers because of advantageous characteristics such as affordability, rapidity, safe, easy disposal, and the feasibility of liquid transport without applying an external driving force. Aforementioned characteristics make them low-cost platform for point of use in resource-limited settings. Paper-based devices can be fabricated in various shapes, sizes and dimensions to transport the desired fluidics depending on the complexity of application [Citation10–21].
In this study, we developed a rapid paper based detection method for electro-analysis of MDMA. Here, we report the first electrochemical paper analytical device (EPAD) integrated with hydrothermally synthesized ZnO nanorods (ZnONRs) for electrochemical sensing of MDMA in human saliva, sweat and urine. EPAD is fabricated by an array of reaction zones formed on a paper substrate by wax patterning, and electrodes are patterned by stencil printing of conductive inks. EPADs configured with varied ZnONRs growth levels and other kinetic parameters related to the drug are calibrated. Zinc oxide (ZnO) nano structures have shown exceptional characteristic features in biosensing [Citation22,Citation23]. They possess not only high surface-to volume ratios but also highly biocompatible and shows fast electron transfer [Citation24]. The calibrated PAD was employed for the detection of MDMA. The reported EPAD exhibits sensitive, highly specific and fast response toward MDMA in both aqueous solution and spiked biological samples signifying its guarantee as a powerful tool for specific and sensitive MDMA sensing system.
Materials and methods
Apparatus and chemicals
The fabrication and sensing of MDMA was carried out using cyclic voltammetry (CV) on an Autolab-PGSTAT-10, Eco Chemie, Utrecht, Netherlands electrochemical analysis system and Nova software package. The EPAD consists of two electrode system with counter electrode (CE) and working electrode (WE) made from conductive carbon ink. The WE is integrated with ZnONRs as the matrix providing high surface area for the sensing of MDMA. Electrochemical Impedance spectroscopy (EIS) was carried out on Wayne Kerr Impedance Analyzer as a confirmative tool for the electrochemical detection of MDMA on ZnONRs/EPAD. Field Emission scanning electron microscopy (FESEM) (JEOL JSM-6010LA) was used to study the crystallographic structure and morphologies of the ZnO nanorods. UV–Vis spectroscopy was done on Schimadzu UV spectrophotomer. Energy-dispersive X-ray spectroscopy (EDAX) was carried out for compositional analysis using CuKα radiation of 0.154 nm (EDAX detector in SEM). The crystalline structures of ZnO were investigated using X-ray diffractometer (Bruker, D2-Phaser) recorded from 5 to 80 using CuKa (k = 1.5403 A˚) X-ray operated at 10 kV and 30 mA. The Photoluminescence emission/excitation spectra were recorded at room temperature using spectroflourometer (RF 5301 PC, SHIMAZZU) with excitation wavelength of 325 nm. The emission spectra for the sample were scanned from 300 to 700 nm with a step size of 1.0 nm.
Zinc acetate dehydrate, sodium hydroxide (NaOH), zinc nitrate hexahydrate and ammonium hydroxide were obtained from Thermo Fischer scientific. Hexamethylenetetramine was obtained from Sigma-Aldrich Co. GmbH (St. Louis, MO). All other reagents were of AR grade and double distilled water was used throughout the experiment.
Paper analytical device (PAD) fabrication
Paper analytical device was fabricated by using conducting carbon ink on a paper with the help of silk screen. The silk screen having pre-fixed printed electrodes was used as a stencil for preparation of the electrodes. The EPAD had two electrodes-CE and WE. These electrodes were then coated with wax to create hydrophobic barriers which defines the working area on the electrode. The coated wax was heated to melt which enables its spread in all directions which subsequently form the hydrophobic barriers. This leads to construction of the EPADs (Scheme 1).
Scheme 1. Screen printing of electrochemical paper analytical devices.
The EPAD was connected to potentiostat with the WE coated with zinc oxide nanorods (ZnONRs). Here in this approach, the use of paper as a sensing interface makes this sensor affordable, reusable, require low sample volume and simple. Furthermore, conductive carbon ink is also offering advantageous characteristics features such as low cost, easy preparation and quick fabrication.
Hydrothermal synthesis of ZnO nanorods (ZnONRs)
ZnONRs were synthesized by method adopted by Li et al. [Citation25] with certain modifications. They were synthesized in two stages. Firstly, zinc acetate dehydrate (0.002 M) and NaOH (0.004 M), both prepared in ethanol, were individually stirred at 70 °C for 2 h. After cooling at 4 °C, the NaOH solution was added drop wise to the zinc acetate dehydrate under constant stirring. The mixture was placed at 60 °C for 2 h. The obtained colloidal solution was ZnO nanoparticles (ZnONPs).
Lastly, hydrothermal growth of ZnONRs was carried out. The ZnONPs seed solution was dropped on a cover slip and dried at 100 °C. A 25 ml growth solution using 0.05 M zinc nitrate hexahydrate, 0.025 M hexamethylenetetramine and 0.372 M ammonium hydroxide was prepared and the cover slips were immersed in the growth solution in Hydrothermal Bpmb. Hydrothermal Bpmb was then kept in oven at 86 °C. Finally, the cover slips were taken and ZnONRs were scraped out. These scraped ZnONRs were then used for further analysis.
Electrochemical characterization of ZnONRs/PAD
The electrochemical performance of ZnONRs/PAD electrode was carried out using cyclic voltammetry (CV) by sweeping the potential from −1.5 to +1.5 V in 0.1 M PBS at room temperature. Varying concentrations of amphetamines was also checked by employing the ZnONRs PAD. Various kinetic and electrochemical parameters were optimized to achieve better amplification signal.
Sensing scheme and signal acquisition
For the electrochemical measurements, different concentrations of MDMA were made by dissolving an appropriate amount of compound in water. A sample mixture to be analysed (drug) is transferred onto circular region or chamber on the ZnONRs/PAD (Scheme 1). When voltage is applied on the assembly of sensor surface, the electro-oxidation of drug induces changes in the sensing signal of ZnONRs/PAD. Redox profile of the drug suggests that there are two well-defined anodic peaks (Scheme 2).
Scheme 2. Representation of fabrication of various stages of EPAD and oxidation of MDMA.
Results and discussions
Characterization of ZnONRs
shows the FESEM micrograph of top view of hydrothermally grown ZnO nanorods. Hexagonal facets indicate that grown ZnO nanorods are crystalline in nature. ) shows the cross-sectional view of ZnO nanorods. The aspect ratio of ZnO is about 10, with an average length of 1 μm and diameter 100 nm. Further for compositional analysis, EDAX of the samples was carried out (). Zn signal at 1.01, 8.69 and 9.53 keV and oxygen peak at 0.53 keV. EDAX analysis confirms the synthesis of ZnO nanorods. A small C signal at 0.28 eV is due to impurity traces. X-ray diffraction profile of ZnO nanorods are shown in . The XRD was compared with the standard JCPDS data base file 36-1451 which shows that synthesized ZnO is Wurtzite in phase.
Figure 1. (a) and (b) Field-emission scanning electron micrograph of zinc oxide nanorods. (c) Energy dispersive X-ray spectrum of zinc oxide nanorods. (d) X-ray diffraction pattern of zinc oxide nanorods. (e) Photo-luminescence spectra of zinc oxide nanorods. (f) UV–Vis spectra of the zinc oxide nanorods.
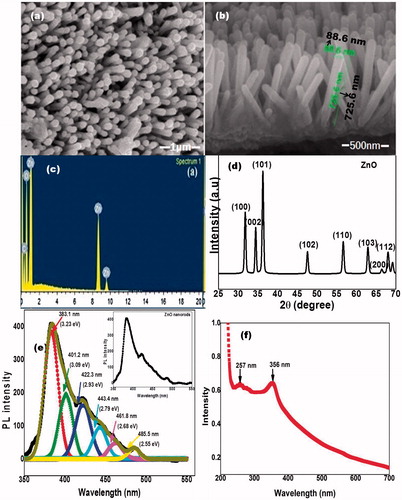
shows a room-temperature photoluminescence (PL) spectrum of pure ZnO nanorods fitted with multiple Gaussian peaks. PL spectrum of ZnO nanorods is highly asymmetric (inset of ) indicating it has many origins. PL characteristics emissions were observed in the UV and visible range at 383.1 nm (3.23 eV), 401.2 nm (3.09 eV), 422.3 nm (2.93 eV), 443.4 nm (2.79 eV), 461.8 nm (2.68 eV) and 485.5 nm (2.55 eV). The peak at 3.23 eV was assigned as ultraviolet emission. The peak at 3.09 eV is attributed to UV violet emission, the emissions observed at 2.93 eV and 2.79 eV were due to Zni and Zni+1 zinc interstitial donor defects, respectively, 2.68 eV emission ascribed to doubly ionized zinc vacancy (Vzni−2) and 2.55 eV emission originated due to the recombination of shallow trapped electron with the acceptor levels above the valence band [Citation23]. These peaks can be assigned as Oi (oxygen interstitial) and V0 (oxygen vacancies).
The UV–Vis spectra of ZnONRs presented two absorption peaks as shown in . The characteristic peak of ZnO at 356 nm was very sharp. Also, a small peak at 257 nm may be because of the lower energy band gap particles.
Characterization of PAD sensing surface
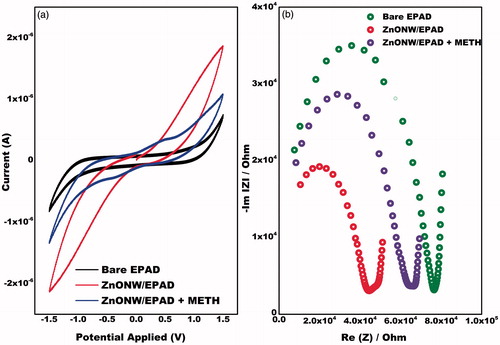
Cyclic voltammetry studies are carried out on the EPAD electrode and the ZnONRs/EPAD in the potential range from 1.5 V to −1.5 V in PBS buffer containing 5 mM containing drug at a scan rate of 100 mV s−1 (). The MDMA shows two well-defined anodic peaks at physiological pH using CV (). The first oxidation peak, Ep = 0.2 V, is probably due to the removal of one electron from the aromatic nucleus [Citation2]. The second wave, Ep = 0.7 V, corresponds to the oxidation of the secondary amine present in the MDMA molecule [Citation2]. It was also observed that the peak current of the ZnONRs/EPAD is higher as compared to that of the EPAD () which indicates a fast electron communication. In the presence of MDMA, ZnONRs/EPAD shows two well-defined oxidation peaks at 0.2 V and 0.7 V. Sensing signals arise due to the presence of the ZnONRs that offer confined 1D channel for the transportation of electrons from the drug to the electrode. This specifies that nanorods promote higher mass diffusion efficiency due to the electrochemical activation of the drug. EIS was also done in order to confirm the results obtained from CV. The nyquist plot in show that the bare EPAD shows the highest resistance charge transfer (Rct) of 80,000 Ω. The Rct value at ZnONRs modified EAPD decreased to 48,000 Ω which confirms that ZnONRs shows a fast electron communication. The MDMA restricts the flow of electrons by increasing the Rct value further to 61,000 Ω. Thus, both the CV and the EIS results corroborate with each other.
Figure 2. (a) Cyclic voltammogram of bare EPAD, ZnONRs/EPAD in the presence and absence of MDMA in the scanning potential range of −1.5 to +1.5 V at the scan rate 100 mV s−1 in 0.1 M phosphate buffer pH 7.0. (b) Nyquist plot at bare EPAD, ZnONRs/EPAD in the presence and absence of MDMA in 0.1 M sodium phosphate buffer (pH 7.0) with a frequency range of 100 Hz –103 kHz.
Effect of various scan rates on the ZnONRs/EPAD
Cyclic voltammograms were also recorded at different sweep rates on ZnONRs/EPAD in the presence of MDMA. Two well-defined anodic peaks were observed for MDMA (). The presence of slight reduction peaks could be attributed to the metabolism of MDMA to highly oxidative catecholamines. These catecholamine compounds have the ability of auto-oxidizing in vivo resulting into o-quinone intermediates via quasi-reversible two-electron transfer process [Citation26–29]. The magnitude of current of the anodic peak (Ipa) increases linearly with potential sweep rate. The values of the slope, intercept and correlation coefficient are given in the equations below.
Figure 3. (a) Cyclic voltammograms of ZnONRs/EPAD electrode at different scan rates from 10 to 300 mV/s in the presence of MDMA. (b) Plot between peak current and square root of the scan rate. (c) Plot between log of the peak current and log of the scan rate.
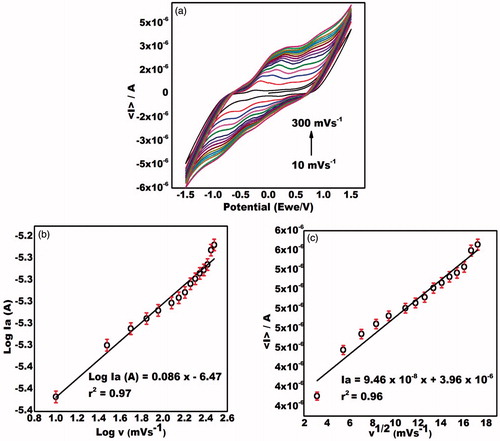
The dependency of the peak current on the square root of the scan rate () can be expressed as
The diffusion controlled behaviour was further confirmed by plotting log Ia vs log v () corresponding to the equation:
Detection of amphetamine drug by using paper based platform
Differential Pulse voltammetric studies of the ZnONRs/EPAD has been conducted with successive addition of amphetamine. It was that the anodic peak current increases when the concentration of MDMA increases from 1 × 10⁻⁶ to 1 × 10⁻³ M (). In the proposed chemical reaction, MDMA causes removal of one electron from the aromatic nucleus as above. This ZnONRs integrated paper based sensor exhibits detection in the range of 1 µM to 1 mM and detection limit of 0.1 µM.
Figure 4. (a) Differential pulse voltammogram of modified electrode using different concentrations of MDMA (1 µM to 1 mM) in the scanning potential range of 0 V to +1.5 V in 0.1 M phosphate buffer pH 7.0. (b) Calibration plot between log of the various concentrations of MDMA and peak current.
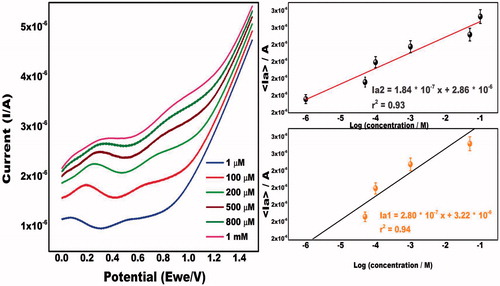
Calibration curve and detection limits
As can be seen in anodic peak heights increases linearly as a function of added MDMA concentration. The linear regression equation can be expressed as: Ia/A = 2.80 × 10⁻⁷ X + 3.23 × 10⁻⁶ with a correlation coefficient of 0.94.
Electrochemical performance of the proposed sensor
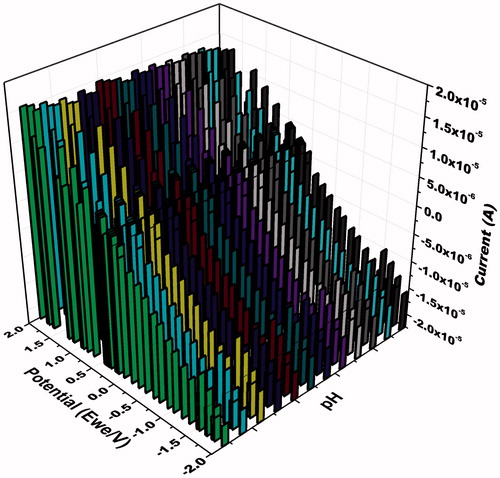
Electrochemical MDMA sensor was also optimized in terms of temperature and pH. CV measurements were recorded for highest current response. A series of different pH were exposed to ZnONRs/PAD. Amplitude of sensing signal was found best at pH 7.0 (). Different temperatures were exposed to the ZnONRs/PAD. Amplitude of sensing signal was found best at room temperature.
Figure 5. 3 D representation of the cyclic voltammograms at ZnONW/EPAD + MDMA at different pH of 0.1 M phosphate buffer ranging from 5.8 to 8.0 in the scanning potential range of −2.0 to +2.0 V at the scan rate 100 mV s−1.
In order to fabricate sensor for the electro-oxidation of MDMA in fluids such as urine and sweats, the sensor was evaluated with accuracy obtained for the MDMA drug. The results depicted from the fabricated sensor are in good correlation and are presented in . The results of analytical recovery testing using the fabricated sensor are also presented in .
Table 1. Determination of accuracy (n = 5) of MDMA in urine samples using ZnONRs/PAD.
Table 2. Determination of recovery (n = 5) of MDMA in sweat samples using ZnONRs/PAD.
To confirm the consistency of ZnONRs/PAD, CV detection on different paper based platforms was done using same parameters and found that the results changed insignificantly (<2%) after repeated experiments. Therefore, the procedure is able to MDMA assay in the presence of excipients; hence, it can be considered selective.
Comparative analysis of various sensors
The various analytical parameters of different sensors for the determination of MDMA were compared in . The present EPAD showed wide linear range and low detection limit in comparison to earlier reported sensors. In addition, our sensor is much more economical due to the use of paper and requires less analytical sample volume as aforementioned.
Table 3. Evaluation of various analytical parameters.
Conclusions
The developed paper based analytical device showed a very good response towards detection of amphetamine. The anodic peaks were due to the electro-oxidation in the MDMA molecule. The use of paper reduced the cost of the sensor and the volume of the analyte. The linear range obtained for the detection of MDMA was 1 µM to 1 mM with a detection limit of 0.1 µM. This is the first report on PAD for sensing MDMA and has a lot more potential in terms of decreasing the linear range and detection limit. The device holds a great potential in forensic laboratories if taken on a commercial scale.
Disclosure statement
No potential conflict of interest was reported by the authors.
Additional information
Funding
Related Research Data
References
- Nichols DE, Hoffman AJ, Oberlender RA, et al. Derivatives of 1-(1,3-benzodioxol-5-yl)-2-butanamine: representatives of a novel therapeutic class. J Med Chem. 1986;29:2009–2015.
- Nichols DE. Differences between the mechanism of action of MDMA, MBDB, and the classic hallucinogens. identification of a new therapeutic class: entactogens. J Psychoactive Drugs. 1986;18:305–313.
- Martinez-Price DL, Krebs-Thomson K, Geyer MA. Behavioral psychopharmacology of MDMA and MDMA-like drugs: a review of human and animal studies. Addict Res Theory. 2002;10:43–67.
- Hegadoren KM, Baker GB, Bourin M. 3,4-Methylenedioxy analogues of amphetamine: defining the risks to humans. Neurosci Biobehav Rev. 1999;23:539–553.
- Ricaurte GA, Martello AL, Katz JL, et al. Lasting effects of (+-)-3,4-methylenedioxymethamphetamine (MDMA) on central serotonergic neurons in nonhuman primates: neurochemical observations. J. Pharmacol Exp Therapeut. 1992;261:616–622.
- McCann UD, Eligulashvili V, Ricaurte GA. 3,4-Methylenedioxymethamphetamine (‘Ecstasy’)-induced serotonin neurotoxicity: clinical studies. Neuropsychobiology. 2000;42:11–16.
- Takayama N, Iio R, Tanaka S, et al. Analysis of methamphetamine and its metabolites in hair. Biomed Chromatogr. 2003;17:74–82.
- Kraemer T, Paul LD. Bioanalytical procedures for determination of drugs of abuse in blood. Anal Bioanal Chem. 2007; 388:1415–1435.
- Boles TH, Wells MJM. Analysis of amphetamine and methamphetamine as emerging pollutants in wastewater and waste-water impacted streams. J Chromatogr A. 2010;1217:2561–2568.
- Songjaroen T, Dungchai W, Chailapakul O, et al. Blood separation on microfluidic paper-based analytical devices. Lab Chip. 2012;12:3392–3398.
- Vella SJ, Beattie P, Cademartiri, et al. Measuring markers of liver function using a micropatterned paper device designed for blood from a fingerstick. Anal Chem. 2012;84:2883–2891.
- Pollock NR, Rolland JP, Kumar S, et al. A paper-based multiplexed transaminase test for low-cost, point-of-care liver function testing. Sci Transl Med. 2012;4:152ra129.
- Dungchai W, Chailapakul O, Henry CS. A low-cost, simple, and rapid fabrication method for paper-based microfluidics using wax screen-printing. Analyst. 2011;136:77–82.
- Fenton EM, Mascarenas MR, Lopez GP, et al. Multiplex lateral-flow test strips fabricated by two-dimensional shaping. ACS Appl Mater Interfaces. 2009;1:124–129.
- Fu E, Lutz B, Kauffman P, et al. Controlled reagent transport in disposable 2D paper networks. Lab Chip. 2010;10:918–920.
- Fu E, Kauffman P, Lutz B, et al. Chemical signal amplification in two-dimensional paper networks. Sens Actuators B Chem. 2010;149:325–328.
- Yetisen AK, Akram MS, Lowe CR. Paper-based microfluidic point-of-care diagnostic devices. Lab Chip. 2013;13:2210–2251.
- Narang J, Malhotra N, Singhal C, et al. Point of care with micro fluidic paper based device integrated with nano zeolite–graphene oxide nanoflakes for electrochemical sensing of ketamine. Biosens Bioelectron. 2017;88:249–257.
- Yager P, Edwards T, Fu E, et al. Review article microfluidic diagnostic technologies for global public health. Nature. 2006;442:412–418.
- Narang J, Singhal C, Mathur A, et al. Lab on paper chip integrated with Si@GNRs for electroanalysis of diazepam. Anal Chim Acta. 2017;980:50–57.
- Narang J, Malhotra N, Singhal C, et al. Detection of alprazolam with a lab on paper economical device integrated with urchin like Ag@ Pd shell nano-hybrids. Mat Sci Eng C. 2017;80:728–735.
- Singhal C, Malhotra N, Pundir CS. An enzyme free vitamin C augmented sensing with different ZnO morphologies on SnO2/F transparent glass electrode: a comparative study. Mat Sci Eng C. 2016;69:769–779.
- Baral A, Khanuja M, Islam SS, et al. Identification and origin of visible transitions in one dimensional (1D) ZnO nanostructures: excitation wavelength and morphology dependence study. J Lumin. 2017;183:383–390.
- Bhuyan T, Khanuja M, Sharma R, et al. A comparative study of pure and copper (Cu)-doped ZnO nanorods for antibacterial and photocatalytic applications with their mechanism of action. J Nanopart Res. 2015;17:288.
- Li X, Zhao C, Liu X. A paper-based microfluidic biosensor integrating zinc oxide nanowires for electrochemical glucose detection. Microsyst Nanoeng. 2015;1:15014.
- Macedo C, Branco PS, Ferreira LM, et al. Synthesis and cyclic voltammetric studies of 3,4-methylene dioxymethamphetamine (MDMA) human metabolites. J Health Sci. 2007;53:31–42.
- Kaini A, Raoof JB, Nematollahi D, et al. Electrochemical study of catechol in the presence of dibuthylamine and diethylemaine in aqueous media: part 1. Electrochemical investigation. Electroanal. 2005;1755–1760.
- Nematollahi D, Tammari E, Sharifi S, et al. Mechanistic study of the oxidation of catechol in the predsence of secondary amines by digital simulation of cyclic voltammograms. Electrochim Acta. 2004;49:591–595.
- Bolton JL, Trush MA, Penning TM, et al. Role of quinones in toxicology. Chem Res Toxicol. 2000;13:135–160.
- Moreno D, Grenu de BD, Garcia B, et al. A turn-on fluorogenic probe for detection of MDMA from ecstasy tablets. Chem Commun (Camb). 2012;48:2994–2996.
- Kato N, Fujita S, Ohta H, et al. Thin layer chromatography/fluorescence detection of 3,4-methylenedioxy-methamphetamine and related compounds. J Forensic Sci. 2008;53:1367–1371.
- Garrido EMPJ, Garrido JMPJ, Milhazes N, et al. Electrochemical oxidation of amphetamine-like drugs and application to electroanalysis of ecstasy in human serum. Bioelectrochem. 2010;79:77–78.
- Tadini MC, Balbino MA, Eleoterio IC, et al. Developing electrodes chemically modified with cucurbit[6]uril to detect 3,4-methylenedioxymethamphetamine (MDMA) by voltammetry. Electrochim Acta. 2014;121:188–193.
- Cumba LR, Smith JP, Zuway KY, et al. Forensic electrochemistry: simultaneous voltammetric detection of MDMA and its fatal counterpart “Dr Death” (PMA). Anal Methods. 2016;8:142–152.