
 ?Mathematical formulae have been encoded as MathML and are displayed in this HTML version using MathJax in order to improve their display. Uncheck the box to turn MathJax off. This feature requires Javascript. Click on a formula to zoom.
Abstract
In this study, drug delivery system of gliclazide, a poorly soluble drug, was developed and evaluated in vitro and in vivo. We synthesized five series of mPEG-PCL di block copolymers. The structure of the copolymers was characterized by 1H-NMR, Fourier transform infrared spectroscopy (FT-IR), differential scanning calorimetry (DSC) and gel permeation chromatography (GPC) techniques. In this study, gliclazide was encapsulated within micelles through a single-step nano-precipitation method, leading to formation of gliclazide/mPEG-PCL micelles. The resulting micelles were characterized further by various techniques such as DLS and AFM. The serum glucose lowering effect of gliclazide micelles was studied in streptozotocin-diabetic rats and were compared with the gliclazide treated rats. The results showed that the zeta potential of micelles was about −14.9 mV and the average size was 83.12 nm. Gliclazide was encapsulated into mPEG-PCL micelles with loading capacity of 21.05 ± 0.14% and entrapment efficiency of 94.11 ± 0.12%. In vivo testing of the gliclazide micelles in diabetic rats demonstrated a significant antidiabetic effect of gliclazide micelles after the 7 day that lasted for 21 days when compared with gliclazide powder. The results suggest that gliclazide micelles are a valuable system for the sustained delivery of gliclazide.
Introduction
Gliclazide is a potential second generation, short-acting sulfonylurea oral hypoglycemic agent widely used for the treatment of non-insulin-dependent diabetes mellitus [Citation1–3]. In general, rapid gastrointestinal absorption is required for oral hypoglycemic drugs in order to prevent a sudden increase in blood glucose level after food intake in patients with diabetes mellitus. However, the absorption rate of gliclazide from the gastrointestinal tract is slow and varied among subjects. Slow absorption of a drug usually originates from either poor dissolution of the drug from the formulation or poor permeability of the drug across the gastrointestinal membrane [Citation2–5]. The normal prescribed dose of gliclazide is 80 mg and could be increased to 380 mg daily, and hence there is a need for the development of sustained release patient-compliant formulations of gliclazide [Citation5–8]. The amphiphilic nanoparticles that include a hydrophobic core and a hydrophilic shell are excellent candidates for carrying hydrophobic drugs [Citation9–13]. Methoxypoly (ethylene glycol) Poly (ε-caprolactone)/(mPEG/PCL) is a diblock PCL/PEG copolymer that self-assemble into nanoparticles with core shell structure: a hydrophobic PCL core and a hydrophilic PEG shell [Citation14–17]. Although encapsulated with the hydrophobic drug, the hydrophobic PCL segment joint with the drug forms the core and the hydrophilic PEG forms the shell of nanoparticles, the drug assembly is intravenously injected. Additionally, entrapment with hydrophobic drugs mPEG/PCL copolymers possibly will improve constancy and systemic distribution of drugs and release drugs at a sustained time in the finest variety of drug concentration [Citation18,Citation19]. Furthermore, mPEG/PCL copolymers are recyclable, biocompatible, and simple to construct, showing hopeful applications in drug-delivery systems [Citation3,Citation20–24]. Newly mPEG-PCL micelles were applied to carry hydrophobic drugs with the aim of bringing narrative aqueous formulations for these drugs [Citation24–28]. In this study, an effort was made to support an aqueous formulation for gliclazide, we organized gliclazide encapsulated mPEG-PCL micelles. The objective of this study was to design a sustained release formulation of mPEG-PCL micelles containing gliclazide to increase the duration of its blood glucose-lowering effect.
Materials and methods
Materials
mPEG (Mn = 5000 Da), and 2-ethyl-hexanoate (Sn(Oct)2) (Aldrich, St. Louis, CAS.81323, CAS.301100), ε-caprolactone (98% purity)(Acros, New Jersey, CAS.502443), streptozotocin (Sigma, USA), gliclazide was obtained from Synteco Chemical Ltd. (Italy), Other chemicals and solvent were from chemical lab purity grades, purchased from Emertatchimi.
Synthesis of mPEG-PCL copolymers
mPEG-PCL diblock copolymers was prepared using the method mentioned in our previous report [Citation18,Citation22,Citation24,Citation29]. It was synthesized by a ring opening polymerization of ε-caprolactone with mPEG as initial moleculeusing Sn(Oct)2 as catalyst. In brief, ε-caprolactone (0.5, 1, 2, 4and 5 g), mPEG (1 g), and Sn(Oct)2 (0.01 mmoL) were heated to 120 °C to begin polymerization. After 12 h, the resultant copolymers were cooled to room temperature, dissolved in chloroform, and precipitated in cold diethyl ether. The copolymers were dried under vacuum at room temperature for 24 h.
Characterization of mPEG-PCL copolymers
The chemical structure of copolymers werecalculated by Fourier transform infrared spectroscopy (FT-IR) (Bruker, Tensor 27) and proton nuclear magnetic resonance spectroscopy (1H-NMR) in CDCl3 at 400 MHz (Bruker, Avance 400). Differential scanning calorimetry (DSC) (Mettler Toledo, model Star SW 9.30) was applied for thermal analysis of the synthesized copolymers. Samples were heated at a rate of 10 °C min−1 and the values were recorded from 0 to 200 °C. The average molecular weight and distribution of the mPEG-PCL copolymers were determined by gel permeation chromatography (GPC) (Knaure, Berlin, Germany) set with differential refractometric detector and an ultra styragel column (4.6 ώ 30 mm) (Waters, Milford, MA, model HR 4E). The mobile phase used was tetrahydrofuran (THF) with a flow-rate of 1 ml/min and the injection volume was 50 µL of stock solutions (0.1–0.5 w/v %). Polymers were characterized by relative elution time to polystyrene monodisperse standards in the range of 1500–35500 Da (Varian, Palo Alto, CA) using the calibration obtained previous to measurements.
Preparation of gliclazide-loaded micelles
Micelles were prepared according to our previous report [Citation22,Citation29]. Nanoprecipitation method was used for preparation of micelles. Acetone was used as the solvent in this method. In brief, Mpeg-PCL copolymer (20 mg) and gliclazide (1, 2, 5, 10, 15 and 20 mg) were dissolved in 2 ml of acetone. The solution was, then, injected drop-wise using a syringe (G = 22) into 20 ml of distillated water under certain combination rates and stirred magnetically at room temperature awaiting whole disappearance of the organic solvent which caused the amphiphilic copolymers self-assemble to form the micelles. After elimination of acetone by rotary vacuum evaporation at 35 °C, the resultant aqueous solution was filtered throughout a 0.45 µm filter membrane to eliminate the unloaded gliclazide. The resulting molecules were centrifuged at 20,000 g for 20 min and were separated as well as freeze-dried under a pressure of 14 Pa at −78 °C until all the residual solvents and the final dried form of micelles loaded by gliclazide was separated.
Characterization of the micelles
Particle morphology
The morphology of micelles was assigned using atomic force microscopy (AFM) (JPK, Berlin, Germany, model Nano Wizard). For AFM sample preparation, micelles were diluted with water and a droplet of 2 μL was placed onto a freshly cleaved mica substrate (1 cm2) and air-dried. AFM measurements were performed in intermittent contact mode.
Critical micelle concentration (CMC)
Thecopolymer was precisely weighted and dissolved in redistilled water at 5–8 °C and stored at 4 °C for 24 h. By dilution with redistilled water, a series of aqueous solutions with different concentration of copolymer were obtained. 0.1 ml solution of pyrene in acetone was aliquoted into a series of amber glass vials and acetone was evaporated under a stream of nitrogen. The copolymer solutions in water ranging in concentrations were added into the vials to give a final pyrene concentration of 6 × 10⁻⁷ mol/l. All the solutions were equilibrated in water bath at 60 °C, stored overnight at room temperature and filtered through 0.45 µm filter membrane prior to measurements. CMC of the copolymer was determined by fluorescence spectroscopy using pyrene as fluorescence probe. The fluorescence spectrum was recorded on a fluorescence spectrophotometer (F-7000 FL, Hitachi Corp., Japan). The excitation spectrum was recorded from 370 to 500 nm with an emission wavelength of 390 nm. Both excitation and emission bandwidths were 2.5 nm. Scanning speed was 240 nm min−1. Fluorescent spectra of pyrene solutions contained a vibration band exhibiting high sensitivity to the polarity of the pyrene environment. As shown in the excitation spectra of pyrene with formation of micelles, pyrene moved into the micelles from the aqueous phase, which resulted in an alteration in the intensity ratio (I392/I373) of pyrene fluorescence bands A (392 nm) to B (373 nm). The intensity ratios (I392/I373) were analyzed as a function of copolymer concentration at room temperature. A CMC value was taken from the intersection of the tangent to the curve at the inflection with the horizontal tangent through the points at low concentrations.
Determination of particle size
The particle size distribution of the organized micelles was assigned by dynamic light scattering (DLS) using a nano/zetasizer (Malvern Instruments, Worcestershire, UK, model Nano ZS).
Stability of micelles
For evaluation of the physical stability of micelles the particle size distribution of the micelles was monitored in phosphate-buffered solution (PBS, pH = 7.4) and kept in room temperature at times 0, 15, 30, 60, 90, 120, 150 and 180 days after grounding by using the method described in the above section.
Determination of loading efficiency
Two parameters including the drug loading ratio and efficiency of entrapment were determined for determination of the loading efficiency of the drugs in the micelles. Drug loading ratio was determined as:
(1)
(1)
where DL% is the drug loading ratio (percent), Wdrug and Wmicelles signify the weight of the entrapped drug and the total weight of the consequent drug-entrapped micelles, respectively. For determination of the drug loading ratio, 1 mg of the final freeze-dried nano dispersion was dissolved in 1 ml of chloroform and the drug content was calculated spectrophotometrically (Thermo Fisher Scientific, USA, Madisonmodel GENESYS™ 10 S) at wavelengths of 232 nm [Citation30]. Efficiency of entrapment was determined in reference to loading ratio and total dried nano dispersion weight was obtained using the following equation:
(2)
(2)
where EE% is the efficiency of entrapment (percent), Wmicelles and Wfeed drug stand for the total mass of powders obtained after freeze-drying and the drug fed initially in the micelles preparation step, respectively.
FT-IR analysis
Using FT-IR analysis, it is probable to achieve a number of information regarding the incidence of achievable interaction(s) between substances concerned in a nanocarrier system. Usually, the interaction between drug and polymer is evaluated during the band shifts exerted by the functional groups as well as through broadening in IR spectra in comparsion to their individual spectra. To verify the attendance of any interactions between drug and polymer, the FT-IR spectra of solid micelles were compared with pure drug and individual polymers. Freeze-dried samples were pressed to form standard disks and the FT-IR spectra of the KBr disks were recorded using the aforementioned instrument from 600 to 4000 cm−1.
DSC analysis
DSC analysis was performed to observe further information on the drug-copolymer relationship and possible drug-polymer interaction(s), as well as the physical changes happened the drug or polymer can be considered by means of the thermal analysis. DSC analysis was carried out on the pure drug and drug-loaded micelles. Samples were heated at a rate of 10 °C min−1 and the data were recorded from 0 to 200 °C.
Solubility studies
Solubility measurements were performed according to the method of Higuchi and Connors. In brief, solubility studies of different samples of gliclazide and micelles were carried out in water. Saturated solutions were prepared by adding excess drug to the medium and was shaken on the shaker for 48 h at 25 ± 0.5 °C under constant vibration. After this period the solutions were filtered, diluted and analyzed by UV-Vis. Three determinations were carried out for each sample to calculate the solubility of gliclazide.
Drug release study
This investigation was approved out to estimate the release of gliclazide from nanoparticles. In brief, 5 mg of freeze-dried micelles were dispersed in 2 ml phosphate-buffered saline (PBS) containing 2% (v/v) Tween 80 and the follow-on suspension was sited within a dialysis sac (Mw 12 kDa) and incubated at 37 °C while immersed in 15 ml of PBS. Then, at programmed time intervals, 2 ml of the dialysate was taken out and replaced by 2 ml of the new PBS solution. The concentration of gliclazide in the dialysate was determinate by UV-Vis at 232 nm. The calibration curve for gliclazide was linear over the concentration range of 0.48–15.6 µg/mL. All the release studies were carried out in triplicate. To facilitate study the pH-dependency of the drug release, the experiments were also carried out, as specified earlier, using PBS at a pH of 5.5, as controls. The release of free gliclazide was studied in PBS with pH = 7.4 and 5.5.
Drug release kinetics
In order to evaluate the mechanism of the drug release process from the carrier under different values of pH, release data were fitted to the Ritger-Peppas equation (Equation 3), which is one of the generalized empirical equations widely used to describe drug release from polymeric systems.
(3)
(3)
where Mt/M∞ is the fractional release of drug at time t (Mt) and the drug released at equilibrium time (M∞), k is the constant characteristic of the drug-polymer system, and n is the diffusion exponent characteristic of the release mechanism. The slope and the intercept of the plot drawn between ln Mt/M∞ and ln t give the value of n and k, respectively. Normal Fickian diffusion is characterized by n = 0.5 and Case II diffusion by n = 1.0. A value of n between 0.5 and 1.0 indicates a mixture of Fickian and Case II diffusion, which is usually called non-Fickian, or anomalous diffusion. Data analysis was carried out using the Excel add-in DDSolver program.
In vivo study
Experiments were performed in adult male Wistar rats weighing from 200 to 250 g. Rats were procured from Pasteur Institute, IRAN and were housed in groups of four under standard environmental conditions (23 ± 1 °C, 55 ± 5% humidity and a 12 h/12 h light/dark cycle) and maintained with free access to water and a standard laboratory diet (carbohydrates 30%, proteins 22%, lipids 12%andvitamins 3%) ad libitum. The protocol of the animal study was approved by Institutional Ethical Committee.
Streptozotocin (STZ)-induced diabetic rat model
Diabetes was induced by intraperitoneal injection of streptozotocin (STZ) (Sigma, St. Louis, MO) into at a dose of 60 mg/kg body weight. STZ was extemporaneously dissolved in 0.1 M cold sodium citrate buffer, pH 4.5. No diabetic animals with glucose levels less than 250 mg/dL were used in the study. The animals were fasted overnight (12 h) before starting the experiment. Then were randomly assigned to four different groups (n = 6 in each group). The control and diabetic control group received distilled water; treated groups received gliclazide at a dose of 1.33 mg/kg and micelles (∼1.33 mg/kg gliclazide) in suspension form. All experiments were performed on overnight fasted rats. The drug solutions or vehicle were administered orally by gastric intubation using a syringe. On the day of study, micelles were given in the form of suspension (∼1.33 mg/kg gliclazide) and gliclazide (1.33 mg/kg).
Blood collection and biochemical analysis
After three days of STZ injection .the blood glucose level of rats reached to 250 mg/dL, later the rats were fasted for 12–14 h and 0.5 ml of blood was withdrawn after 0, 7, 14 and 21 days through the retro-orbital plexus using a glass capillary and were collected in Eppendorf tubes containing 20 ml of 10% EDTA. The collected blood was centrifuged for 10 min at 3000 rpmand the plasma obtained was used for glucose measuring.
Results
Synthesis and characterization of mPEG-PCL copolymer
mPEG-PCL diblock copolymer was synthesized using the ring-opening polymerization of caprolactone in presence of mPEG, whose hydroxyl end group initiated the ring opening as shown in the previous work (). The structure and composition of the synthesized mPEG-PCL diblock copolymer was determined by 1H-NMR spectroscopy in CDCl3 (). The presence of methylenes (CH2) in PCL was observed around 1.5, 1.8 , 2.3 and 4.1 ppm, the methoxy and methylene protons in methoxy(OCH3) and methylene (CH2) groups of PEG were observed around 3.4 and 3.8 ppm, respectively. Diblock copolymers of different molecular weights were obtained by controlling the ε-CL:PEG ratio. Characteristics of the synthesized copolymers (P1–P5) are shown in . FT-IR spectrum of mPEG-PCL copolymer is shown in . In the spectrum shown, the sharp and intense bands at 1731.55 and 1115.12 cm−1 were awardable to the presence of carboxylic ester (C=O) and ether (C–O) groups, thereby indicating that the formation of mPEG-PCL copolymer was successful. GPC results showed that the weight-based average molecular weights of copolymers was from 8456 until 21364 Da (). The GPC curve for copolymer P5 is shown in . DSC thermograms of the copolymers showed the endothermic peak which included two merged peaks of PEG and PCL which is presented in .
Figure 1. (a) Schematic synthesis route of mPEG-PCL copolymer, (b) 1H-NMR spectrum of mPEG-PCL copolymer, and (c) GPC curve of copolymer P5.
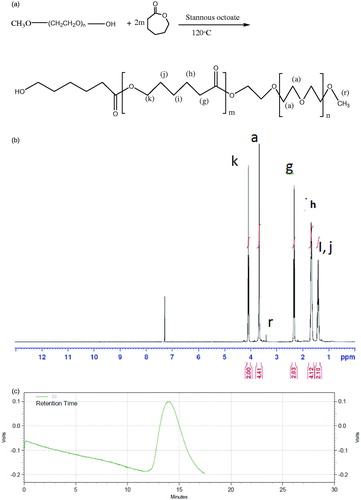
Table 1. Molecular characterics of the synthesized copolymers.
Preparation and characterization of copolymeric micelles
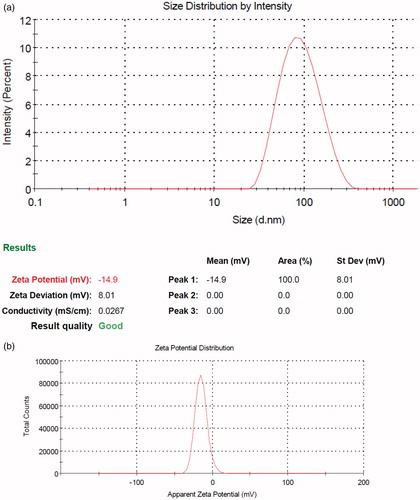
The formation of micellar nanostructures was confirmed by AFM. Apparently, mPEG-PCL micelles showed a homogeneous spherical morphology, as expected (). The size of nanoparticles was measured by dynamic light scattering technique. As shown in , the z-average and zeta potential of gliclazide loaded mPEG-PCL micelles was found to be about 83.12 nm, with zeta potential −14.9 mV, with their corresponding PDI being 0.230 (). The micelle size observed by AFM was about 78 nm, a little smaller than that determined by DLS. It can be explained by the fact that the micelle diameter determined by DLS represents the hydrodynamics diameter while that obtained by AFM is related to the collapsed micelles after water evaporation. The loading ratio and encapsulation efficiencies of gliclazide loaded to mPEG-PCL micelles were determined to be 21.05% ± 0.14 and 94.11% ± 0.12, respectively.
Figure 2. AFM image of gliclazide loaded spherical core shell micelles.
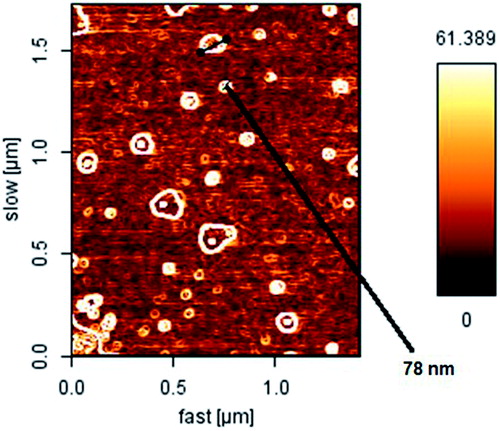
Figure 3. Particle size distribution and zeta potential of gliclazide/mPEG-PCL and mPEG-PCL micelles. (a) particle size distribution and (b) zeta potential of gliclazide/mPEG-PCL micelles.
CMC of copolymer
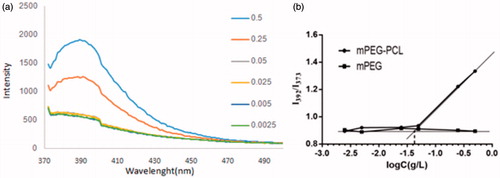
illustrates the fluorescence excitation spectra of 6 × 10⁻⁷ mol/L pyrene in water in the presence of mPEG-PCL at various concentrations. In spite of the constant pyrene concentration, the fluorescence intensity extremely increased and the maximal peak position shifted from 373 to 392 nm as the polymer concentration increased. This phenomenon was attributed to the formation of the micelles in the system and entering of the pyrene molecules into the micelle phase which show much stronger fluorescence than in the water phase. shows the intensity ratio (I392/I373) against logarithmic concentration of copolymer. It is clear that below a certain concentration, this ratio was approximately constant and above this concentration, it increased with increasing copolymer concentration, indicating the formation of micelles. The CMC was taken as the intersection of the tangent of the curve in these two parts. The CMC of 0.045 g L−1 for mPEG-PCL micelles was calculated which was much lower than the CMC for low molecular surfactants and PEG-PCL (polycaprolactone) or PEG-PLA diblock copolymers.
Figure 4. (a) Excitation spectra of pyrene in water for mPEG-PCL copolymer at various concentrationsand, (b) Intensity ratio I392/I373 of pyrene excitation spectra versus log C for mPEG-PCL copolymer.
Physical stability of micelles
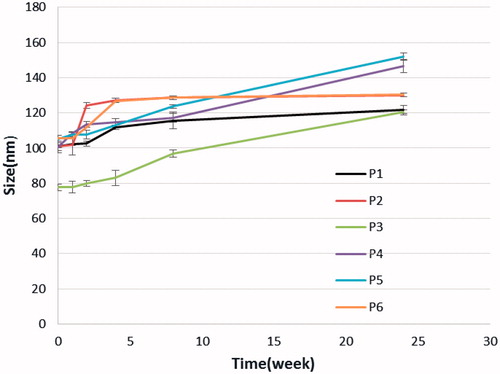
In the clinical administration of nanoparticle dispersions, the stability of the sizes of the nanocarriers is of great importance both as a measure of the particle structure integrity and as an indicator of the possible inter-particular associations/aggregation. For this purpose, the particle size stability was monitored in this study over a 180-days course. The variation of the sizes of micelles as a function of incubation time is shown in . As it can be seen, the size of all micelles increased slightly throughout the measurement period. This observation cannot be a sign of aggregation, which usually leads to several fold increases. Probably some kind of copolymer swelling and/or hydration as a result of presence of the hydrophilic PEG portions in micelles surfaces can be responsible for this event.
Figure 5. Stability micelles.
Impact of copolymer composition on drug entrapment efficiency
To develop an ideal formulation of higher DL or EE, five series of micelles (M1–M5) were synthesized and the effects of the ratio of PCL and PEG on DL and EE were studied. The gliclazide/mPEG-PCL mass ratio at 0.25 (M10) was chosen in our study. The DL and EE of M1–M5 are listed in . When the Micelles had a fixed PEG length, the DL and EE increased with the rise of feed weight ratio of PEG:ε-CL (from 1:0.5 to 1:5). The maximum EE reached 74.80 and 94.11% for M4 and M5, respectively. Amphiphilic mPEG-PCL copolymer formed micelles with a core-shell structure in water, where the core and shell were a hydrophobic PCL chain and a hydrophilic PEG chain, respectively. The hydrophobic drug could then be encapsulated into a hydrophobic core by means of the hydrophobic interaction of PCL and gliclazide and with the interaction between water and the hydrophilic shell of PEG; the drug was able to dissolvein water. The increase of the DL and EE of gliclazide in mPEG-PCL may be caused by the strong hydrophobic interaction between the longer hydrophobic PCL block chain and hydrophobic drugs. After DL, the size of the micelles increased. This result was expected because incorporation of gliclazide into the hydrophobic cores increased the volume of the micelles.
Table 2. Characterisistic of micelles from the synthesized copolymers.
Effect of the different drug to polymer ratio on drug encapsulation efficiency of micelles
To optimize the progression parameters and impending into the impact of the drug/copolymer ratio on loading and encapsulation efficiency, different gliclazide/mPEG-PCL mass ratios in the feed were evaluated in our study. The copolymer P5 (CL/EG: 5) was used for our study. The loading capacity and encapsulation efficiencies increased with the rise of gliclazide/mPEG-PCL mass ratios (from 0.05 to 0.5) and also, particle size and polydispersity index (PDI) increased, but the stability of the gliclazide/mPEG-PCL micelles decreased. When the gliclazide/mPEG-PCL mass ratio was 0.75 and 1, the obtained gliclazide/mPEG-PCL micelles were not stable in water (micelles tended to aggregate, forming aggregates); thus, the gliclazide/mPEG-PCL mass ratio at 0.25 (M10) was chosen in our study (). The interpretation can be assigned in conditions of insolubility of gliclazide in the aqueous solution, which could guide more drugs at high concentration to be adsorbed on the surface of micelles.
Table 3. Properties of gliclazide-loaded mPEG-PCL micelles.
FT-IR analysis
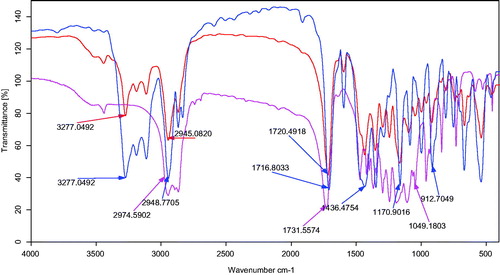
The FT-IR spectra of mPEG-PCL copolymer, gliclazide, and gliclazide/mPEG–PCL micelles are presented in . The FT-IR spectrum of gliclazide shows feature bands indicated at 1622.47 cm−1 for C=C bands of aromatic ring, 912.70 cm−1 for C–H stretching of aromatic ring, 3277.04 cm−1 for N–H stretching bands for phenolic hydroxyl group and 1716.70 cm−1 for C=O vibration. By comparing these data with the drug-loaded micelles spectrum it was observed that the existence of gliclazide characteristic peaks in the spectrum of micelles could express the flourishing loading of gliclazide in the micelles. The majority remarkable characteristic of the FT-IR spectra of micelles was the red shift of the C=O vibration, from 1716.70 to 1731.55 cm−1 for gliclazide-loaded micelles compared to the gliclazide spectrum. The shift in the micelles spectrum shows that there are some form(s) of relationship between gliclazide and C=O functional group of gliclazide.
Figure 6. FT-IR spectra of (a) gliclazide, (b) gliclazide/mPEG-PCL micelles, and (c) mPEG-PCL.
DSC analysis
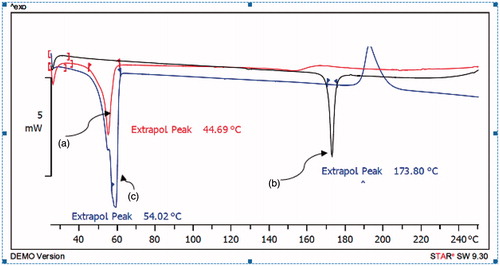
shows the DSC thermograms corresponding to mPEG-PCL copolymer, gliclazide and micelles loaded by gliclazide. The thermogram of mPEG-PCL copolymer displayed an endothermic peak at 54.02 °C which is indicative for the melting of the crystalline PCL segment of copolymer, the thermogram of gliclazide displayed an endothermic peak at 173.80 °C which was not observed in nano particulate gliclazide. Thus, it could be concluded that the gliclazide in the micelles was in an amorphous or disordered crystalline phase or in a solid solution state and micelles displayed one endothermic peak at 44.69 °C which stand for the melting of copolymer association in the form of micelles. This endothermic peak of micelles presumably confirms a physical interaction between copolymer and gliclazide upon loading of the drug in micelles, since the melting point of PCL micelles was lower than melting point of copolymer.
Figure 7. Differential scanning calorimetry (DSC) spectra of (a) gliclazide/mPEG-PCL micelles (b) gliclazide and (c) mPEG-PCL.
In vitro release of gliclazide
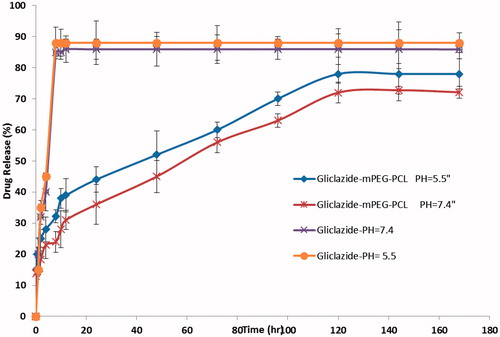
In order to examine the influence of the chemical and biochemical factors on the release of gliclazide from micelles, the release study was performed on drug-loaded micelles in neutral (pH = 7.4) and acidified PBS solution (pH = 5.5). As controls, the release of free gliclazide was studied to verify that the diffusion of drug molecules across the dialysis membrane which was not a rate-limiting step during the release process. Free gliclazide was observed to be rapidly released and reached its peak of 85.90 and 88.00% of the total in the first 8 h at pH 7.4 and 5.5, respectively. shows the release profiles of gliclazide from the drug-loaded micelles, at pH 7.4 and 5.5. As expected, no considerable initial burst gliclazide release was observed from the micelles. As shown in , the percentage of gliclazide released from the micelles increased as the pH value decreased from 7.4 to 5.5. For example, after 96 h incubation, the amounts of gliclazide released in the media with pH values of 7.4 and 5.5 were about 62.8 and 70.65%, respectively. The reason behind this phenomenon lies in the pH sensitivity of the release rate of gliclazide from the micelles because the copolymer is degradable in acidic condition by hydrolysis. Also, the release is faster in acidic pH than in neutral, as in acidic environment the polymer matrix swells due to protonation of polymer. This behavior is a highly desirable characteristic in many drug applications delivery where they can potentially facilitate the drug release from obtained micelles. The results revealed that the maximum drug releases were 72.54 and 78.18%, respectively for PBS pH 7.4 and 5.5 after a period of 120 h. The sustained release of gliclazide can be attributed to the entrapment of gliclazide in core of micelles. Therefore, the obtained copolymeric micelles can be regarded as highly attractive nanocarrier for time-controlled drug delivery of hydrophobic drugs for different therapeutic objectives.
Figure 8. The release profiles of gliclazide from gliclazide/mPEG-PCL micelles in different release medias.
Kinetic study
To get insight into drug release mechanism, we also studied drug release kinetic for micelles. The findings revealed that in both cases including PBS buffer (pH 7.4 and 5.5), gliclazide release data adequately were fitted to the Ritger–Peppas model. According to the Ln–Ln fit of our experimental data using the least squares procedure, the values of R2 for micelles in the media with the pH value of 7.4 and 5.5 were found to be 0.989 and 0.99, respectively. However, the exact mechanism of drug release from micelles due to the complicated influence of chemical cleavage and drug diffusion cannot be illustrated easily by this model. According to the structure of prepared nanoparticles, it is believed that the release rate of drug is controlled by both the rate of hydrolysis of the ester bond between copolymer and its rate of diffusion. As expected, the drug release mechanism in the present study mainly depends on diffusion rather than matrix degradation. In fact, it has been demonstrated that the biodegradable polyesters are slowly degraded. The degradation time of copolymers is reported to be more than 30 days. Therefore, considering the drug release duration in the present study (6 days), copolymer degradation did not show any significant influence on the drug release kinetic.
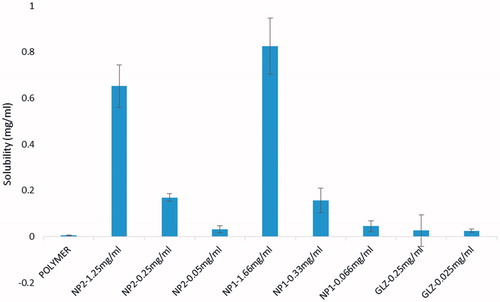
Solubility studies
Solubility profiles of gliclazide and the micelles are shown in . According to the results, the solubility of all micelles samples is remarkably more than the gliclazide. By considering all data obtained in the present study it can be postulated that there should be two main factors responsible for an increase in solubility of micelles; (a) an increase in wet ability of drug particles and (b) an increase in saturated solubility of the treated drug particles. These results suggested that mPEG-PCL micelles would be an increasing solubility for gliclazide [Citation31].
Figure 9. Solubility of gliclazide.
In vivo study
The normal as well as diabetic control rats did not show any significant changes in serum glucose level (SGL) over a period of experiment. Although as the time progressed, slight decrease in SGL was observed in both groups i.e. control as well as diabetic control. The decrease may be attributed to the fasting effect on serum glucose level. Gliclazide treated rats showed a decrease at 7 day with a Cmin of 33.52% decrease in SGL of basal level. Micelles treated rats also showed a decrease at 7 day and Cmin of 38.88% decrease in SGL of basal level, compared with diabetic control group. Gliclazide-loaded micelles treated rats showed at 14 day a significantly high Cmin of 10% more decrease in SGL of basal level, respectively when compared to gliclazide treated rats (). Also gliclazide-loaded micelles treated rats showed at 21 day a significantly high Cmin of 14.32% more decrease in SGL of basal level, respectively when compared to gliclazide treated rats. Statistical analyses were done again using the SPSS software, version 17 and was determined using the one-way ANOVA test, followed by the post-hoc Tukey test. Statistical significance was set at p < .05.
Figure 10. Effect of gliclazide and gliclazide/mPEG-PCL micelles on fasting blood sugar. All the values are expressed in mean ± SE (n = 6); *p < .05 compared to diabetic rat group; #p < .05 compared to gliclazide rat group.
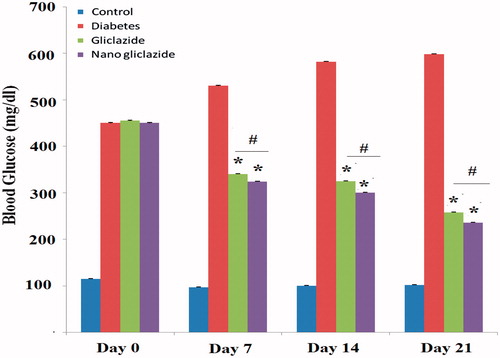
Our results shows that gliclazide and micelles-gliclazide treated rats have a lower FBS level compared to diabetic rats (p < .05) and also micelles-gliclazide treated rats showed t less FBS level in comparison with gliclazide treated rats (p < .05). However, no significant difference was observed in FBS level in first time after injection (Day0) (p > .05).
Discussion
Gliclazide is an oral antihyperglycemic agent used for the treatment of non-insulin dependent diabetes mellitus (NIDDM). But gliclazide is a lipophilic drug and is insoluble in water, which limits its clinical application [Citation2]. Encapsulation by nanoparticles seems to be a brilliant advance to conquer the hydrophobicity of drugs. There are many encapsulation methods, such as spray-drying, solvent removal, etc. to encapsulate gliclazide into micelles or liposomes. In this study, we used mPEG-PCL micelles to encapsulate gliclazide. In the training procedure, gliclazide and mPEG-PCL diblock copolymer mixture was first dissolved in acetone solution, followed by the organic solvent evaporation. Then, the amphiphilic mPEG-PCL copolymers self-assembled into supramolecular preparations possessing a hydrophobic inner core and a hydrophilic shell in water and gliclazide self-assembled into the hydrophobic core of the micelles because of its hydrophobicity. The preparation procedure was uncomplicated and easy to scale up. These mPEG-PCL micelles are biodegradable, biocompatible, amphiphilic, stable in blood, nontoxic, non-immunogenic, non-inflammatory, and small in size; this makes mPEG-PCL micelles an exceptional applicant for drug-delivery systems [Citation32]. To defeat the poor water-solubility of gliclazide, we encapsulated gliclazide into mPEG-PCL micelles by a self-assembly method in this work, to produce gliclazide/mPEG-PCL micelles. The gliclazide/mPEG-PCL micelles were about 78 nm in diameter with a drug loading of 21.05 ± 0.14 and entrapment efficiency of 94.11 ± 0.12%, respectively. Additionally, the gliclazide/mPEG-PCL micelles had a minor negative surface charge of −14.9 ± 0.16 mV, which increased the circulation time of the drug. Surface charge is significant in decisive whether the nanoparticles will cluster in blood flow or will stick to or interact with oppositely charged cell membrane. The plasma and blood cells constantly have a negative charge; nanoparticles with slight negative surface charge can minimize nonspecific contact with these components through electrostatic interactions [Citation33]. The gliclazide/mPEG-PCL micelles were capable to slowly release gliclazide, indicating that gliclazide/mPEG-PCL micelles may improve systemic circulation t½ of gliclazide in vivo. The sustained release of gliclazide from mPEG-PCL micelles might be due to the diffusion of gliclazide from micelles and the degradation or hydrolysis of micelles. In summary, mPEG-PCL micelles were used to encapsulate gliclazide, creating gliclazide/mPEG-PCL micelles. In vivo study of the micelles in diabetic rat model revealed a better decrease in SGL activity as compared to gliclazide in sustained form. It was assumed that micelles are be able to decrease the Cmin in time depended manner and probably enhanced bioavailability of gliclazide, decrease in side effects, and improvement of patient compliance.
Conclusion
mPEG-PCL micelle-encapsulated gliclazide was prepared, with the goal of improving the water solubility of gliclazide. These gliclazide/mPEG-PCL micelles can slowly release gliclazide, our study showed that these micelles provided a suitable and appropriate system for delivery of gliclazide. The in vivo study of the gliclazide micelles in a diabetic rat model revealed significant antidiabetic activity. These sustained release micelles may be considered for further evaluation in humans as a promising controlled release dosage form for gliclazide.
Disclosure statement
The authors declare no conflict of interest.
Additional information
Funding
Related Research Data
References
- Schernthaner G. Gliclazide modified release: a critical review of pharmacodynamic, metabolic, and vasoprotective effects. Metab Clin Exp. 2003;52:29–34.
- Burcelin R, Eddouks M, Maury J, et al. Excessive glucose production, rather than insulin resistance, accounts for hyperglycaemia in recent-onset streptozotocin-diabetic rats. Diabetologia. 1995; 3:283–290.
- Cabral H, Kataoka K. Progress of drug-loaded polymeric micelles into clinical studies. J Control Release. 2014;190:465–476.
- Chandra A, Mhadi AA, Ahamad S et al. Indian herbs result in hypoglycemic responses in streptozotocin-induced diabetic rats. Nutrition Research. 2007;27:161–168.
- Campbell DB, Lavielle R, Nathan C. The mode of action and clinical pharmacology of gliclazide: a review. Diabetes Res Clin Pract. 1991;14:S21–S36.
- Sarker A, Tiwari A, Bhasin PS, et al. Pharmacological and pharmaceutical profile of gliclazide: a review. J Appl Pharma Sci. 2011;1:11–19.
- Harrower AD. Comparison of efficacy, secondary failure rate and complications of sulfonylurea. J Diabetes Complications. 1994;8:201–203.
- Palmer KJ, Brogden RN. Gliclazide. An update of its pharmacological properties and therapeutic efficacy in non-insulin-dependent diabetes mellitus. Drugs. 2007;46:92–125.
- Goldberg M, Langer R, Jia X. Nanostructured materials for applications in drug delivery and tissue engineering. J Biomater Sci Polym Ed. 2007;18:241–268.
- Kheiri Manjili H, Sharafi A, Attari E, et al. Pharmacokinetics and in vitro and in vivo delivery of sulforaphane by PCL-PEG-PCL copolymeric-based micelles. Artif Cells Nanomed Biotechnol. 2017 [cited Feb 1]; [12 p.]. DOI:10.1080/21691401.2017.1282501
- Wei X, Gong C, Gou M, et al. Biodegradable poly (ɛ-caprolactone)–poly (ethylene glycol) copolymers as drug delivery system. Int J Pharm. 2009;381:1–18.
- Woodrow C, Haynes R, Krishna S. Artemisinins. Postgrad Med J. 2005;81:71–78.
- Poorbarkhordari E, Fooladsaz K, Hosseini SH, et al. The hypoglycemic effects of an ethanol extract of Peganum harmala in streptozotocin-induced diabetic rats. Iran J Pharm Res. 2014;10:47–54.
- Xie W, Zhu W, Shen Z. Synthesis, isothermal crystallization and micellization of mPEG-PCL diblock copolymers catalyzed by yttrium complex. Polymer. 2007;48:6791–6798.
- Yodthong B. Surfactant-free nanospheres of mPEG-PCL for controlled release of ibuprofen. J Appl Sci. 2009;9:2278–2279.
- Danafar H, Manjili H, Najafi M. Study of copolymer composition on drug loading efficiency of enalapril in polymersomes and cytotoxicity of drug loaded nanoparticles. Drug Res. 2016;66:495–504.
- Pan D, Fu Q, Lu J. Nanolithography through mixture of block copolymer micelles. Nanotechnology. 2012;23:305302.
- Gharebaghi F, Dalali N, Ahmadi E, et al. Preparation of wormlike polymeric nanoparticles coated with silica for delivery of methotrexate and evaluation of anticancer activity against MCF7 cells. J Biomater Appl. 2017;31:1305–1316.
- Gou M, Wei X, Men K, et al. PCL/PEG copolymeric nanoparticles: potential nanoplatforms for anticancer agent delivery. Current Drug Targets. 2011;12:1131–1150.
- Danafar H, Rostamizadeh K, Davaran S, et al. Drug-conjugated PLA–PEG–PLA copolymers: a novel approach for controlled delivery of hydrophilic drugs by micelle formation. Pharm Dev Technol. 2017;22:947–957.
- Xiong X, Tam K, Gan L. Release kinetics of hydrophobic and hydrophilic model drugs from pluronic F127/poly (lactic acid) nanoparticles. J Control Release. 2005;103:73–82.
- Nomani A, Nosrati H, Manjili HK, et al. Preparation and characterization of copolymeric polymersomes for protein delivery. Drug Res. 2017;67:458–465.
- Manjili HK, Malvandi H, Mousavi MS, et al. In vitro and in vivo delivery of artemisinin loaded PCL-PEG-PCL micelles and its pharmacokinetic study. Artif Cells Nanomed Biotechnol. 2017 [cited Jul 7]; [11 p.]. DOI:10.1080/21691401.2017.1347880
- Manjili H, Malvandi H, Mousavi MS, et al. Preparation and physicochemical characterization of biodegradable mPEG-PCL coreshell micelles for delivery of artemisinin. Pharm Sci. 2016;22:234–243.
- Zijah V, Salehi R, Aghazadeh M, et al. Preparation and characterization of PLGA-β-CD polymeric nanoparticles containing methotrexate and evaluation of their effects on T47D cell line. Artif Cells Nanomed Biotechnol. 2017;45:432–440.
- Asghari F, Samiei M, Adibkia K, et al. Biodegradable and biocompatible polymers for tissue engineering application: a review. Artif Cells Nanomed Biotechnol. 2017;45:185–192.
- Danafar H. Applications of copolymeric nanoparticles in drug delivery systems. Drug Res. 2016;66:506–519.
- Lin SY, Kawashima Y. The influence of three poly (oxyethylene)poly(oxypropylene) surface-active block copolymers on the solubility behavior of indomethacin. Pharm Acta Helv. 1985;60:n339–n344.
- Danafar H. Study of the composition of polycaprolactone/poly (ethylene glycol)/polycaprolactone copolymer and drug-topolymer ratio on drug loading efficiency of curcumin to nanoparticles. Jundishapur J Nat Pharm Prod. 2017;12:e34179.
- Danafar H, Hamidi M. Pharmacokinetics and bioequivalence study of amlodipine and atorvastatin in healthy male volunteers by LC-MS. Pharm Sci. 2015;21:167–174.
- Lukyanov AN, Torchilin VP. Micelles from lipid derivatives of water-soluble polymers as delivery systems for poorly soluble drugs. Adv Drug Deliv Rev. 2004;56:1273–1289.
- Chen W, Zhang JZ, Hu J, et al. Preparation of amphiphilic copolymers for covalent loading of paclitaxel for drug delivery system. J Polym Sci Part A: Polym Chem. 2014;52:366–374.
- Danafar H, Rostamizadeh K, Davaran S, et al. Co-delivery of hydrophilic and hydrophobic drugs by micelles: a new approach using drug conjugated PEG-PCL nanoparticles. Drug Dev Ind Pharm. 2017;43:1908–1918.