
 ?Mathematical formulae have been encoded as MathML and are displayed in this HTML version using MathJax in order to improve their display. Uncheck the box to turn MathJax off. This feature requires Javascript. Click on a formula to zoom.
Abstract
Oral cancer remains a major public concern with considerable socioeconomic impact in the world, especially in southeast Asia. Despite substantial advancements have been made in treating oral cancer, the five-year survival rate for OSCC remained undesirable, and 35–55% patients developed recurrence within two years even with multimodality therapeutic strategies. Hence, identification of novel biomarkers for diagnosis and evaluating clinical outcome is of vital importance. MicroRNAs are 22–24 nt non-coding RNAs that could bind to 3′ UTR of target mRNAs, thereby inducing degradation of mRNA or inhibiting translation. Due to its implication in regulation of post-transcriptional processes, the role of miRNAs in malignancies has been extensively studied, among which the discovery of functional miR-9 in oral squamous cell carcinoma (OSCC) remained to be elucidated. We first demonstrated that miR-9 was down-regulated in 21 OSCC patients, and we further found that forced expression of miR-9 could result in deterred cell proliferation and decreased ability to migrate and form colonies. Flow cytometry displayed cell-cycle arrested at G0/G1 phase. We next used Targetscan to predict target genes of miR-9. CDK6, a protein highly implicated in cell cycle control, was chosen for verification. Down-regulation of CDK6 and Cyclin D1 in Tca8113 transfected with miR-9 mimics indicate that the complex formed by both proteins may be the effector of the antiproliferative function of miR-9 in OSCCs. Considering small molecules are developed to target CDK4/6, our finding may provide valuable scientific evidence for research and development of therapies and diagnostic methodology in OSCCs.
Introduction
Oral cancer comprises of tumours arising in the lips, hard palate, alveolar ridges, tongue, buccal mucosa and retromolar, etc. [Citation1]. The treatment of oral cancer usually entails dysfuntion and distortion in speech, mastication and swallowing, and even inability to social interactions [Citation2]. Due to this, oral cancer remains a major public concern with considerable socioeconomic impact in the world, especially in southeast Asia [Citation3]. According to 2012 WHO Globocan statistics, oral cancer ranked as one of the top 10 cancer morbidity, of which the age-standardized incidence rate was 3.8 worldwide, and 4.3 in Europe [Citation4]. It Among those varieties of oral cancers, oral squamous cell carcinoma (OSCC) accounts for a predominantly 90% of all histological types [Citation5]. Substantial advancements been made in treating oral cancer, the five-year survival rate for OSCC remained undesirable [Citation2–4], and 35–55% patients developed recurrence within two years even with multimodality therapeutic strategies [Citation4,Citation5]. Despite clinical examination could access the primary tissues, most malignancies are insidious that cannot be diagnosed before they progressed to advanced stages [Citation6]. Therefore, it’s imperative to identify biomarkers for early diagnosis, which may also be promising in formulating therapeutic strategies.
MicroRNAs are a cluster of single-stranded short non-coding RNAs that are 22–24 nt in length. They either bind entirely to 3′UTR of target mRNAs to mediate degradation or partially to disrupt the translation of target mRNAs [Citation6–8]. During the past decades, miRNAs are noted as vital regulators involved in various cellular, physiological and developmental processes, in which miRNAs are predicted to regulate over 30% human genes [Citation9,Citation10]. Hence, miRNA deregulation received considerable attention and the identification of aberrantly expressed miRNAs becomes a sophisticated methodology in cancer researches of all aspects varying from diagnosis, prognosis and treatment development [Citation11]. miR-21 was reported as strongly associated with survival of OSCC patients [Citation12,Citation13]. The high expression of miR-21 was more frequently observed in OSCC patients with worse prognosis. Moreover, down-regulation of miR-125b, miR-100 and miR-193a in OSCCs were also documented [Citation14]. Although initially implicated in neurogenesis, the evidence of underexpressed miR-9 in multiple types of cancers were also reported, including colon cancer, nasopharyngeal cancer and melanoma and breast carcinoma [Citation12,Citation15–17], suggesting that miR-9 is a tumour suppressor.
In this study, we confirmed the down-regulation of miR-9 in OSCC patients, followed by overexpressing miR-9 in the highly malignant OSCC cell line Tca8113, in which impaired cell growth, migration and ability to form colonies were observed. To specify the stages at which the cell growth were hampered, flow cytometry was employed to determine the cell count of each phase of cell cycle. As a consequence, a significantly elevated accumulation in G0/G1 phase cells and decrease in S phase cells indicated that G1/S transition was deterred. Among the top 100 candidate genes predicted through TargetScan, CDK6, a protein highly implicated in cell cycle control, was chosen for verification. Down-regulation of CDK6 and Cyclin D1 in Tca8113 transfected with miR-9 mimics indicate that the complex formed by both proteins may be the effector of the antiproliferative function of miR-9 in OSCCs.
Materials and methods
Patients
Twenty-one OSCC patients were recruited to this study. Patient records were anonymized and de-identified before analysis. Ten pairs of matched samples containing tumour tissues and adjacent normal tissues for each patients were obtained via surgical excision, stored at −80 °C following formalin fixation and paraffin embedding. Informed consents from OSCC patients were obtained and they study plan was approved by The Scientific Ethical Committee of Tongji Medical College.
Cell culture and transfection
Human tongue squamous cell carcinoma cell line Tca8113 was obtained from ATCC. Cells were cultured at 37 °C in 5% CO2 in DEMEM supplemented with 10% foetal bovine serum (FBS; Invitrogen, Waltham, MA, USA). Cells were then seeded onto 96-well plates and grown to about 80–90% confluence. The morphology of cultures were evaluated on daily basis by phase contrast microscopy. Scrambled control or miR-9 mimics (ThermoFisher, Ambion, Waltham, MA, USA) were introduced into Tca8113 using Lipofectamine RNAi Max (ThermoFisher) for 6 h. All experiments were done in triplicate.
Quantitative RT-PCR
Extraction of total RNA from Tca8113 was done with TRIzol Reagent (Invitrogen), the quality of which was confirmed. Taqman MicroRNA Reverse Transcription Kit (Applied Biosystems, Waltham, MA, USA) was used to synthesize cDNA from 10 ng total RNA. The expression of miRNAs or mRNA (CDK6, CCND1 and MYC) was quantified by RT-PCR using 7500 Fast Real-Time PCR System (Applied Biosystems), which was then normalized to GAPDH.
Cell viability assay
Transfected cells were plated in 96-well plates (2 × 10³ cells/well). Three days later, cells were exposed to increasing concentrations of oxaliplatin (Sigma, St. Louis, MO, USA) for 72 h, followed by MTT assay to measure the cell counts. Briefly, MTT reagent was added into each well and incubate for 4 h. After removal of MTT mixture, dimethyl sulfoxide was added to each well and incubated at a shaker for 10 min. Absorbance under 570 nm was measured with a microplate reader, subtracted by background absorbance of the medium in the absence of cells.
Western blot
The total protein was extracted from Tca8113. The protein concentration was determined with BCA protein assay kit. The samples were separated on denaturing 10% SDS-polyacrylamide gel and transferred to a nitrocellulose membrane. The membrane was blocked with Tris buffered saline containing 5% BSA at room temperature for 0.5 h, followed by incubation with primary antibody (1:1000) overnight at 4 °C. Then secondary antibody (1:5000) was incubated at room temperature for 1 h. The signal detection was performed by using the chemiluminescence system.
Cell cycle analysis
Cells were pulsed with 10 μM BrdU for 1 h and trypsinized, centrifuged, washed twice with PBS and fixed in 70% cold ethanol. After denatured with HCL and Triton X for 20 min, the cells were stained with anti-BrdU FITC and propidium iodide was performed using anti-BrdU FITC antibody. Nuclei were stained with propidium iodide. Flow cytometry was then employed to analyse the DNA content of cells.
Transwell invasion assay
The Transwell invasion assay was performed to evaluate cell invasion ability. Filters were washed with serum-free DMEM, and placed into a 24-well plate. The lower chambers contained DMEM with 10% FBS. Approximately 3 × 10⁴ cells were resuspended in 200 μl DMEM with 0.1% BSA. Plates were then incubated at 37 °C in 5% CO2. After 20 h, the cells that penetrated through the membranes were fixed with methanol and stained with crystal violet. Images of six randomly selected fields of view were captured, and the cells were counted.
Statistical analyses
Each assay was performed triplicate, and all values were expressed as The statistical significance of differences between groups was evaluated by one-way analysis of variance (ANOVA) and Fishers least significant difference (LSD). p < .05 indicated a statistically significant difference.
Results
miR-9 is down-regulated in OSCCs
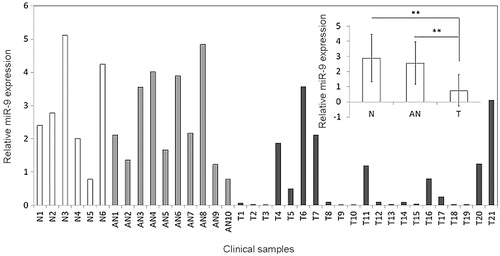
To investigate whether miR-9 is abnormally expressed in OSCC tissues, RT-qPCR was performed to measure the expression of miR-7 in OSCC tissue and matched adjacent normal tissues. Twenty-one patients were recruited, and 10 matched samples were obtained via surgical excision. Ajacent normal tissues have significantly higher miR-9 expression than tumour tissues (p = .001, paired t-test, ). In addition, we analysed the expression levels of miR-9 in 6 healthy individuals, detecting the expression in the oral epithelial cells. An extremely significant difference in miR-9 expression between normal tissue (peritumour normal tissue and normal tissues from healthy individuals combined) and tumour tissue was found (p < .001, Welch two sample t-test). These results suggest that miR-9 is under regulated in OSCC cells.
Figure 1. MiR-9 is down-regulated in OSCCs. Expression level of miR-9 in each individual case of OSCCs, adjacent normal tissues and normal mucosa tissues was evaluated using RT-qPCR. Small nuclear RNA (snRNA) U6 was used as an internal control. Data are presented as mean ± SD (insert). Details are described in the Materials and methods. T: OSCC tissues; AN: adjacent normal tissues; N: normal mucosa tissues; **p < .01.
miR-9 inhibits cell growth, migration and colony formation of Tca8113
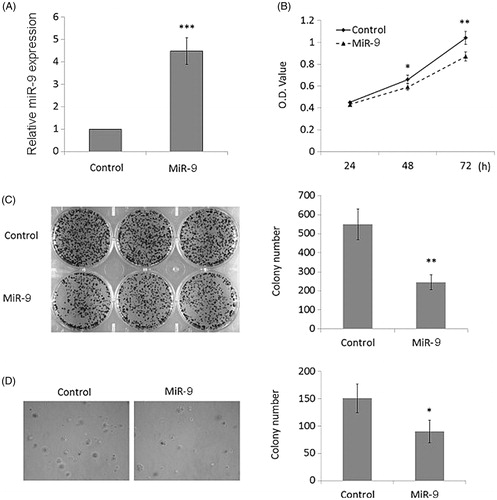
Downregulated as is miR-9 in OSCC cells, its effect on tumorigenesis and development of cancer remain elusive. To address this, a miR-9 transfected with miR-9 mimics was constructed and transduced to Tca8113, a highly malignant OSCC cell line. miR-9 was overexpressed in Tca8113 (). Three days after transfection of miR-9 mimics, Tca8113 presented reduction in proliferation (). In addition, plate colony formation assays were performed to assess the role of miR-9 in cell proliferation in vitro. Consequently, Tca8113 transduced with miR-9 expressing vector showed decreased colony formation (p < .01, ). To further investigate whether miR-9 suppresses the migration potential of OSCC, anchorage independent growth assays were also performed. Tca8113 overexpressing miR-9 exhibits significantly reduced number of colonies, indicating that elevated expression of miR-9 mitigates the potential of migration (p < .05, ).
Figure 2. MiR-9 inhibits OSCC cell growth. (A) Restoration of MiR-9 expression in Tca8113 cells was evidenced by RT-qPCR. SnRNA U6 was used as a normalized control. ***p < .001. (B) MiR-9 significantly inhibited cell proliferation in Tca8113 cells. *p < .05; **p < .01. The effect of miR-9 on cell growth was further confirmed by colony formation (C) and anchorage independent growth assays (D). Left panel showed the representative image of colony formation in Tca8113 cells transfected with miR-9 mimics and miRNA control. Quantitative analysis of colony numbers is shown in the right panel. Details are described in the “Materials and methods”. Data are presented as mean ± SD of values from three different assays. *p < .05; **p < .01.
miR-9 induces OSCC cell cycle arrest
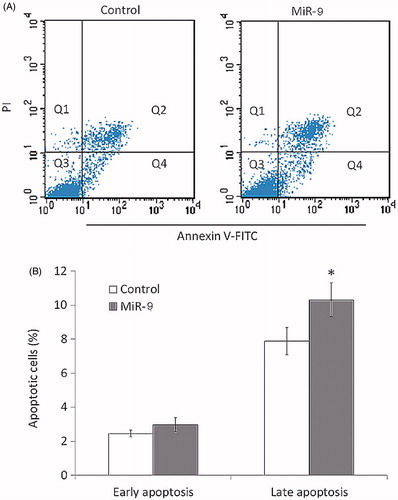
Reduction in number of cells and colonies can result from cell cycle arrest, attenuated cell activities and promoted apoptosis. To detect the effect of miR-9 on cell cycle and apoptosis, we performed flow cytometry to examine the DNA content of cells which signifies the cell cycle per se. Compared with control, Tca8113 cells overexpressing miR-9 showed decreased accumulation in S phase, and elevated accumulation in G0/G1 phase, indicating that G1/S arrest contributes to mitigated cell cycle (p < .05, ). In addition, Annexin V-FITC flow cytometry was conducted to determine the percentage of cells undergoing apoptosis in Tca8113 transfected with miR-9 mimics and control. The cell count of late apoptotic cells of Tca8113 transfected with miR-9 mimics was significantly higher than control (p < .05, ), so was the cell count of early apoptotic cells, though not statistically significant. These results suggested that overexpression of miR-9 promotes cell apoptosis of Tca8113.
Figure 3. MiR-9 induces OSCC cell cycle arrest. Tca8113 cells were transiently transfected with miR-9 mimics and miRNA control. After 72 h post-transfection, DNA content was measured by flow cytometry to determine cell cycle fractions. Representative flow cytometric histograms of cells transfected with miR-9 mimics and miRNA control from three independent experiments are shown in panel A. The fraction of cells in each cell cycle phase is indicated in panel B. PI: propidium iodide; *p < .05.
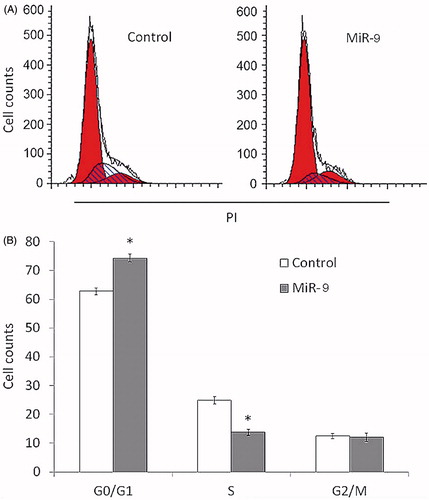
Figure 4. MiR-9 induces OSCC cell apoptosis. Cell apoptosis is measured by flow cytometry analysis of Annexin V-FITC double-labelled Tca8113 cells transfected with miR-9 mimics and miRNA control. (A) Flow cytometry profile represents Annexin V-FITC staining in x axis and propidium iodide (PI) in y axis. Dual staining of cells with Annexin V-FITC and PI enabled categorization of cells into four regions. Region Q1 shows the necrotic cells, Q2 shows the late apoptotic cells, Q3 shows the live cells, and Q4 shows the early apoptotic cells. (B) The experiment was repeated three times and data represent the average of the early apoptotic and late apoptotic cells. *p < .05.
miR-9 inhibits OSCC cell invasion
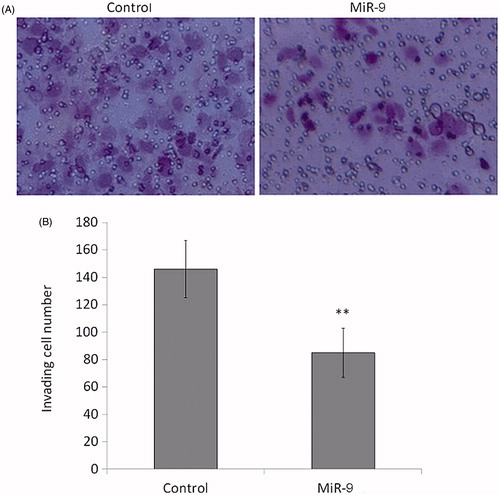
Invasion is the initial stage from which the cancer develops. It involves the motile cells passing through the basement membrane and extracellular matrix, implicating in lymphatic or vascular circulation and penetrating to intravasation. This event is of primary importance since it confers the possibility of cancer metastasis. To assess the effect of miR-9 overexpression in OSCC, invasion assays with matrigel-coated millicell chambers were conducted. Compared with control, miR-9 mimic transfectant Tca8113 showed 41% reduction in cell counts penetrating through the transwell membrane (p < .01, ), suggesting that miR-9 could inhibit cell invasion of Tca8113.
Figure 5. MiR-9 inhibits OSCC cell invasion. Cells transfected with miR-9 mimics and miRNA control were starved overnight and then seeded in the Transwell chambers coated with Matrigel for invasion assay. Following a 24 h-culture, non-invading cells in the upper chamber were removed and invading cells were stained and calculated in four microscopic fields per sample. Details are described in the “Materials and methods”. Shown are representative images of invading cells (A). The bar graphs (B), corresponding to upper panels, show mean ± SD of the numbers of invading cells from three independent experiments. **p < .01.
CDK6 is a functional target of miR-9
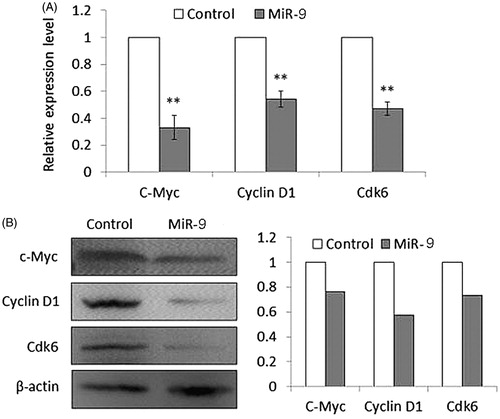
To identify functional target of miR-9, TargetScan analysis was performed (http://www.targetscan.org/vert_71/). Among the top 100 putative candidate targets, we noticed that Cyclin-dependent kinase 6 (CDK6) which ranked 61, is a key player in cell cycle progression. The 3′UTR of CDK6 contains five highly conserved miR-9 binding sites or miRNA responsive elements. Given that CDK6 has been implicated in G1 phase progression and G1/S transition, we postulate that miR-9 may exert the anti-proliferative effect via antagonizing CDK6. To assess the effect of miR-9 on CDK6, as well as other critical components involved in cell cycle regulation, we measure the transcriptional and protein level of CDK6, CCND1 and MYC, all of which are critical regulators of cell proliferation [Citation18–20]. As expected, these three molecules were downregulated in Tca8113 cells transfecting with miR-9 mimics, at mRNA and protein level (p < .05, ).
Figure 6. MiR-9 inhibits the expression of c-Myc, Cyclin D1, and Cdk6 in Tca8113 cells. Cells transfected with miR-9 mimics and miRNA control were starved overnight and harvested. (A) Total RNA was isolated and RT-qPCR was performed to evaluate the expression of c-Myc, Cyclin D1, and Cdk6. Details are described in the “Materials and methods”. **p < .01. (B) Cell lysates were collected and subjected to Western blotting assays. The biological functions of miR-9 in Tca8113 cells were determined by blotting c-Myc and its downstream target, cyclin D1, as well as Cdk6. β-actin was used for loading control of Western blotting. Shown in the right portion of the panel is a quantitative illustration of expression of the indicated proteins using densitometry to measure the density of the corresponding bands on Western blot shown in the left portion of the panel.
Discussion
Although strides have been made in developing therapies for cancers, the overall survival rate of OSCC has remained undesirable. Thus, a new paradigm in researching new biomarkers for diagnosis and therapeutic strategies would be entailed. Recent years have witnessed the tremendous growth in omic data, which were generated to screen proper biomarkers in cancer [Citation21,Citation22]. As the functional network is continuously improved, miRNAs emerge as a promising subset of biological molecules. The regulatory role of miRNAs have been characterized in multiple studies investigating tumorigenesis and cancer development. Though miR-9 has been reported in a bunch of cancer researches, the inherent heterogeneity of cancer necessitates cancer-specific investigation of the function of miR-9. A recent study showed that miR-9 is up-regulated in breast cancer via targeting CDH1, by which promotes cell motility and invasiveness [Citation23]. Overexpression of miR-9 in primary breast cancer cells endowed those cells metastatic ability, whereas impaired miR-9 expression by “miRNA sponge” in metastatic cells perturbed the malignant development. In hepatocellular carcinoma (HCC), the content of miR-9–3p was in inverse correlation with expression of TAZ, an end activator of Hippo pathway that is associated with worse prognostic outcome in HCC [Citation24]. Similarly, miR-9 protein levels was demonstrated in inverse correlation with CDX2, the ectopic expression of which contributes to the development of intestinal metaplasia in stomach and gastric cancers [Citation25]. In contrast, elevated expression in Hodgkin’s lymphoma cells, primary brain cancers and some types of gastric cancers were also noted [Citation26–28]. In the present study, we took the stance that identification of functional pathways that are responsible for miR-9 regulation is of vital importance in revealing OSCC tumorigenesis and cancer development. Firstly, we detected aberrant expression of miR-9 in OSCC patients, and employed miRNA mimics to overexpress it in highly malignant OSCC cell line Tca8113. We observed that the cell proliferation was diminished, along with the metastatic potential and ability to form colonies, suggesting that miR-9 could suppress cancer development in vitro. To further investigate at which stage of cell cycle does miR-9 exert inhibitory effects, flow cytometry was conducted and the accumulation of G0/G1 phase and reduction in cell count at S phase indicate that miR-9 overexpression could hamper G1/S transition.
Given miRNAs inhibit transcription by partial or entire degradation of mRNAs of target genes, identification of the targets is important for elucidating the role of miR-9 in OSCCs. To this end, TargetScan V7.1 was adopted to analyse the potential matched sequence and predict candidate targets. As the G0/G1 was confirmed to be suppressed by miR-9 and CDK6 is highly implicated in cell cycle control [Citation29], we predicted CDK6 among the top 100 targets is the most probable candidate. Subsequent RT-qPCR and western blot demonstrated that miR-9 regulated CDK6 in OSCC cells.
Cyclin-dependent kinase family is a cluster of genes that function in cell-cycle progression: transcriptional regulation, DNA damage repair, stem-cell self-renewal, metabolism, neuronal function, etc. [Citation30]. There are over 20 members in the family of cyclin-dependent kinases (CDKs), the most studied of which are CDK4 and CDK6 that regulate exit from G1 phase [Citation31]. A plethora of evidence reported them as cancer drivers that initiate the first stage in the hallmarks of cancer [Citation32–36]. Recently, the role of CDK4 and CDK6 have been recognized as hub in the orchestration network of cellular signalling pathways that result in development of tumours [Citation37]. To date, considerable endeavours have been dedicated to developing CDK4/6 inhibitors [Citation33,Citation38]. Palbociclib developed by Pfizer was designed to treat metastatic breast cancer.
CDK6 is associated with cyclin D1 that they form complexes which activate signalling pathways involved in G1/S transition [Citation39–42]. The retinoblastoma (Rb) protein family members are downstream effectors in CDK4/6-cyclin D signalling pathway, which, when phosphorylated by the latter, could unravel inhibition exerted on E2F transcription factors [Citation37,Citation43,Citation44]. On phosphorylation of Rb by CDK4/6-cyclin D, repressing complexes that previously recruited by unphosphorylated Rb were dissociated from the chromatin, which turns the chromatin from a compact form to a more accessible form that enables E2F transcription factors to activate genes that are associated with cell proliferation [Citation37,Citation44–47]. For instance, cyclin E originally binds to CDK2 during the late G1 phase, is activated to phosphorylate Rb on other sites, which produces an enhanced circle that perpetuate the progression of cells into S phase [Citation48,Citation49]. Although genetic studies haven’t discovered link of mutations in CDK6 to human or mice neoplasm, it aberrant expression has been noted in leukaemia and lymphoma [Citation50–53]. In the present study, we demonstrated that miR-9 overexpression resulted in down-regulation of both CDK6 and Cyclin D1, indicating that the signalling pathway encompassing both proteins may explain the inhibitory effect of miR-9 on cell proliferation, migration and invasion.
In summary, we observed down-regulation of miR-9 in OSCC patients, and impaired cell growth in miR-9 mimics transfectant Tca8113 cell line, which was revealed in detailed by flow cytometry that the G1/S transition was deterred. The inhibitory effect was also found in metastasis and colony formation. Target prediction yields plenty of candidates, among which CDK6 was chosen for verification as it has been highly implicated in cell cycle control. Down-regulation of CDK6 and Cyclin D1 in Tca8113 transfected with miR-9 mimics indicate that the complex formed by both proteins may be the effector of the antiproliferative function of miR-9 in OSCCs. Considering small molecules are developed to target CDK4/6, our finding may provide valuable scientific evidence for research and development of therapies and diagnostic methodology in OSCCs.
Funding
This work is supported by The Three-year Planning for Strengthening the Construction of Public Health System in Shanghai (2015–2017) (15GWZK0301) and 2015 Medical Science and Technology Development Program of Yancheng City (YK2015124) and 2016 Medical Science and Technology Development Program of Yancheng City (YK2016074).
References
- Codes CM, Information P, August R. International Classification of Diseases (ICD) for Oncology; 2012. [no volume].
- Yu T, Wang X, Gong R, et al. The expression profile of microRNAs in a model of 7,12-dimethyl-benz[a]anthrance-induced oral carcinogenesis in Syrian hamster. [Internet]. J Exp Clin Cancer Res. 2009;28:64.
- Petersen PE. The World Oral Health Report 2003 WHO Global Oral Health Programme [Internet]. Commun Dent Oral Epidemiol. 2003;31:3–23.
- Gombos K, Horváth R, Szele E, et al. MiRNA expression profiles of oral squamous cell carcinomas. Anticancer Res. 2013; 33:1511–1518.
- Argiris A, Karamouzis MV, Raben D, et al. Head and neck cancer. Lancet. 2008;371:1695–1709.
- Ro S, Park C, Young D, et al. Tissue-dependent paired expression of miRNAs. Nucleic Acids Res. 2007;35:5944–5953.
- Mallory AC, Vaucheret H. MicroRNAs: something important between the genes. Curr Opin Plant Biol. 2004;7:120–125.
- Garzon R, Calin GA, Croce CM. MicroRNAs in cancer. Annu Rev Med. 2009;60:167–179.
- Reyes ∼ Herrera PH, Ficarra E. One decade of development and evolution of MicroRNA target prediction algorithms. Genom Proteom Bioinform. 2012;10:254–263.
- Hayes J, Peruzzi PP, Lawler S. MicroRNAs in cancer: biomarkers, functions and therapy. Trends Mol Med. 2014;20:460–469.
- Calin GA, Croce CM. MicroRNA signatures in human cancers. Nat Rev Cancer. 2006;6:857.
- Li J, Huang H, Sun L, et al. MiR-21 indicates poor prognosis in tongue squamous cell carcinomas as an apoptosis inhibitor. Clin Cancer Res. 2009;15:3998–4008.
- Hedbäck N, Jensen DH, Specht L, et al. MiR-21 expression in the tumor stroma of oral squamous cell carcinoma: an independent biomarker of disease free survival. PLoS One. 2014;9:e95193.
- Wong T, Liu X, Ho AC, et al. Identification of pyruvate kinase type M2 as potential oncoprotein in squamous cell carcinoma of tongue through microRNA profiling. Int J Cancer. 2008; 123:251–257.
- Gao F, Zhao Z, Zhao W, et al. miR-9 modulates the expression of interferon-regulated genes and MHC class I molecules in human nasopharyngeal carcinoma cells. Biochem Biophys Res Commun. 2013;431:610–616.
- Bandres E, Agirre X, Bitarte N, et al. Epigenetic regulation of microRNA expression in colorectal cancer. Int J Cancer. 2009;125:2737–2743.
- Liu S, Kumar SM, Lu H, et al. MicroRNA-9 up-regulates E-cadherin through inhibition of NF-κB1-Snail1 pathway in melanoma. J Pathol. 2012;226:61–72.
- Tang S-W, Chang W-H, Su Y-C, et al. MYC pathway is activated in clear cell renal cell carcinoma and essential for proliferation of clear cell renal cell carcinoma cells. [Internet]. Cancer Lett. 2009;273:35–43.
- Sommer G, Dittmann J, Kuehnert J, et al. The RNA-binding protein La contributes to cell proliferation and CCND1 expression. Oncogene. 2011;30:434–444.
- Lucas JJ, Domenico J, Gelfand EW. Cyclin-dependent kinase 6 inhibits proliferation of human mammary epithelial cells. Mol Cancer Res. 2004;2:105–114.
- Tieri P, Nardini C, Dent JE. Multi-omic data integration; 2015.
- Liotta LA, Petricoin EF. Omics and cancer biomarkers: link to the biological truth or bear the consequences. Cancer Epidemiol Biomarkers Prev. 2012;21:1229–1235.
- Ma L, Young J, Prabhala H, et al. miR-9, a MYC/MYCN-activated microRNA, regulates E-cadherin and cancer metastasis [Internet]. Nat Cell Biol. 2010;12:36–38.
- Higashi T, Hayashi H, Ishimoto T, et al. miR-9-3p plays a tumour-suppressor role by targeting TAZ (WWTR1) in hepatocellular carcinoma cells. Br J Cancer. 2015;113:252–258.
- Rotkrua P, Akiyama Y, Hashimoto Y, et al. MiR-9 downregulates CDX2 expression in gastric cancer cells. Int J Cancer. 2011;129:2611–2620.
- Omura N, Li C-P, Li A, et al. Cancer biology & therapy genome-wide profiling at methylated promoters in pancreatic adenocarcinoma. Cancer BiolTher Cancer Biol Ther. 2008;7:1146–1156.
- Luo H, Zhang H, Zhang Z, et al. Down-regulated miR-9 and miR-433 in human gastric carcinoma. J Exp Clin Cancer Res. 2009;28:82.
- Laios A, O'Toole S, Flavin R, et al. Potential role of miR-9 and miR-223 in recurrent ovarian cancer. Mol Cancer. 2008;7:35.
- Tigan A-S, Bellutti F, Kollmann K, et al. CDK6-a review of the past and a glimpse into the future: from cell-cycle control to transcriptional regulation. Oncogene. 2016;35:1–9.
- Lim S, Kaldis P. Cdks, cyclins and CKIs: roles beyond cell cycle regulation. Development. 2013;140:3079–3093.
- Malumbres M, Harlow E, Hunt T, et al. Cyclin-dependent kinases: a family portrait. Nat Cell Biol. 2009;11:1275–1276.
- Malumbres M, Barbacid M. To cycle or not to cycle: a critical decision in cancer. Nat Rev Cancer. 2001;1:222.
- Brower V. Cell cycle inhibitors make progress. J Natl Cancer Inst. 2014;106:101–103.
- Malumbres M, Barbacid M. Cell cycle, CDKs and cancer: a changing paradigm. Nat Rev Cancer. 2009;9:153–166.
- Dalmay T, Edwards DR. MicroRNAs and the hallmarks of cancer. Oncogene. 2006;25:6170–6175.
- Hanahan D, Weinberg RA. Hallmarks of cancer: the next generation. Cell. 2011;144:646–674.
- Choi Y, Anders L. Signaling through cyclin D-dependent kinases. Oncogene. 2014;33:1890–1903.
- Aleem E, Arceci RJ. Targeting cell cycle regulators in hematologic malignancies. Front Cell Dev Biol. 2015;3:16
- Donjerkovic D, Scott DW. Regulation of the G1 phase of the mammalian cell cycle. Cell Res. 2000;10:1–16.
- Saab R, Bills JL, Miceli AP, et al. Pharmacologic inhibition of cyclin-dependent kinase 4/6 activity arrests proliferation in myoblasts and rhabdomyosarcoma-derived cells. Mol Cancer Ther. 2006;5:1299–1308.
- Kollmann K, Sexl V. CDK6 and p16INK4A in lymphoid malignancies. Oncotarget. 2013;4:1858–1859.
- Morgan DO. Cyclin-dependent kinases: engines, clocks, and microprocessors. Ann Rev Cell Dev Biol. 2003;13:261–291.
- Kato J, Matsushime H, Hiebert SW, et al. Direct binding of cyclin D to the retinoblastoma gene product (pRb) and pRb phosphorylation by the cyclin D-dependent kinase CDk4. Genes Dev. 1993;7:331–342.
- Harbour JW, Luo RX, Santi AD, et al. Cdk phosphorylation triggers sequential intramolecular interactions that progressively block Rb functions as cells move through G1. Cell. 1999;98:859–869.
- Rubin SM, Gall A, Zheng N, et al. Structure of the Rb C-terminal domain bound to E2F1-DP1: a mechanism for phosphorylation-induced E2F release. Cell. 2005;123:1093–1106.
- Burke JR, Deshong AJ, Pelton JG, et al. Phosphorylation-induced conformational changes in the retinoblastoma protein inhibit E2F transactivation domain binding. J Biol Chem. 2010;285:16286–16293.
- Burke JR, Liban TJ, Restrepo T, et al. Multiple mechanisms for E2F binding inhibition by phosphorylation of the retinoblastoma protein C-terminal domain. J Mol Biol. 2014;426:245–255.
- Lapenna S, Giordano A. Cell cycle kinases as therapeutic targets for cancer. Nat Rev Drug Discov. 2009;8:547–566.
- Dyson NJ. The regulation of E2F by pRB-family proteins. Genes Dev. 1998;12:2245–2262.
- Chilosi M, Doglioni C, Yan Z, et al. Differential expression of cyclin-dependent kinase 6 in cortical thymocytes and T-cell lymphoblastic lymphoma/leukemia. Am J Pathol. 1998;152:209–217.
- Lien H, Lin C, Huang PC, et al. Expression of cyclin-dependent kinase 6 (cdk6) and frequent loss of CD44 in nasal-nasopharyngeal NK/T-cell lymphomas: comparison with CD56-negative peripheral T-cell lymphomas. Lab Invest. 2000;80:893–900.
- Schwartz R, Engel I, Fallahi-Sichani M, et al. Gene expression patterns define novel roles for E47 in cell cycle progression, cytokine-mediated signaling, and T lineage development. Proc Natl Acad Sci USA. 2006;103:9976–9981.
- Nagel S, Leich E, Quentmeier H, et al. Amplification at 7q22 targets cyclin-dependent kinase 6 in T-cell lymphoma. Leukemia. 2008;22:387–392.