
Abstract
X-ray computed tomography (CT) requires an optimal compromise between image quality and patient dose. While high image quality is an important requirement in CT, the radiation dose must be kept minimal to protect the patients from ionizing radiation-associated risks. The use of probes based on gold nanoparticles (AuNPs) along with active targeting ligands for specific recognition of cancer cells may be one of the balanced solutions. Herein, we report the effect of folic acid (FA)-modified AuNP as a targeted nanoprobe on the contrast enhancement of CT images as well as its potential for patient dose reduction. For this purpose, nasopharyngeal KB cancer cells overexpressing FA receptors were incubated with AuNPs with and without FA modification and imaged in a CT scanner with the following X-ray tube parameters: peak tube voltage of 130 KVp, and tube current–time products of 60, 90, 120, 160 and 250 mAs. Moreover, in order to estimate the radiation dose to which the patient was exposed during a head CT protocol, the CT dose index (CTDI) value was measured by an X-ray electrometer by changing the tube current–time product. Raising the tube current–time product from 60 to 250 mAs significantly increased the absorbed dose from 18 mGy to 75 mGy. This increase was not associated with a significant enhancement of the image quality of the KB cells. However, an obvious increase in image brightness and CT signal intensity (quantified by Hounsfield units [HU]) were observed in cells exposed to nanoparticles without any increase in the mAs product or radiation dose. Under the same Au concentration, KB cells exposed to FA-modified AuNPs had significantly higher HU and brighter CT images than those of the cells exposed to AuNPs without FA modification. In conclusion, FA-modified AuNP can be considered as a targeted CT nanoprobe with the potential for dose reduction by keeping the required mAs product as low as possible while enhancing image contrast.
Introduction
Molecular imaging (MI) provides the means for visual representation, characterization and quantification of biological processes and has recently attracted a great deal of attention for expanding the ability of medical imaging, particularly in the field of cancer diagnosis. Among many different MI technologies, X-ray computed tomography (CT) is the most commonly utilized diagnostic tool in clinics and it offers great advantages over other imaging techniques such as superior spatial and density resolution, ease of availability and cost-effectiveness. However, some serious limitations encountered by CT imaging in terms of sensitivity, specificity, spatial and temporal resolution and patient dose issues need to be addressed. Utilizing suitable contrast-enhancement agents with high X-ray absorption capability is a possible pathway to improve the effectiveness of CT imaging. The use of iodine-based compounds as the most commonly used CT contrast agents suffers the drawbacks of short blood circulation lifetime, renal toxicity and non-selectivity in tumour targeting, which hampers their clinical use [Citation1–5].
Recent attempts in the area of molecular imaging advocate the implementation of nanotechnology to increase the efficiency of cancer diagnosis. The use of nanoprobes as potential contrast-enhancement agents in combination with various molecular imaging technologies can offer great promises to break the detection limits of cancer diagnosis [Citation6–8]. In comparison to iodine-based compounds, gold nanoparticles (AuNPs) are preferred as their higher atomic number and electron density possess a stronger X-ray absorption coefficient, endowing them with the main prerequisites to be employed as potential CT contrast agents [Citation9]. This attribute, along with their bio-inert and non-toxic properties, facile preparation, fabrication tunability and easy surface functionalization render the AuNPs as ideal candidates for CT contrast agents with superior performance over iodine-based compounds [Citation10,Citation11]. Moreover, through passive targeting, AuNPs can diffuse rapidly via the disorganized and leaky vasculatures of the tumour and efficiently permeate throughout the tumour matrix, a process known as the enhanced permeation and retention (EPR) effect. The surface functionalization of AuNPs with proper ligands that are identified by cancer cell surface receptors can also provide an active targeting strategy, leading to the enhanced uptake and internalization of nanoparticles through receptor-mediated endocytosis (RME). Taken together, AuNPs with preferential accumulation within the tumour could provide efficient and targeted CT imaging, thereby enhancing the specificity and sensitivity of imaging [Citation1,Citation12,Citation13].
The vitamin folic acid (FA) is a necessary ingredient for cell proliferation. Cancer cells due to their rapid division rate generally indicate a higher level of FA surface receptor expression than normal cells [Citation14,Citation15]. Thus, the FA modification of AuNPs endows them with a unique capability to particularly target cancer cells [Citation16–19]. Specific recognition of cancer cells provided by FA targeting, and then, enhanced uptake and internalization of AuNPs in association with the high X-ray absorption property of AuNPs may constitute a targeted molecular CT imaging strategy [Citation20,Citation21].
A tremendous increase in the clinical usage of CT in the past decade is associated with the increased individual and population doses, and it raises concerns regarding the risks of using ionizing radiation [Citation22]. Currently, the radiation dose in a CT scan contributes up to 70% of the total dose received by patients undergoing different X-ray imaging examinations [Citation23]. Consequently, extensive efforts are being made to find a competent strategy for dose reduction in CT examinations while maintaining acceptable image quality. This is to ensure that the ALARA principle established by the International Commission on Radiological Protection (ICRP) is followed which states that the radiation dose should be kept to As Low As Reasonably Achievable [Citation24].
We herein aim to investigate the effect of FA-modified AuNPs on optimizing CT imaging in terms of image quality and patient dose. For this purpose, nasopharyngeal KB cancer cells overexpressing FA receptors treated with FA-AuNPs were imaged and the CT signal intensity quantified by Hounsfield units (HU) was measured. Moreover, the CT dose index (CTDI) value as a measure of the radiation dose was obtained in a CT head phantom by elevating the tube current time product (mAs) as a general approach for improving the image quality. Finally, the effects of elevating the mAs product and existence of FA-AuNPs on improving the image quality were studied to assess the possible function of FA-AuNPs for dose reduction in the process of CT imaging.
Material and methods
Material
FA-AuNPs (NB-GNP-FA) were prepared in R&D department of Nanobon Company (Tehran, Iran) and a brief description of the synthesis will be presented in the next section. Fetal bovin serum (FBS) was purchased from BioSera Ltd. (Ringmer, United Kingdom). Dulbecco’s modification of Eagle’s medium (DMEM) and MTT (3-[4,5-dimethylthiazol-2-yl]-2,5-diphenyltetrazolium bromide) were purchased from GIBCO (Invitrogen, Germany). Trypsin- ethylenediaminetetraacetic acid (EDTA), dimethyl sulphoxide (DMSO), penicillin–streptomycin solution and folic acid, all were purchased from Sigma–Aldrich Corp. (St Louis, MO).
Synthesis of folic acid-conjugated gold nanoparticles (FA-AuNPs)
FA-AuNPs were prepared according to the method recently reported by Li et al and Neshastehriz et al [Citation25,Citation26]. Briefly, to obtain 100 ml of F-AuNPs, an aqueous solution of HAuCl4 (Au; 150 ppm) and trinatrium citrate (150 mg) was heated to 80 °C while vigorously stirred for about two hours until the colour of the solution turned to deep red. After cooling the solution to room temperature, a solution of FA (150 mg in 5 ml ethanol) was added and the resultant solution was sonicated for 10 min. The formation of FA-AuNPs was confirmed by spectrophotometer and Fourier transform infrared spectroscopy (FTIR).
Characterization of nanoparticles
Particles size and morphology determination
The morphological characteristics of nanoparticles were analysed by a Zeiss LEO 906 transmission electron microscope (TEM). For this purpose, nanoparticles were suspended in distilled water and sonicated for 10 min. A small drop of suspension was deposited onto a carbon-coated copper grid and allowed to be evaporated. Then, the perfectly dried grid was observed under transmission electron microscope at 120 KV. Furthermore, size distribution and effective hydrodynamic size of nanoparticles were determined by dynamic laser light scattering (DLS) using a Malvern Zetasizer, NANO ZS (Malvern Instruments Limited, UK).
Surface charge
Zeta potential is an indicator of surface charge, which determines particle stability in dispersion. We determined zeta potential of nanoparticles using a Malvern Zetasizer, NANO ZS (Malvern Instruments Limited, UK).
UV-visible absorption studies
UV–visible (UV–vis) absorption spectroscopic measurements were recorded on a single-beam UV–vis spectrometer, Agilent 8453, using quartz cells of 1 cm path length and DI water as the reference at room temperature.
Fourier transform infrared spectroscopy (FTIR) studies
Fourier transform infrared (FTIR) spectra were recorded by using a Shimadzu FT-IR 4300 instrument equipped with pressed KBr pellets in the wavenumber range 500 to 3600 cm−1 at room temperature.
Cell culture
Our experiments were conducted on KB cell line, derived from human mouth epidermal carcinoma. Cells were cultured as a monolayer in DMEM cell growth media with L-glutamine and NaHCO3 supplemented with 10% FBS, 100 units/ml penicillin and 100 μg/ml streptomycin and incubated in a humidified atmosphere containing 5% CO2 and 95% air at 37 °C.
Cytotoxicity effects of nanoparticles
To determine the cytotoxicity of AuNPs and FA-AuNPs towards KB cells, an MTT assay was performed. The MTT assay is a colorimetric method based on the reduction of the ratio of yellow tetrazolium dye salt to insoluble purple formazan that indicates the cytotoxicity level of a chemical. First, KB cells were seeded in 96-well cell culture plate at a density of 1 × 10⁴ cells per well and incubated for 24 h at 37 °C in a 5% CO2-saturated humidified atmosphere. The serial concentrations of AuNPs and FA-AuNPs (0–100 µg/ml in medium solution) were then prepared and added into each well. After 12-h incubation, 20 μl of MTT reagent was added to each well and the cells were further incubated for 4 h. Then, the MTT-containing medium was removed and replaced with formazan crystals dissolved in 10 μl of DMSO and the plates were kept in the dark at room temperature for 15 min. Finally, the plates were read immediately in a microplate reader (DYNEX MRX, USA) at a 570 nm wavelength and, thereby, the cell viability percentage was calculated.
CT imaging of cancer cells
KB cells were seeded in six-well cell culture plates at a density of 1 × 10⁶ cells per well and incubated for 24 h at 37 °C in a humidified 5% CO2 atmosphere. The serial concentrations of AuNPs and FA-AuNPs in medium solution ranged from 0 to 90 µg/ml were prepared and added into each well. After 12-h incubation, cells were washed three times with PBS to remove unloaded nanoparticles. Cells were then trypsinized, centrifuged and resuspended with 100 µL PBS and placed in 1.5-ml Eppendorf tubes. The remaining capacity of the tubes were filled with agar gel. Next, Eppendorf tubes containing cell suspensions were embedded in a self-designed scanning holder made of plexiglas and then scanned using a CT imaging system (Somatom Balance, Siemens Medical Sotions) with the following operation parameters:
Peak kilovoltage of 130 KVp; tube current–time products of 60, 90, 120, 160 and 250 mAs; Slice thickness of 1 mm and field of view of 199 mm ×100 mm.
The acquired CT images of the Eppendorf tubes were analysed by using RadiAnt DICOM Viewer 2.2.9 (32 bit) software (Medixant Company, Poland).
Dose measurement
CTDI value is the most common parameter for estimating radiation dose from a CT examination, developed by Shop et al. [Citation27]. In order to estimate the radiation dose by changing the tube current–time product in a head CT protocol, CTDI value was measured with ion chamber. To this end, a CT ion chamber (RTI Electronics, Mölndal, Sweden) was placed in the centre hole of a CT head phantom (16 cm in diameter and 15 cm in length) and connected to a chamber adaptor and chamber adaptor connected to black piranha (Piranha, RTI Electronics). The phantom was aligned to the centre of the gantry using positioning lasers. Axial scanning of the phantom was performed in all five embedded holes one by one, centre, 12 o’clock, 3 o’clock, 6 o’clock and then 9 o’clock positions under different tube current–time products, ranging from 60–250 mAs and fixed peak tube voltage of 130 KVp. Dosimetry information was stored on a Tablet running Ocean software (RTI Electronics).
Statistical analysis
Statistical analysis was performed by using SPSS software (version11). One-way analysis of variance (ANOVA) statistical method was used to evaluate the significance of the experimental data. A value of p < .05 was considered statistically significant.
Results
Characterization of the nanoparticles
TEM was performed to assess the morphological characteristics of FA-AuNPs. shows a typical TEM micrograph of the synthesized FA-AuNPs. The results suggest that the nanoparticles are well dispersed and appear to be spherical in shape with a size distribution of 10–30 nm. The hydrodynamic size and zeta potential of nanoparticles were measured using DLS and zeta potential analyzer, respectively. Obtained results are shown in . It was determined that hydrodynamic size of nanoparticles is 33.8 nm. Moreover, zeta potential of the synthesized FA-AuNPs was −12.5 mV, as shown in . shows the UV-visible absorption spectrum of FA-AuNPs. Accordingly, it may be found FA-AuNPs has three absorption peaks in the range of UV-visible wavelengths. By looking at the UV-Vis absorption spectrum of FA-AuNPs, we identified that FA-AuNPs absorption peaks are about 280 nm and 360 nm pertaining to folate conjugation and about 530 nm pertaining to AuNPs. shows FTIR spectrum of folic acid in which wavenumbers of 3418 and 3544 cm−1 correspond to stretching vibrations of amide and amine groups. Characteristic bands of C = O group are about 1694 and 1607 cm−1. FTIR spectrum of AuNPs stabilized by trisodium citrate is presented in . In this figure, the peaks at 2923, 1635 and 3442 cm−1 correspond to stretching vibration of CH, C = O and OH groups, respectively. A strong peak must be seen in in the range of 1690–1760 cm−1 for stretching vibration of C = O group while this peak is absent. The reason of this phenomenon may be pertained to some events occurred for carboxyl groups of citrate and coverage of AuNPs with citrate is an option. Finally, shows FTIR spectrum of FA-AuNPs in which peaks at 1693, 1638 and 1607 cm−1 correspond to the stretches of C = O groups and the peak at 3422 cm−1 correspond to OH group. With comparing , it may be inferred the absence of amine group peaks in is due to conjugation of amine groups of folic acid to AuNPs and this document shows that folic acid has been conjugated to AuNPs.
Figure 1. TEM image of the synthesized FA-AuNPs, suggesting that the nanoparticles are well dispersed and appear to be spherical in shape with a size distribution of 10–30 nm.
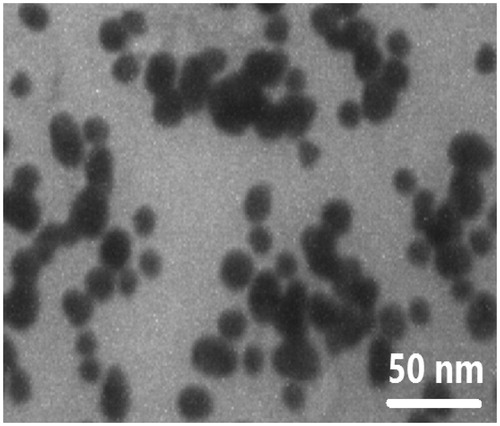
Figure 2. (a) Size distribution of the synthesized FA-AuNPs (peak: 33.8 nm). (b) Zeta potential distribution of the synthesized FA-AuNPs (peak: −12.5 mV).
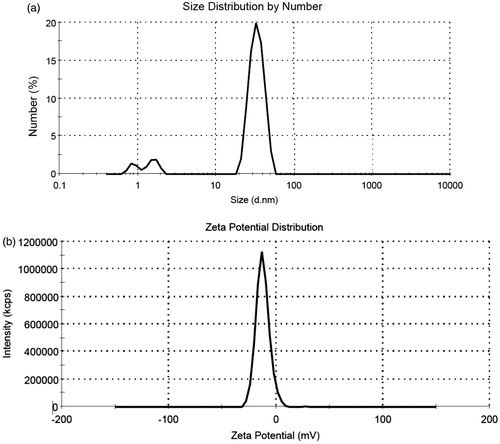
Figure 3. UV–visible spectrum of AuNPs with and without conjugation with folic acid [Reprinted with permission from Elsevier].
![Figure 3. UV–visible spectrum of AuNPs with and without conjugation with folic acid [Reprinted with permission from Elsevier].](/cms/asset/bda7d00b-8bdf-40e6-a23c-ada235403a1a/ianb_a_1408019_f0003_c.jpg)
Figure 4. FTIR spectra of folic acid, AuNPs stabilized with trisodium citrate and FA-AuNPs [Reprinted with permission from Elsevier].
![Figure 4. FTIR spectra of folic acid, AuNPs stabilized with trisodium citrate and FA-AuNPs [Reprinted with permission from Elsevier].](/cms/asset/076a8f69-1660-4f21-ae34-edc7a1f50321/ianb_a_1408019_f0004_c.jpg)
Cytotoxicity assay
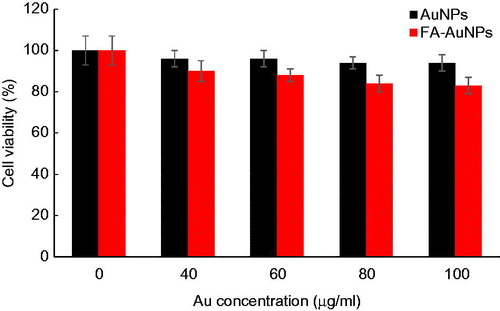
We investigated the cytotoxicity effects of the nanoparticles towards KB cells using an MTT colorimetric assay. shows the cell viability results for KB cells after 12-h incubation with AuNPs and FA-AuNPs at various concentrations ranging from 0 to 100 μg/ml. According to this figure, AuNPs do not exhibit apparent cytotoxicity even at the highest concentration of 100 μg/ml. The viability of the cells treated with AuNPs and FA-AuNPs at 100 μg/ml Au concentration were 94% and 83%, respectively, demonstrating an appropriate cytocompatibility level for the nanoparticles used in the present study.
Figure 5. The viability of KB cells after 12-h incubation with AuNPs and FA-AuNPs at different concentrations.
CT imaging of cancer cells
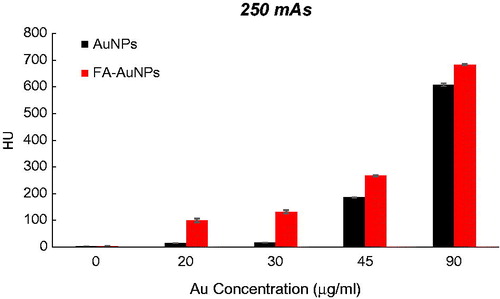
To explore the effect of the FA targeting of AuNPs on a CT contrast, KB cells were exposed to both targeted- and non-targeted nanoparticles with different Au concentrations (0, 20, 30, 45 and 90 µg/ml) and were imaged using a CT imaging system. The results of quantitative analysis of CT values at different tube current–time products (60, 90, 120, 160 and 250 mAs) are presented in . From the CT images of the tubes, it was obvious that the cells not exposed to nanoparticles were not detectable even at the highest mAs. However, the presence of nanoparticles increased the brightness of the CT images and the cells appeared as bright spots at the bottom of the Eppendorf tubes. Meanwhile, the brightness of the CT images increases with the increase of Au concentration. Since it is difficult to visually differentiate the brightness of the CT images, a quantitative analysis of the CT signal intensity as a function of Au concentration was performed. The quantitative analysis of the CT values further demonstrates the CT contrast-enhancement performance of the AuNPs. Accordingly, the CT values of KB cells treated with AuNPs (with or without FA modification) enhanced dramatically in comparison to the cells not exposed to nanoparticles. Moreover, the observed CT value enhancement in the presence of nanoparticles was strongly dependent on Au concentration, where a higher Au concentration caused the higher CT value enhancement. Importantly, under the given Au concentration, the cells exposed to FA-AuNPs exhibit significantly higher CT contrast enhancement than those of the cells exposed to non-targeted AuNPs. The CT value of the cells not exposed to nanoparticles was only 2.5 HU, whereas the cells treated with AuNPs and FA-AuNPs (Au concentration: 90 µg/ml) reached the higher CT values of 608 and 683 HU, respectively (at 130 KVp and 250 mAs). The minimum detectable concentration of non-targeted AuNPs in order to create a visible contrast in the CT images was 45 µg/ml. However, FA-AuNPs at the lower concentration of 20 µg/ml created enough increase in image brightness that could be distinguished by the human eye.
Figure 6. The CT values of KB cells treated with AuNPs and FA-AuNPs (12 h) at different concentrations (tube voltage of 130 kVp and tube current–time product of 60 mAs).
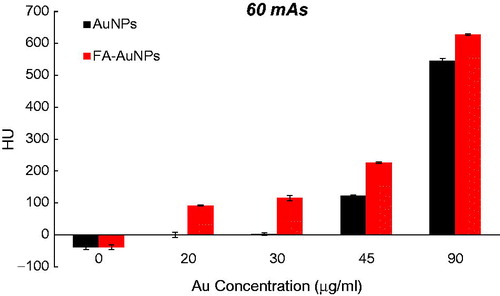
Figure 7. The CT values of KB cells treated with AuNPs and FA-AuNPs (12 h) at different concentrations (tube voltage of 130 kVp and tube current–time product of 90 mAs).
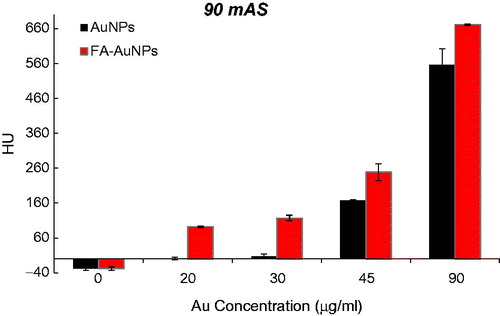
Figure 8. The CT values of KB cells treated with AuNPs and FA-AuNPs (12 h) at different concentrations (tube voltage of 130 kVp and tube current–time product of 120 mAs).
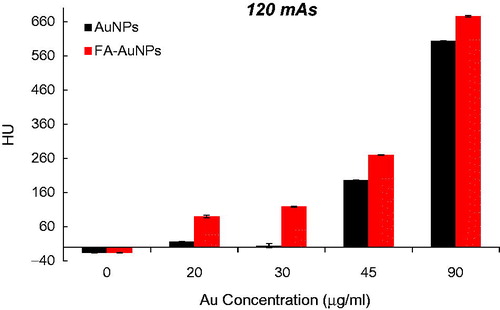
Figure 9. The CT values of KB cells treated with AuNPs and FA-AuNPs (12 h) at different concentrations (tube voltage of 130 kVp and tube current–time product of 160 mAs).
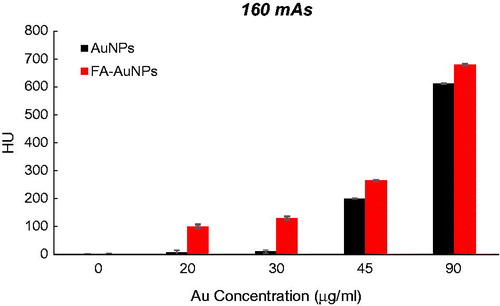
Figure 10. The CT values of KB cells treated with AuNPs and FA-AuNPs (12 h) at different concentrations (tube voltage of 130 kVp and tube current–time product of 250 mAs).
Dose measurement
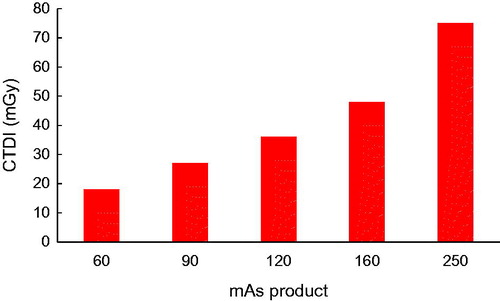
displays the dosimetry results of CT scanning of the head phantom at different mAs products and a fixed peak tube voltage of 130 KVp. As shown in this figure, elevating the mAs product significantly increases the values of the CTDI. Accordingly, elevating the tube current–time product from 60 to 250 mAs significantly increased the absorbed dose from 18 mGy to 75 mGy during a head CT protocol.
Figure 11. The CTDI values measured from the CT scanning of a head phantom at different mAs products and fixed peak tube voltage of 130 kVp.
Discussion
In the present study, we have synthesized FA-modified AuNPs and assessed their potential to be used as the nanoprobes in the targeted CT imaging of cancer cells. We selected AuNPs with a diameter ranged from 10 to 30 nm (as observed in ) according to the recent report of the intensive X-ray absorption of AuNPs at this range [Citation28,Citation29]. Dou et al. investigated the size-dependent contrast enhancement effect of AuNPs for CT imaging and found that within the size range of 3–50 nm, AuNPs sized around 15 nm show a superior CT contrast performance. Likewise, ∼15 nm AuNPs exhibited the greatest radiosensitizing effect for the enhancement of radiotherapy. Therefore, the selected AuNPs in the present study have the optimized size to be utilized as X-ray theranostic agents for the simultaneous enhancement of CT imaging and radiotherapy.
Understanding the physical rationale behind the interaction of X-ray with material can be helpful for developing suitable CT contrast agents. The photoelectric effect is the predominant mechanism of the interaction of X-ray with material at the kV energy level of clinical CT imaging, which is responsible for X-ray attenuation. The photoelectric absorption cross-section is strongly dependent on the atomic number (Z) of interacting material, which is proportional to Z4. As a consequence, high-Z materials represent a higher probability of emitting secondary radiations (e.g. Auger electrons and photoelectrons), causing an increased X-ray absorption. Accordingly, AuNPs, owing to their high atomic number (Z = 79) and electron density, have an intense X-ray attenuation coefficient, which renders them as elegant CT contrast agents [Citation30,Citation31].
Several reports have demonstrated the superior CT contrast performance of AuNPs compared to the routinely used CT contrast agents in clinic. Kim et al. demonstrated a 5.7-fold higher X-ray attenuation coefficient for polyethylene glycol (PEG)-coated AuNPs than a conventional iodine-based CT contrast agent (Ultravist). Indeed, 33 mg/ml of the PEG-AuNPs and 407.6 mg/ml of Ultravist (containing 189 mg iodine) resulted in an equivalent enhancement in the CT values [Citation32]. In another study, Peng et al. compared the CT contrast enhancement of AuNPs and Omnipaque, another conventional iodine-based CT contrast agent. Under the same concentration of 0.1 M, the X-ray attenuation of dendrimer-entrapped gold nanoparticles (Au DENPs) was found to be 30% higher than that of Omnipaque [Citation20].
The decoration of AuNPs with FA targeting moiety can further enhance the therapeutic and diagnostic applications of AuNPs [Citation33–35]. This is accomplished by the specific recognition of the FA receptors by FA conjugated NPs on cancer cell membranes, which accelerates the cellular internalization of AuNPs via RME, thus enhancing the intracellular content of AuNPs. Zhou et al. reported a targeted chemotherapy strategy for the efficient delivery of gold nanoclusters (AuNCs) carrying cisplatin prodrug and demonstrated an accelerated cellular internalization and enhanced tumour accumulation accompanied by the retention of the nanocarriers due to FA modification [Citation36]. Remarkable successes in improving radiotherapy effectiveness have also been provided by utilizing FA-modified AuNPs [Citation37]. Furthermore, in our previous works, we have demonstrated the positive impact of FA targeting on the increase in the photothermal therapy efficiency of AuNPs [Citation38,Citation39].
In the area of cancer diagnosis, the use of FA targeting has recently yielded a remarkable breakthrough. For example, in the recent report by Hu et al., multifunctional FA-targeted Fe3O4 @Au core/shell nanostars were developed for targeted magnetic resonance (MR) and CT imaging [Citation40]. Inductively coupled plasma-optical emission spectroscopy (ICP-OES) and TEM imaging were used to evaluate the targeting potential of the nanostars towards HeLa cells with high and low levels of FA receptors, known as HeLa-HFAR and HeLa-LFAR, respectively. Under the same Au concentration, the intracellular content of the nanostars in HeLa-HFAR cells was significantly higher than that in HeLa-LFAR cells. Due to existence of the magnetic core, the treatment of HeLa cancer cells with the nanostars decreased the MR signal intensity and the T2-weighted MR images became darker. However, the decrease in MR signal intensity for the HeLa-HFAR cells was more prominent than for the HeLa-LFAR cells. On the other hand, the CT images of the HeLa-HFAR cells demonstrated an increased brightness and superior CT contrast enhancement rather than the HeLa-LFAR cells, which are attributed to the greater cellular uptake of FA-modified nanostars in cancer cells overexpressing FA receptors. These findings agree with the results of the present study, where under the same Au concentration, KB cells treated with FA-AuNPs revealed significantly higher CT contrast enhancement than the cells treated with AuNPs. represents the role of FA targeting on optimizing the CT contrast performance of AuNPs in terms of “ΔHUFA-AuNPs – ΔHUAuNPs”. Here, ΔHUFA-AuNPs and ΔHUAuNPs refer to the increase in the CT value of the KB cells due to treatment with FA-AuNPs and AuNPs at the same Au concentrations relative to the CT value of the control group, respectively.
Table 1. The resultant increase in the CT value of KB cells caused by the FA modification of AuNPs (ΔHU FA-AuNPs – ΔHU AuNPs). ΔHU FA-AuNPs and ΔHU AuNPs stand for the increase in the CT value of KB cells due to treatment with FA-AuNPs and AuNPs at the same Au concentration relative to the CT value of the control group, respectively.
CT imaging requires an optimal compromise between image quality and patient dose. It is a key consideration to work with a minimal dose to follow the ALARA principle whereby the patient would be protected from the risks associated with ionizing radiation. A general reduction in the tube current as a possible means for dose reduction is always associated with impairment in the image quality due to increased pixel noise [Citation24]. As shown in , under the tube voltage of 130 KVp, elevating the mAs product significantly increases the absorbed dose during a head CT protocol. This increase however is not associated with an appreciable enhancement of image quality. quantitatively compares the respective CT value enhancement of KB cells caused by the (1) elevating mAs product, (2) treatment with AuNPs and (3) treatment with FA-AuNPs. Accordingly, elevating the tube current–time product from 60 to 250 mAs led to a ∼ 4.17-fold increase in radiation dose, whereas the corresponding CT value enhancement was not noticeable (ΔHU = 41). In sharp contrast, the existence of AuNPs with and without FA modification dramatically enhanced the CT value without any increase in the radiation dose by keeping the mAs product at the minimum level. Indeed, the resultant increase in the CT value of the cells exposed to nanoparticles was much more than that obtained by elevating the mAs product. Therefore, AuNPs present the potential for dose reduction in CT examinations by lowering the minimal mAs product required, while enhancing the contrast of CT images. The potential of AuNPs for contrast enhancement and dose reduction in optimizing CT imaging can be considerably utilized in combination with FA targeting.
Table 2. The effects of elevating the mAs product, AuNPs and FA-AuNPs on the CT value enhancement of KB cells. ΔHU stands for the resultant increase in the CT value of KB cells due to the mentioned effects relative to the control group.
Conclusions
Utilizing AuNPs with high X-ray absorption properties in combination with FA targeting presents a CT-based molecular nanoprobe and offers a targeted CT imaging strategy for specific recognition of cancer cells. Elevating the mAs product as a general approach for enhancing image quality is associated with increasing patient dose while the resultant increase in image quality is not noticeable. The use of FA-modified AuNPs represents a competent alternative to the approach of elevating mAs product for improving image quality. Indeed, FA-modified AuNPs provide a good potential for optimizing CT imaging by keeping the required mAs product and the radiation dose as low as possible while enhancing the image contrast.
Disclosure statement
No potential conflict of interest was reported by the authors.
Additional information
Funding
Related Research Data
References
- Zhou B, Yang J, Peng C, et al. PEGylated polyethylenimine-entrapped gold nanoparticles modified with folic acid for targeted tumor CT imaging. Colloids Surf B Biointerfaces. 2016;140:489–496.
- Chen Q, Li K, Wen S, et al. Targeted CT/MR dual mode imaging of tumors using multifunctional dendrimer-entrapped gold nanoparticles. Biomaterials. 2013;34:5200–5209.
- Liu H, Wang H, Guo R, et al. Size-controlled synthesis of dendrimer-stabilized silver nanoparticles for X-ray computed tomography imaging applications. Polym Chem. 2010;1:1677–1683.
- Popovtzer R, Agrawal A, Kotov NA, et al. Targeted gold nanoparticles enable molecular CT imaging of cancer. Nano Lett. 2008;8:4593.
- Yordanov AT, Lodder AL, Woller EK, et al. Novel iodinated dendritic nanoparticles for computed tomography (CT) imaging. Nano Lett. 2002;2:595–599.
- Lin J, Chen X, Huang P. Graphene-based nanomaterials for bioimaging. Adv Drug Deliv Rev. 2016;105:242–254.
- Ryu JH, Lee S, Son S, et al. Theranostic nanoparticles for future personalized medicine. J Control Release. 2014;190:477–484.
- Liu Y, Zhang N. Gadolinium loaded nanoparticles in theranostic magnetic resonance imaging. Biomaterials. 2012;33:5363–5375.
- Hainfeld J, Slatkin D, Focella T, et al. Gold nanoparticles: a new X-ray contrast agent. Br J Radiol. 2006;79(939):248–253.
- Rana S, Bajaj A, Mout R, et al. Monolayer coated gold nanoparticles for delivery applications. Adv Drug Deliv Rev. 2012;64:200–216.
- Connor EE, Mwamuka J, Gole A, et al. Gold nanoparticles are taken up by human cells but do not cause acute cytotoxicity. Small. 2005;1:325–327.
- Hirsjarvi S, Passirani C, Benoit JP. Passive and active tumour targeting with nanocarriers. Curr Drug Discov Technol. 2011;8:188–196.
- Byrne JD, Betancourt T, Brannon-Peppas L. Active targeting schemes for nanoparticle systems in cancer therapeutics. Adv Drug Deliv Rev. 2008;60:1615–1626.
- Ghaznavi H, Hosseini-Nami S, Kamrava SK, et al. Folic acid conjugated PEG coated gold–iron oxide core–shell nanocomplex as a potential agent for targeted photothermal therapy of cancer. Artif Cells, Nanomed Biotechnol. 2017 [Oct 10];[1–11]. doi: 10.1080/21691401.2017.1384384
- Chiani M, Norouzian D, Shokrgozar MA, et al. Folic acid conjugated nanoliposomes as promising carriers for targeted delivery of bleomycin. Artif Cells, Nanomed Biotechnol. 2017 [Jun 23];[1–7]. doi: 10.1080/21691401.2017.1337029
- Shakeri-Zadeh A, Eshghi H, Mansoori G, Hashemian A. Gold nanoparticles conjugated with folic acid using mercaptohexanol as the linker. J Nanotechnol Progr Int. 2009;1:13–23.
- Hashemian A, Eshghi H, Mansoori G, et al. Folate-conjugated gold nanoparticles (synthesis, characterization and design for cancer cells nanotechnology-based targeting). Int J Nanosci Nanotechnol. 2009;5:25–34.
- Mansoori GA, Brandenburg KS, Shakeri-Zadeh A. A comparative study of two folate-conjugated gold nanoparticles for cancer nanotechnology applications. Cancers. 2010;2:1911–1928.
- Samadian H, Hosseini-Nami S, Kamrava SK, et al. Folate-conjugated gold nanoparticle as a new nanoplatform for targeted cancer therapy. J Cancer Res Clin Oncol. 2016;142:2217–2229.
- Peng C, Qin J, Zhou B, et al. Targeted tumor CT imaging using folic acid-modified PEGylated dendrimer-entrapped gold nanoparticles. Polym Chem. 2013;4:4412–4424.
- Wang H, Zheng L, Peng C, et al. Folic acid-modified dendrimer-entrapped gold nanoparticles as nanoprobes for targeted CT imaging of human lung adencarcinoma. Biomaterials. 2013;34:470–480.
- McCollough CH, Bruesewitz MR, Kofler JM Jr, CT dose reduction and dose management tools: overview of available options 1. Radiographics. 2006;26:503–512.
- Corona EC, Ferreira I-BG, Herrera JG, et al. Verification of CTDI and DLP values for a head tomography reported by the manufacturers of the CT scanners, using a CT dose profiler probe, a head phantom and a piranha electrometer. INIS. 2015;47(7):INIS-MX–2946.
- Kalender WA, Wolf H, Suess C, et al. Dose reduction in CT by on-line tube current control: principles and validation on phantoms and cadavers. Eur Radiol. 1999;9:323–328.
- Li G, Li D, Zhang L, et al. One‐step synthesis of folic acid protected gold nanoparticles and their receptor‐mediated intracellular uptake. Chem Eur J. 2009;15:9868–9873.
- Neshastehriz A, Tabei M, Maleki S, et al. Photothermal therapy using folate conjugated gold nanoparticles enhances the effects of 6MV X-ray on mouth epidermal carcinoma cells. J Photochem Photobiol B. 2017;172:52–60.
- Shope TB, Gagne RM, Johnson GC. A method for describing the doses delivered by transmission x-ray computed tomography. Med Phys. 1981;8:488–495.
- Dou Y, Guo Y, Li X, et al. Size-tuning ionization to optimize gold nanoparticles for simultaneous enhanced CT imaging and radiotherapy. ACS Nano. 2016;10:2536–2548.
- Tripathi R, Shrivastav A, Shrivastav B. Biogenic gold nanoparticles: as a potential candidate for brain tumor directed drug delivery. Artif Cells Nanomed Biotechnol. 2015;43:311–317.
- Al Zaki A, Cormode D, Tsourkas A, et al. Increasing the therapeutic efficacy of radiotherapy using nanoparticles. In: Tofilon P, Camphausen K, editors. Increasing the therapeutic ratio of radiotherapy (Cancer Drug Discovery and Development). Switzerland: Humana Press; 2017. p. 241–265.
- Bergs JW, Wacker MG, Hehlgans S, et al. The role of recent nanotechnology in enhancing the efficacy of radiation therapy. Biochim Biophys Acta. 2015;1856:130–143.
- Kim D, Park S, Lee JH, et al. Antibiofouling polymer-coated gold nanoparticles as a contrast agent for in vivo X-ray computed tomography imaging. J Am Chem Soc. 2007;129:7661–7665.
- Daraee H, Eatemadi A, Abbasi E, et al. Application of gold nanoparticles in biomedical and drug delivery. Artif Cells Nanomed Biotechnol. 2016;44:410–422.
- Beik J, Abed Z, Ghoreishi FS, et al. Nanotechnology in hyperthermia cancer therapy: from fundamental principles to advanced applications. J Control Release. 2016;235:205–221.
- Beik J, Khademi S, Attaran N, et al. A nanotechnology based strategy to increase the efficiency of cancer diagnosis and therapy: folate conjugated gold nanoparticles. Curr Med Chem. 2017. doi: 10.2174/0929867324666170810154917
- Zhou F, Feng B, Yu H, et al. Cisplatin prodrug-conjugated gold nanocluster for fluorescence imaging and targeted therapy of the breast cancer. Theranostics. 2016;6:679.
- Gao B, Shen L, He KW, et al. GNRs@ SiO2-FA in combination with radiotherapy induces the apoptosis of HepG2 cells by modulating the expression of apoptosis-related proteins. Int J Molecular Med. 2015;36:1282–1290.
- Mehdizadeh A, Pandesh S, Shakeri-Zadeh A, et al. The effects of folate-conjugated gold nanorods in combination with plasmonic photothermal therapy on mouth epidermal carcinoma cells. Lasers Med Sci. 2014;29:939–948.
- Shakeri-Zadeh A, Mansoori GA. editors. Cancer Nanotechnology Treatment through Folate Conjugated Gold, Nanoparticles. Proceedings of WCC; 2010.
- Hu Y, Wang R, Wang S, et al. Multifunctional Fe3O4@ Au core/shell nanostars: a unique platform for multimode imaging and photothermal therapy of tumors. Scientific Rep. 2016;6:28325.