
 ?Mathematical formulae have been encoded as MathML and are displayed in this HTML version using MathJax in order to improve their display. Uncheck the box to turn MathJax off. This feature requires Javascript. Click on a formula to zoom.
Abstract
Recently, major problem related to pathogenic bacteria is augmentation of antibiotic resistance which has been changed treatment and recovery of millions of infectious patients. The present study reports an eco-friendly, rapid and easy method for synthesis of silver (Ag), copper (Cu) and titanium dioxide (TiO2) nanoparticles (NPs) using Artemisia haussknechtii leaf aqueous extract with antibacterial activities against multi-drug resistance (MDR) bacteria species. Three different concentrations (0.001, 0.01 and 0.1 M) of AgNO3, CuSO4 and TiO (OH)2 were investigated for obtaining optimum NPs green synthesis. Total phenolic content, total flavonoid content of leaf extract and total antioxidant activity (DPPH) assay were determined as radical scavenging methods. UV–Visible spectroscopy, Fourier transform infrared spectroscopy analysis, X-ray diffraction, energy dispersive X-ray spectroscopy, field emission scanning electron microscope and atomic force microscopy (AFM) were used due to NPs characterization. The size average of the Ag, Cu and TiO2 NPs obtained were respectively 10.69 ± 5.55, 35.36 ± 44.4 and 92.58 ± 56.98 nm. In the case of antibacterial assay, disc diffusion assay, minimum inhibitory concentration, minimum bactericidal concentration, bacterial growth and morphology of four MDR species Staphylococcus aureus ATCC 43300, Staphylococcus epidermidis ATCC 12258, Serratia marcescens ATTC13880 and Escherichia coli ATCC 25922 were evaluated. Results of this study demonstrated that A. haussknechtii leaf extract with various groups of phytochemicals such as phenols and flavonoids had suitable ability in green synthesis of Ag, Cu and TiO2 NPs. Also, Ag and Cu NPs had more antibacterial activities compared to TiO2 NPs.
Introduction
Especially, nanoparticles (NPs) are defined as particles with 1–100 nm size that have unique chemical and physical properties such as high surface area to volume ratio compare with their bulk material [Citation1]. There are organic and inorganic NPs dependent on chemical origin of NPs. Among inorganic NPs, noble metal NPs obtained a striking attention due to their specific characteristics which allow prominent usage in various fields such as photonics, catalysis, microelectronics, information storage and medicine [Citation2]. Recently, noble metal NPs have been used extensively as an effective antimicrobial agent against broad range of bacteria, including antibiotic resistant strains [Citation3].
In order to prepare metallic NPs, several methods have been applied. For example, using a various chemicals as precursors and more amounts of surfactants as stabilizing agents is one of the common methods in NPs synthesis. In this way, there are the different preparation methods in the synthesis of metallic NPs from several materials [Citation4]. Today, the way of NP synthesis with a small size is important part of nanotechnology function [Citation5]. There are several ways for NPs synthesis such as chemical, physical, biological and enzymatic methods. Physical vapour deposition (PVD), atomic layer deposition, spay pyrolysis, ball milling, laser desorption, lithographic methods, layer by layer growth, ultra-thin films and molecular beam epitaxy are some examples of physical methods. Also, chemical methods include chemical vapour deposition (CVD), wet chemical and co-precipitation. In contrast to these two basic methods, biological synthesis ways of NPs have less energy need and are eco-friendly methods [Citation6].
In green synthesis approaches of metal NPs unlike chemical and physical method, it was not used toxic reducing agents or expensive solvents. Therefore, NPs green synthesis methods have eco-friendly and low cost advantages compared to conventional methods. In this way, it can be applied plants, algae, bacteria and fungi as reducing and stabilizing precursors [Citation7]. Among these organisms, plants have advantages of high availability, biocompatibility and biodegradability [Citation8]. Artemisia L. belongs to the large family Asteraceae (Compositae) with approximately 20,000 species in 1000 genera. There are over 500 species in Artemisia genus which are located abundantly in Asia (with 35 species in Iran), Europe and North America [Citation9]. Species of this genus are used frequently as medicinal plant for the against of malaria, inflammation, pyrexia, cancer, hepatitis and infectious disease [Citation10]. These characteristics are resulted from constituents of essential oils such as piperitone, camphor, β-ylangene, β-elemene, and sapathulenol [Citation9]. Accordingly, among this genus, we used A. haussknechtii as endemic species of Iran especially Kermanshah province for green synthesis of NPs [Citation9,Citation11].
Nanoparticles can be taken up by various organisms by their small size as extrinsic property rather than a nanoscale property as intrinsic property [Citation12]. Different mechanisms such as generation of reactive oxygen species (ROS) are toxicity cause of NPs witch can be occurred by their a typical surface structure of NPs [Citation13]. NPs can disrupt the polymer subunits of cell membrane in pathogenic and non-pathogenic microorganisms such as glycopeptide of bacteria cell wall. In the case of bacteria, the interaction of NPs with cell wall causes cell damage and disturbs the protein synthesis mechanism in the bacterial cell [Citation14]. Permeability of membrane can be raised by increasing NPs concentrations and resulted in cell wall rupturing [Citation15]. Large surface area is major property of NPs with small size which may contributes in cell wall damage [Citation16].
Here, we synthesized Ag, Cu and TiO2 NPs from the leaf aqueous extract of Artemisia haussknechtii as green method in three different concentrations of related metallic slats (AgNO3, CuSO4 and TiO(OH)2). For NPs characterization, UV–Visible spectroscopy, Fourier transform infrared spectroscopy (FT-IR) analysis, X-ray diffraction (XRD), energy dispersive X-ray spectroscopy (EDX), field emission scanning electron microscope (FESEM) and atomic force microscopy (AFM) were applied. Biological characterizations of plant leaf extract and NPs were determined by assays of total antioxidant activity (TAA), scavenging properties of DPPH, reducing power, metal ion chelating activity, total phenolic content (TPC), total flavonoid content (TFC), and total tannin content (TTC). In the case of antibacterial assays, minimum inhibitory concentration (MIC), minimum bactericidal concentration (MBC), bacterial growth kinetic and morphology of four multi drug resistance species Staphylococcus aureus ATCC 43300, Staphylococcus epidermidis ATCC 12258, Serratia marcescens ATTC13880 and Escherichia coli ATCC 25922 were evaluated.
Materials and methods
Materials and microorganisms
AgNO3, CuSO4, TiO(OH)2, Folin-Ciocalteu reagent, sodium carbonate, gallic acid, NaNO2, AlCl3, NaOH, rutin, HCl, (+)-catechin, DMSO, sulphuric acid, sodium phosphate, ammonium molybdate, 1,1-diphenyl-2-picryl-hydrazyl (DPPH), ethanol, phosphate buffer, K3Fe(CN)6, trichloroacetic acid (TCA), ferric chloride (FeCl3), butylated hydroxy anisole (BHA), FeCl2, ferrozine, Ethylene diaminetetraacetic acid (EDTA), Mueller–Hinton agar and broth were purchased from Sigma-Aldrich (St. Louis, MO, USA). Reprehensive multidrug resistant bacteria of gram negative (E. coli ATCC 25922 and S. marcescens ATTC13880) and gram positive (S. aureus ATCC 43300 and S. epidermidis ATCC 12258) were applied to indicate the antimicrobial activity of Ag, Cu and TiO2 NPs. These strains were obtained from bacterial archive of microbiology laboratory, Razi University of Kermanshah. In order to following evaluating, bacterial strains were maintained on nutrient agar slants at 4 °C.
Plant extract preparation
Healthy leaves of A. haussknechtii were collected from the Amrooleh mountainous region, grid reference 34°3804″N47° 18′02″E, 15 km north of the town of Sahneh in the Kermanshah province, west of Iran during July 2016. The plant was identified and authenticated by an expert of Kurdistan agriculture and resource research centre (Sanandaj, Kurdistan, Iran). In order to future reference, a voucher specimen was submitted at the herbarium. Aqueous leaf extract of A. haussknechtii was prepared by freshly amassed leaves (20 g). The leaves surface were cleaned with running tap water, followed using distilled water, and air dried on a paper towel for six days. Dry leaves were ground in a tissue grinder to fine powder, and boiled with 250 ml of double distilled water at 90 °C for 30 min. Suspensions were filtered with Whatman No. 40 filter paper. The filtered suspension was collected and stored at 4 °C till further use. This extract was used as reducing as well as stabilization/capping agent [Citation17].
Green synthesis of silver, copper and titanium dioxide NPs
For synthesis of Ag, Cu and TiO2 NPs, the Erlenmeyer flask containing 100 ml of AgNO3, CuSO4 and TiO(OH)2 with 0.1, 0.01 and 0.001 M concentrations were stirred for 2 h. The aqueous extract of A. haussknechtii was filtered through Whatman No. 1 filter paper followed by centrifugation at 8000 rpm for 30 min. Ten mL of resulted leaf aqueous extract was added to 90 ml of AgNO3, CuSO4 and TiO(OH)2 at room temperatures under stirred condition for 24 h. In order to purify NPs, mixture solutions were centrifuged at 4000 rpm for 30 min. For UV–vis spectroscopy analysis; the supernatant was transferred to a clean dry beaker and stored at 4 °C in the dark. The pure three metal salt solutions and aqueous leaf extract (olive green) of A. haussknechtii did not demonstrate any color changes which indicated no proof of NPs synthesis. Reduction of AgNO3, CuSO4 and TiO(OH)2 with A. haussknechtii extract respectively resulted in brown, green and milky colours.
Physicochemical characterization
UV–Vis spectroscopy
The intensity of absorption peaks of green synthesized Ag, TiO2 and Cu NPs was examined by a double beam UV–Vis spectrophotometer (Tomas, UV 331) in the range of 200–900 nm. In this case, The UV–Vis absorption spectra of solution samples were taken from the reaction mixtures at different concentrations of AgNO3, CuSO4 and TiO2 (OH)2 (0.001, 0.01 and 0.1 M) in three replicates and evaluated by UV–Vis spectroscopy.
XRD analysis
X-ray diffraction was applied by EQUNIOX 3000, diffractometer in the scanning range of 20°–70°, 10°–80° and 10°–70° (2θ) using Cu Ka radiations of wavelength 1.5406 Å for identification of the crystal phases and determination of the average crystal size of green synthesized Ag, Cu and TiO2 NPs, respectively.
FT-IR spectroscopy
In order to determination of functional groups in plant leaf extract and green synthesized NPs, FT-IR spectroscopy was used as a suitable analytical technique. FT-IR measurements were done by spectrophotometer (Germany, Bruker, Model:ALPHA). FT-IR Spectra of NPs dried samples were analysed in the infrared range (4000 cm−1 to 400 cm−1) by resolution of 4 cm−1 in absorbance mode for 10–120 scans at 25 °C temperature.
FE-SEM analysis
Scanning electron microscopy (SEM) and energy dispersive X-ray analysis (EDAX) (Model XL30; Philips, Eindhoven, the Netherlands) at 20 kV was used to study the morphology of the NPs and the elemental analysis. For preparing thin films of NPs samples on a carbon-coated copper grid, a small amount of the NPs samples was dropped on grid and followed by removing moisture by blotting paper. Prior to analysis, the NPs film on the grid were allowed to complete dry under a mercury lamp for 10 min.
AFM analysis
Atomic force microscopy analysis was performed at ambient conditions by AFM instrument (ND-MDT, Moscow, Russia) operating in semi-contact mode by silicon cantilevers of 125 µm length, golden silicon probes CSG 11 tip, scanning rate of 5 µ/s, 5 nm resolution, resonance frequency 209–286 kHz, spring constant 20–80 nm−1. Analysis of AFM images was operated by the software image analysis 2.2.0 (NT-MDT, Moscow, Russia). All NPs were diluted in deionized water to a suitable concentration (1:10) and ultrasonicated for 20–40 min. About 60 μl of the dilution were put on a cleaned mica (before using, mica was freshly cleaved), incubated for 40 min depending on the density of particles required, and then the residual solution was washed by ethanol. This method was carried out for all samples.
Biological characterization
Antibacterial activities of Ag, Cu and TiO2 NPs
Disc diffusion assay: The antibacterial activity of Ag, Cu and TiO2 NPs were measured against Staphylococcus aureus ATCC 43300, staphylococcus epidermidis ATCC 12258, S. marcescens ATTC13880 and E. coli ATCC 25922 by agar disc diffusion method [Citation18]. These strains were obtained from bacterial archive of microbiology laboratory, Razi University of Kermanshah. In order to following evaluating, bacterial strains were maintained on nutrient agar slants at 4 °C. Approximately 106 colony-forming units (CFU) of these four bacteria species are inoculated on Mueller–Hinton broth, followed by impregnation of disc with different concentrations of three NPs (0.1, 0.01 and 0.001 M) and aqueous leaf extract and then placing of discs on agar plates. All the samples were incubated at 37 °C for 24 h. After incubation, the agar plates were observed for the presence of a zone of inhibition.
Minimum inhibitory concentration and MBC evaluation: Minimum inhibitory concentration and minimum bactericidal concentration methods were used for measurement of antibacterial activity of Ag, Cu and TiO2 NPs. The antibacterial effectiveness was evaluated against E. coli ATCC 25922 as selected bacterium concentration of 106 CFU/ml by different concentrations of Ag, Cu, TiO2 NPs and amoxicillin antibiotic (0.5, 1, 2, 4, 10, 20, 40 and 60 μg/ml).This assay was determined by sterile 2 ml 96-well plates. The 10 wells of each row were filled by 0.5 ml sterilized Mueller Hinton broth. Wells 2–9 received an additional 0.5 ml of a mixture of culture medium and NPs with concentration sequence from 0.5, 1, 2, 4, 10, 20, 40 and 60 μg/ml. Wells 1 and 10 served, respectively as growth control (negative control) and antibiotic control (positive control). Amoxicillin (0.1 mg/ml) were used as controls for this bacterium [Citation19]. The bacterial cultures were incubated at 37 °C at 250 rpm. Optical density at 600 nm (OD600) was used to estimating the concentration of bacterial population.
Ag and Cu NPs effect on bacterial growth: In order to indication the growth curve in the presence of Ag and Cu NPs, E. coli ATCC 25922 and S. aureus ATCC 43300 were grown respectively as selected negative and positive gram bacteria in liquid luria broth (LB) medium until they reached the log phase with optical density (OD) by 0.7. Afterwards, due to obtain OD600 with 0.1 and 0.2, the medium were diluted by fresh LB liquid medium [Citation20]. Each of the two NPs was added into the bacterial culture medium with different concentrations, and the culture was incubated at 37 °C and 250 rpm. Concentrations and growth rates of E. coli ATCC 25922 was indicated by evaluating OD600 at different times.
Bacterial morphology upon Ag NPs treatment: Morphology of bacteria upon Ag NPs treatment was visualized by FE-SEM. In this case, 1 ml of bacterial cultures were taken from phase of growth kinetics and centrifuged at 5000 rpm for 5 min at 4 °C. The pellet washed twice and suspended in 1X PBS (137 mM NaCl, 2.7 mM KCl, 4.3 mM Na2HPO4 and 1.47 mM KH2PO4). One drop of the suspended culture was put on glass slides following fixing of bacteria by incubating overnight in 2.5% glutaraldehyde. It was used 1% tannic acid for few minutes following dehydration by increasing concentration of ethanol (20%, 40%, 60%, 80% and 100%). These samples were coated with gold and platinum for FE-SEM scanning analysis [Citation21].
Antioxidant properties assay
Total antioxidant activity
Total antioxidant activities of the green synthesized NPs of Ag, Cu and TiO2 and aqueous leaf extract were measured based on method of Prieto et al. [Citation22]. About 100 mg of the synthesized three NPs were taken into reaction vial and mixed by 0.05% DMSO. About 0.1 ml aliquot solution of the samples was mixed by 1 ml of the reagent solution (0.6 M sulphuric acid, 28 mM sodium phosphate and 4 mM ammonium molybdate) and followed by incubation of samples at 95 °C for 90 min. After cooling of samples at 25 °C, the absorbance was determined at 695 nm against a reagent solution without the samples as blank. Ascorbic acid was used as control for comparison assay. The absorbance of the samples was reported as the TAA which the higher antioxidant activity illustrated by the higher absorbance. Mean values of three replicates were evaluated for each samples.
Scavenging properties of DPPH
The antioxidant activity of the leaf extract and NPs was measured by the 1,1-diphenyl-2-picryl-hydrazyl (DPPH) assay with slight modifications, as reported by Villano et al. [Citation23]. In brief, 1 ml of each concentration (100–500 mg in methanol) of the synthesized NPs and aqueous leaf extract was mixed with 1 ml DDPH solution and incubated in the dark at room temperature for 1 h afterwards, the absorbance of the mixtures was determined at 517 nm. Ascorbic acid was utilized as a positive control. The ability of the sample to scavenge DPPH radical was indicated by below formula:
Reducing power assay
Reducing power of A. haussknechtii leaf ethanolic extract and NPs was determined by method of Oyaizu with slight modification [Citation24]. Different concentrations (0.1, 0.2, 0.3, 0.4 and 0.5 mg/mL) of the leaf extract (1 ml) and three NPs was mixed with 1 ml of phosphate buffer (0.2 M, pH 6.6) and 1 ml of potassium hexacyanoferrate (K3Fe(CN)6) (1%, w/v). The mixture solution was incubated at 50 °C in an incubator for 20 min. The reaction was terminated by 1 ml of trichloroacetic acid (TCA) (10%, w/v), followed by centrifugation at 3000 rpm for 15 min. The resulted supernatant solution (1.5 ml) was mixed with distilled water (1.5 ml) and 0.1 ml of ferric chloride (FeCl3) solution (0.1%, w/v) for 10 min. Then, the absorbance of mixture was measured at 700 nm against blank solution. Higher absorbance value of the reaction mixture determined increased reducing power. For each sample, three replicates were made and average was noted. Ascorbic acid and butylated hydroxy anisole (BHA) were used as standard.
Metal ion chelating activity
The chelation activity of Fe2+ ions by green synthesized Ag, Cu and TiO2 NPs was measured according to the method of Dinis et al. [Citation25]. Different concentrations (0.1, 0.2, 0.3, 0.4 and 0.5 mg/mL) of the leaf extract (1 ml) and three NPs were added to a solution of 2 mM FeCl2 (0.1 ml). The reaction was initiated by the adding of 5 mM ferrozine (0.2 ml). Then, the mixture was shaken vigorously and left to stand at room temperature for 10 min. The absorbance at 562 nm was determined by spectrophotometer. The ferrous chelating activity of NPs and leaf extract was monitored by evaluating the Fe2+–ferrozine complex. Ethylene diaminetetraacetic acid (EDTA) was used as standard and the results were expressed as mg EDTA equivalent/g dried extract. The inhibition percentage of ferrous–ferrozine complex formation was measured by the following formula:
where A0 is the absorbance of the control (containing all reagents except NPs or leaf extract) and A1 is the absorbance of the NPs/extract/EDTA.
Total phenolic content
It was used Folin–Ciocalteu assay to evaluating the TPC [Citation26]. About 200 μl of crude extract (1 mg/mL) were made up to 3 ml with distilled water, mixed thoroughly by 0.5 ml of Folin–Ciocalteu reagent for 3 min, followed by the addition of 2 ml of 20% (w/v) sodium carbonate (Na2CO3). Absorbance was determined at 765 nm after a 15 min heating of the mixture at 45 °C. Based on calibration curve; the TPC was calculated. The results were illustrated as mg of gallic acid equivalent (GAE) per gram dry weight (/gdw). Experiments were carried out as three replicates for each dilution.
Total flavonoid content
The aluminium chloride (AlCl3) colorimetric method was applied for measurement of the TFC from crude extract [Citation27]. Standard and crude extracts (0.5 ml) were separately mixed by distilled water (2 ml) and 5% NaNO2 (150 μl). Mixture was combined with 10% AlCl3 solution (150 μl), 4% NaOH (2 ml) followed by standing for 6 min and finally distilled water was added to make a volume of 5 ml in a 5 ml volumetric flask. The mixture was held for 15 min, and absorbance of the solutions was measured at 510 nm against blank and the TFC was expressed as mg rutin equivalents/gram dried extract (mg/gdw).
Total tannin content
Method of Sun et al. [Citation28] was applied to measurement of TTC. Diluted samples, 3 ml methanol solution of 4% vanillin and 1.5 ml of concentrated HCl were added to 50 μL. Absorption of mixture was evaluated at 500 nm against methanol as a blank after 15 min incubation in room temperature. The TTC is expressed as (+)-catechin/gDW and all samples were analysed in triplicate.
Statistical analysis
Statistical analysis was performed using SPSS version16 software (SPSS Inc., Chicago, IL, USA) and the results were evaluated by one way ANOVA (Tukey’s test). Moreover, all experiments were performed in triplicates, means with standard errors were calculated and p ≤ 0.05 was considered statistically significant .In order to determine the dose–response relation between the extracts and NPs, regression analysis was applied. Also it was performed linear regression analysis to indicate the correlation coefficient.
Results and discussion
UV–vis spectroscopy
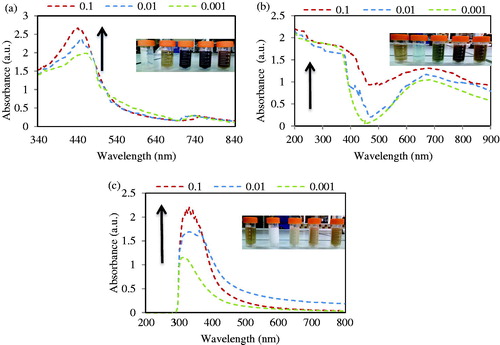
The most abundantly applied technique for structural characterization of NPs is UV–vis spectroscopy. The UV–vis absorbance spectra of green synthesized NPs in leaf extract are shown in ). illustrates a strong broad absorption peak located between 340 nm and 350 nm for silver NPs prepared by A. haussknechtii. The absorbance in the range of 340–350 nm increases by increasing of AgNO3 concentration [Citation29]. Also, colour of reaction solution was changed from green to brown which it indicates NPs green synthesis. The UV–vis absorbance of copper NPs in reaction solution are shown in . Firstly, colour of the precursor solution was blue, a typical feature of copper sulphate, with the absorbance bands in range of 500–800 nm which was changed after few minutes to pale green colour by distinct broad bands with range of 200–300 nm [Citation30]. In this case, previous studies have been reported based on Mie’s theory (dipole oscillation) that the absorption bands in the range of 200–300 nm are fitting in Cu NPs [Citation30,Citation31]. Absorbance peak in 0.1 M concentration of CuSO4 was more than others concentrations. The broadness of the absorbance peak can be resulted from the wide size distribution of NPs [Citation30]. shows the UV–vis spectra of TiO2 in different concentrations of TiO2(OH)2. A significant increase in the absorption at wavelength shorter 400 nm and colour change of reaction solution samples can be indicated to the intrinsic band gap absorption of anatase TiO2. Similar to Ag and Cu NPs, absorbance peak in 0.1 M concentration of TiO2(OH)2 was more than 0.01 and 0.001 M concentrations [Citation32].
Figure 1. UV–visible spectra as a function of different concentrations of AgNO3 (a), CuSO4 (b) and TiO2 (OH)2 (c) (0.1, 0.01 and 0.001 M) with aqueous extract of A. haussknechtii in a reaction at 60 °C for 30 min.
XRD analysis
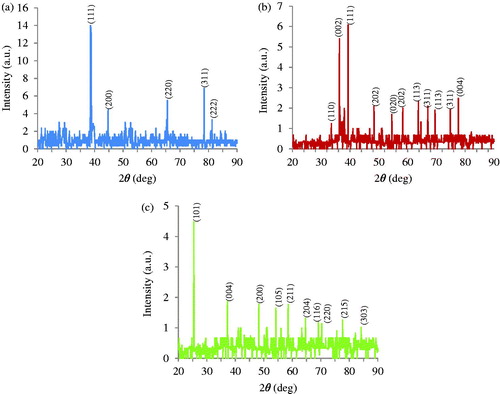
The crystalline nature of Ag, Cu and TiO2 NPs was confirmed by the analysis of XRD pattern (). This Figure illustrates peaks at 2θ values of 38.5°, 50.7°, 65.2°, 78.4° and 81.2° corresponding to XRD planes (111), (200), (220), (311) and (222) Bragg’s reflection based on the face centred cubic (fcc) structure of Ag NPs (). Also, a few unmarked peaks were noticed in the vicinity of the characteristic peaks. These peaks can be resulted from the existing of capping agent stabilizing the NPs. In the case of Cu NPs, the diffracted intensity was recorded from 10° to 80° (). The eleven strong Bragg reflections for cuprite appeared in the sample of Cu NPs at 33.5°, 36.3°, 39.3°, 48.3°, 54.5°, 58.3°, 63.7°, 67°, 69.5°, 74.8° and 77.6° corresponding to the planes of (110), (002), (111), (202), (020), (202), (113), (311), (113), (311) and (004) which can be indexed according to the fcc crystal structure of Copper [Citation33]. Dependent upon atom density, each crystallographic facet contains energetically distinct sites. Cu NPs and Ag NPs contain high atom density facets such as (311) which are known to be highly reactive [Citation34]. Both anatase and rutile forms was concluded from XRD pattern of the green synthesized TiO2 NPs () which can be illustrated at 25.4°, 37.2°, 48.2°, 54.2°, 56°, 58.5°, 63.3°, 69.1°, 70.3°, 75.6°, 77.6° and 84°, which indicated to be (101), (004), (200), (105), (211), (204), (116), (220), (215) and (303) reflections, respectively [Citation35]. The crystal sizes of gained Ag, Cu and TiO2 NPs were estimated respectively to be in the range of 47, 51, 66 nm using Debye–Scherer EquationEquation (1)(1)
(1) :
(1)
(1)
where k, known as Scherer’s constant, ranges from 0.9 to 1.0, λ is 1.5418 Å, which is the wavelength of the X-ray radiation source, β1/2 is the width of the XRD peak at half height and θ is the Bragg angle ().
Figure 2. X-ray diffraction spectrum of Ag NPs, Cu NPs and TiO2 NPs synthesized respectively from 0.1 M AgNO3 (a), CuSO4 (b) and TiO2 (OH)2 treated by A. haussknechtii leaf extract.
FT-IR analysis
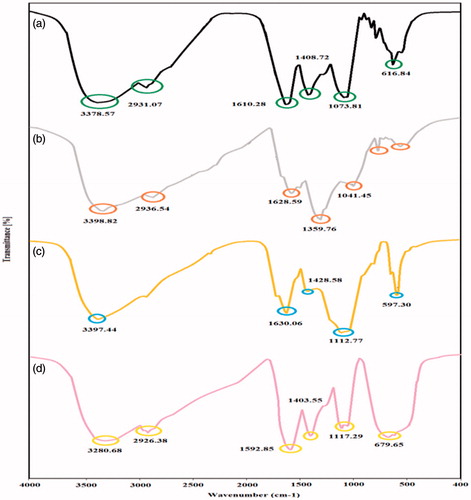
Fourier transform infrared spectroscopy can be applied to evaluate qualitatively a wide range of material in bulk and nano forms by analysis of chemical composition. Information about local molecular environment of the organic molecules on the surface of each NPs were provided by FT-IR analysis. In this study, IR spectra evaluations were carried out to indicate the secondary metabolites in aqueous leaf extract of A. haussknechtii which is corresponding for reducing and capping the biosynthesized Ag, Cu and TiO2 NPs [Citation36]. FT-IR peaks demonstrated four spectrums namely A. haussknechtii leaf aqueous extract, Ag, Cu and TiO2 NPs ()). The results of aqueous leaf extract analysis show different stretches of bonds illustrated at different peaks; 3378.57: amine N–H stretch; 2931.07: alkyl C–H stretch; 1610.28: aromatic C = C bending; 1408.72: aromatic C = C bending; 1073.81: C–F stretch; 916.92: =C–H bending; 866.33: –C = H bending; 818.93: alkene = C–H bending; 775.79:alkene = C–H bending; 616.84: alkane –C–H bending (). As shown in , FTIR spectra of Ag NPs demonstrated prominent peaks at 3398.82: N–H stretch; 2936.54: alkyl C–H stretch; 1628.59: aromatic C = C bending; 1359.76: –C–H bending; 1041.45: C–O stretch; 815.60: =C–H bending. shows FT-IR spectra peaks for copper NPs at 3397.44: N–H stretch; 1630.06: aromatic C = C bending; 1428.58: –C–H bending; 1112.77: C–O stretch (alcohol); 652.24: C–Cl stretch; 597.30: C–Br stretch. As illustrated in , TiO2 NPs have peaks at 3280.68: N–H stretch (amide); 2926.38: C–H stretch (alkane); 1592.95: C = C (aromatic); 1403.55: C = C stretch (aromatic); 1117.29: C–O stretch (alcohol); 1053.31: C–O stretch (alcohol); 679.65: C–Cl (alkyl halide). FT-IR spectra peaks of A. haussknechtii leaf aqueous extract in 3378.57: amine N–H stretch; 2931.07: alkyl C–H stretch; 1408.72: aromatic C = C bending were approximately similar to three NPs which it can be concluded effect of capping and inducing functional groups of secondary metabolites [Citation37,Citation38]. Compared to FT-IR spectrum of leaf extract, Ag NPs spectrum had a sharper peak at 1359.76: –C–H bending and little peak at 1073.81: C–F which it can be resulted that –C–H bending functional group has important role in NPs synthesis than to C–F stretch group. Also, In the case of CuNPs, 1112.77: C–O stretch (alcohol) functional group and for TiO2 NPs, 1592.95: C = C (aromatic) and 679.65: C–Cl (alkyl halide) groups are prominent peaks compared to leaf extract. Finally, as a result, green synthesis of Ag, Cu and TiO2 NPs is deferent based on functional groups of bioactive constitutes of leaf extract.
Figure 3. FT-IR peaks of A. haussknechtii leaf aqueous extract (a), silver (b), copper (c), and titanium dioxide NPs (d).
EDAX analysis
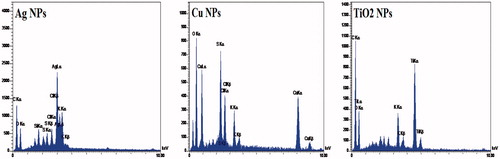
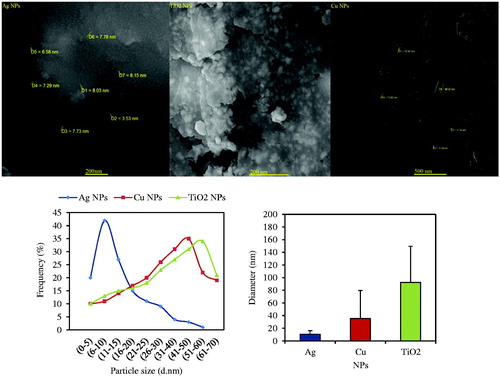
In order to confirm the composition and distribution of NPs, EDAX analysis can be applied through spectrum and elemental mapping [Citation39]. EDAX spectra of Ag, Cu and TiO2 NPs were illustrated in . EDAX spectra of Ag, Cu and TiO2 NPs demonstrated a strong signal for silver, copper and titanium atoms. In the case of EDAX spectra of Ag, there were weaker signals for O, Cl, S and Si atoms. A similar result was reported in biosynthesized Ag NPs derived from Pteris tripartita Sw and Magnolia Kobus. EDAX spectra determined the presence of Ag, Cu and TiO2 NPs as evidenced by strong signal energy peaks for silver, copper and titanium atoms, respectively in the 3.015, 0.960 and 4.560 keV. In the case of Ag NPs, similar strong signal energy peaks for Medicago sativa and P. tripartita Sw plant extract were observed respectively in the range of 2.5–4 and 2–4 keV [Citation40,Citation41]. EDAX spectrum of Cu NPs was similar with investigation of Suárez-Cerda et al. [Citation42]. Also, Chellappa et al. reported strong signal energy peaks for TiO2 by EDAX analysis in 4.5 keV [Citation43]. This result was similar with our study (4.560 KeV). It can be concluded from this analysis that all three NPs had pure elemental composition.
Figure 4. Energy dispersive X-ray analysis spectrum of Ag, Cu and TiO2 NPs green synthesized by A. haussknechtii leaf extract.
SEM analysis
Scanning electron microscope (SEM) analysis illustrated a high density of Ag, Cu and TiO2 NPs in solid phase. Images of all NPs are shown in . Average diameter sizes of 100 particles for Ag, Cu and TiO2 were respectively 10.69 ± 5.55, 35.36 ± 44.4, and 92.58 ± 56.98 nm. In the case of NPs morphology, Ag NPs had triangle shape, but Cu and TiO2 showed spheres shape. Therefore, this analysis indicated smaller diameter and uniform shape of Ag NPs than Cu and TiO2 NPs. Ag NPs green synthesized by Croton (Codiaeum variegatum) leaves, Olive leaves, and Citrus sinensis peel had respectively size distribution in the range of 22–52, 20–25 and 10–35 nm with spherical shape. Average of particle diameter size of 4.8 nm and 5–10 nm (spherical shape) were observed for copper oxide NPs biosynthesized by Gum karaya gum and Gloriosa superba leaves. Also, there was TiO2 NPs diameter size of 25–110 nm (irregular shape) in the case of Catharanthus roseus leaves and 13 ± 3.3 nm for Oryza sativa straw [Citation36].
Figure 5. Scanning electron microscopy images of green synthesized Ag, Cu and TiO2 NPs, average particle diameter size of 100 particles and Histogram showing particle size distribution of three NPs.
AFM analysis
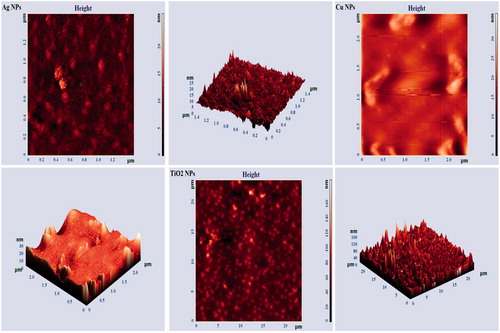
All green synthesized NPs were analysed by AFM. shows the micrographs of three NPs obtained using A. haussknechtii leaf extract. All the figures demonstrate an AFM micrograph (left) and three dimensional (3 D) AFM image (right) of silver, copper and titanium dioxide NPs synthesized from leaf extracts scanned in an area of 1.2 μm × 1.2 μm (Ag NPs), 2 μm × 1.2 μm (Cu NPs) and 2 μm × 1.2 μm (TiO2 NPs). Height maximums for Ag, Cu and TiO2 NPs were respectively 25 nm, 30 nm and 160 nm. AFM can be used as important instrument for analyzing topography, height, sorption, structure and dispersion and agglomeration pattern of the NPs. AFM analysis shown that Ag NPs green synthesized by plant extract of O. tenuiflorum, S. cumini, C. sinensis, S. tricobatum and C. asiatica has respectively size of 28 nm, 26.5 nm, 65 nm, 22.3 nm and 28.4 nm [Citation44]. AFM micrograph of green synthesized silver NPs by Adansonia digitata L. fruit pulp extract, at 2 µm resolution illustrated 25–57 nm size, spherical shaped, polydispersed NPs [Citation45].
Figure 6. Atomic force microscopy micrographs (left) and 3 D AFM images (right) of Ag, Cu, TiO2 NPs green synthesized by A. haussknechtii leaf extract.
Antibacterial activity
Disc diffusion assay
In this study, due to evaluating of the antibacterial activity of Ag, Cu and TiO2 NPs, E. coil ATCC 25922, S. aureus ATCC 43300, S. epidermidis ATCC 12258, S. marcescens ATTC13880 were applied as multi-drug resistance species. The antibacterial activity was measured by disc diffusion and MIC/MBC assays. Results showed that intensity of the antibacterial activity depend upon the NPs concentrations. As shown in and , Ag and Cu NPs had higher antibacterial ability in 0.1 and 0.01 M concentrations. In the case of E. coli and S. aureus bacteria, green synthesized Ag NPs had respectively diameter of inhibition zones (DIZs) of 36 ± 2 and 12 ± 1 mm for 0.1 M concentration. Also, it is obvious that E. coli was more sensitive than S. aureus regarding to NPs stress. Cu NPs showed DIZs of 34 ± 2.64 and 10 ± 1.73 mm for E. coli in 0.1 and 0.01 M concentrations that were less than DIZ of Ag NPs with 36 ± 2 and 12 ± 1 mm. It was founded that DIZs for S. aureus were 4 ± 1 and 8 ± 1.73 mm in 0.1 and 0.01 M respectively without any effect in 0.001 M concentration compared to 12 ± 1, 10 ± 1, and 8 ± 1.73 mm in 0.1, 0.01 and 0.001 M concentrations for Ag NPs (). Lack of growth of S. marcescens was observed for Ag NPs compared with DIZs of 4 ± 1.52, 4 ± 1.52, and 4 ± 1 mm for Cu NPs in 0.1, 0.01 and 0.001 M concentrations. Finally, it can be concluded that Ag NPs had higher antibacterial activity than Cu NPs. Also, TiO2 NPs had not significant effect on E. coil ATCC 25922 and S. aureus ATCC 43300, but there was antibacterial impact on S. epidermidis ATCC 12258, S. marcescens ATTC13880 as lack of growth (). In previous study, antibacterial activity of green synthesized Ag NPs by seed powder extract against S. aureus showed DIZ with 15 mm [Citation46]. It was reported that, biological synthesized Ag NPs via Streptacidiphilus durhamensis strain had higher antibacterial activity against S. aureus with DIZ of 10 ± 1 mm than to E. coli by DIZ of 6 ± 0.86 mm [Citation47]. Also, green synthesized Ag NPs by leaf extract of Ocimum gratissimum demonstrated respectively DIZs of 12 ± 0.6 mm and 16 ± 1 mm for E. coli and S. aureus strain [Citation48]. Li et al. [Citation49] reported Cu NPs with rapid killing effect up to 90% and 85% of S. aureus and E. coil within 3 h, respectively at the concentrations of 10 ppm and 20 ppm. Size-dependent antimicrobial properties of CuO NPs with particle size 20 ± 1.24 nm against E. coli and S. aureus illustrated respectively DIZs of 20 mm and 22 mm [Citation50]. Comparing antibacterial effect of Ag and Cu NPs on E. coli and S. aureus illustrated, respectively 40–50% and 15% higher effect for Ag than to Cu NPs [Citation33]. Also, the maximum DIZ was observed in the green synthesized TiO2 NPs by Psidium Guajava leaf extract (20 μg/mL) against E. coli (23 mm) and S. aureus (25 mm) [Citation51].
Figure 7. Antibacterial activities of Ag, Cu and TiO2 NPs with different concentrations (Plant extract: PE).
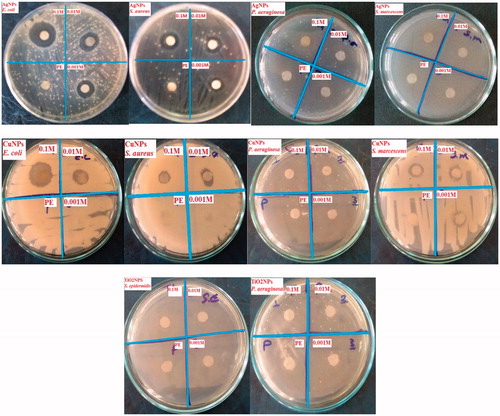
Table 1. Disc diffusion test of Ag, Cu and TiO2 NPs against E. coil ATCC 25922, S. aureus ATCC 43300, S. epidermidis ATCC 12258, S. marcescens ATTC13880.
MIC/MBC evaluation
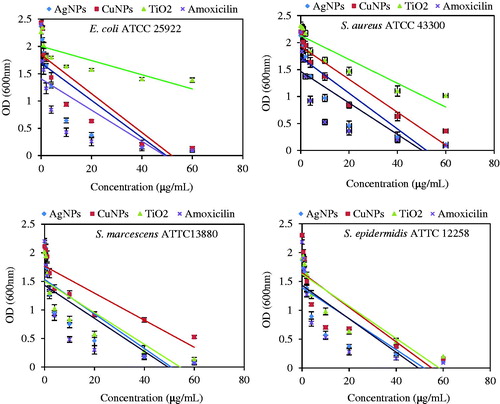
Different concentrations of Ag, Cu, TiO2 NPs, and amoxicillin antibiotic as control (0.5 to 60 μg/ml) were applied to treat high concentration (106/ml CFU) of bacteria. The bacterial concentration was decreased by increasing of NPs and antibiotic concentration. The growth of E. coil ATCC 25922 and S. aureus ATCC 43300 was inhibited at 10 μg/ml as minimum inhibition concentration (MIC) and completely inhibited at 60 μg/ml as MBC by Ag and Cu NPs (). In the case of E. coli, MIC and MBC for TiO2 NPs, respectively were 40 and 60 μg/ml. Bacteriostatic and bactericidal effect of TiO2 NPs were observed, respectively at 20 and 60 μg/ml for S. aureus. Either NPs, Ag and TiO2, had MIC with 4 μg/ml and MBC at 20 μg/ml in the case of S. marcescens ATTC13880. MIC and MBC for Cu NPs were at 10 and 40 μg/ml concentration for this bacteria species. Also, three NPs, Ag, Cu and TiO2 had similar MIC and MBC for S. epidermidis ATCC 12258 at 4 and 20 μg/ml. These results indicate that Ag and Cu NPs have a bactericidal effect through delaying bacterial growth [Citation52]. MIC and MBC were reported for E. coli ATCC 8739 (6.25 and 50 μg/ml) and S. aureus ATCC6338 (6.25 and 100 μg/ml) under treatment of green synthesized Ag NPs [Citation47]. Also, MIC measurement at OD240nm for E. coli after 24 h of Ag NPs treatment with concentrations of 5 and 10 mg/mL showed respectively 1.40 ± 0.10, 0.37 ± 0.00 OD [Citation41]. Also MIC and MBC of Ag NPs against E. coli strains (MTCC 443, MTCC 739, MTCC 1302, and MTCC 1687) demonstrated, respectively 40, 180, 120, and 140 μg/ml for MIC and 60, 220, 160, and 180 for MBC. Compared to silver NP, Copper NPs showed 140, 220, 200 and 280 for MIC and 160, 260, 220, and 300 for MBC [Citation33].
Figure 8. Determination of MIC and MBC based on optical density (OD) vs concentrations of Ag, Cu and TiO2 NPs for E. coli ATCC 25922 and S. aureus ATCC 43300.
Ag and Cu NPs effect on bacterial growth
By augment of NPs concentrations, the slope of the bacterial growth curve for continuously decreased. illustrates the bacterial growth was delayed at higher concentration of Ag and Cu NPs (20, 40 and 60 μg/ml) and was inhibited completely at higher concentration of 60 μg/ml NPs. Therefore, it can be concluded that at low and high concentrations of both NPs, there was bacteriostatic and bactericidal effect respectively. Also, it was obvious from the figures that the bacterial growth rates were dependent on initial bacterial concentration (OD600=0.1 and 0.2). Graphs demonstrates at lower the initial bacterial concentrations, there was complete inhibition bacterial growth. Also, it can be resulted that green synthesized Ag and Cu NPs by extract of A. haussknechtii will be suitable for inhibition of bacterial infection.
Figure 9. Growth kinetics with initial optical density (OD) 0.1 and 0.2 in the presence of different concentrations of Ag NPs and Cu NPs (0.5, 1, 2, 4, 10, 20, 40 and 60 μg/ml) for E. coli ATCC 25922 and S. aureus ATCC 43300.
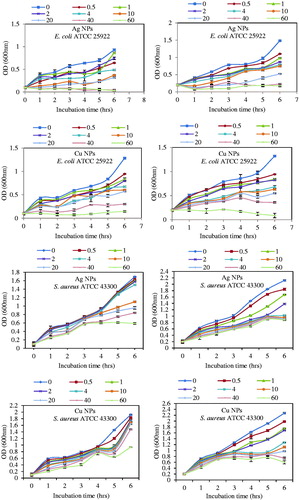
illustrates that bacterial growth kinetics of E. coli ATCC 25922 and S. aureus ATCC 43300 were decreased continuously by increasing NPs concentration. It may be concluded that bacterial growth was delayed firstly at low concentrations (bacteriostatic effect) and inhibited lastly at higher concentrations (bactericidal effect). Also, the graphs demonstrate that direct correlation between the initial number of bacteria and the cells growth. It was illustrated that Ag and Cu NPs at low concentration is require at lower initial OD. It was reported that 100 μg/ml and higher concentrations of p-ZnONP exerted meaningful growth inhibition for Bacillus subtilis and Staphylococcus aureus [Citation21]. Therefore, it can be concluded that these NPs may be utilized to inhibit bacterial infection.
Bacterial morphology upon Ag NPs treatment
In order to indication of the membrane deformities upon the Ag NPs treatment, SEM and FE-SEM were used. Interaction of NPS with cell surface of bacteria can be observed in . As shown in , FE-SEM images of bacteria exposed to Ag NPs at 60 μg/ml illustrate abnormal textures like membrane rupture, membrane blebs (). Also, the ruptured cells no longer remain intact, often found in aggregates or clumps (). Additionally, detail investigation of topological changes in bacterial cell wall can be resulted from FE-SEM images (). Efficacy of antibiotics is decreasing by increasing of resistant bacteria. This problem has changed medicine and endangered lives of millions patients. Misuse of antibiotics and a lack of drug development by the pharmaceutical industry are important reason of antibiotic resistance crisis. In this case, alternative way to remove this crisis is needed. Metal ions such as Ag+ and Cu2+ have a wide range of antibacterial toxicity through binding to atoms of donor ligands and participating in redox reactions [Citation53]. However, microorganisms use different mechanisms such as reduced uptake, efflux of toxic metals out of the cell, extracellular and intracellular sequestration, cellular molecules repairing, metabolic by-pass and chemical modifications to run away from these antibacterial effects. These inhibitory mechanisms can be removed by applying NPs of metals [Citation54]. These nanostructures interact with cell membrane, proteins and nucleic acids inside the bacteria by their large surface area as unique property [Citation21]. In recent years, many investigations have proved beneficial aspects of NPS synthesis through using plant extracts as green biochemistry method [Citation55]. Therefore, we reported the green synthesis of Ag, Cu and TiO2 NPs by aqueous leaf extract of A. haussknechtii.
Figure 10. Scanning electron microscopy images of Ag NPs treated E. coil cell surface. (a) Nanoparticles on the cell surface, (b) membrane blebs, (c) membrane clumping and (d) bacterium damage.
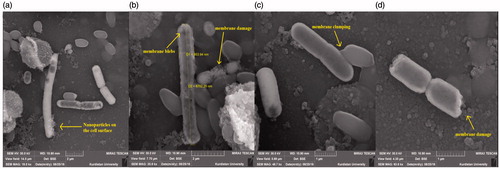
Gram positive bacteria such as S. aureus with thick peptidoglycan polymer have higher resistance to metal ions of Ag and Cu than gram negative bacteria such as E. coli with thin peptidoglycan wall [Citation56]. Biological macromolecules such as DNA and enzymes can be affected by ROS production or an electron release mechanisms. The proteomic data have been proved that Ag and Cu NPS can affect bacteria growth by inhibition of cell wall and protein synthesis. Both Ag and Cu NPs can block the functional operations of bacteria and virus through modification of the three dimensional structure of proteins [Citation57].
TAA and DPPH assay
In this assay, TAA of the aqueous leaf extract of A. haussknechtii and biosynthesized Ag, Cu and TiO2 NPs were studied which Ag and Cu NPs were found to be effective antioxidants compared to the aqueous leaf extract of plant [Citation58]. Results show the difference of this property between the analysed samples (). As comparing the absorbance of NPs to standard ascorbic acid, NPs had a higher antioxidant activity than ascorbic acid with the higher activity noted in the biosynthesized Ag and Cu NPs. At 500 μg/mL concentration, Ag, Cu, TiO2 NPs, leaf extract and ascorbic acid showed 0.837 ± 0.044, 0.794 ± 0.031, 0.678 ± 0.048, 0.637 ± 0.077 and 0.765 ± 0.079 a.u. As a result, order of antioxidant capacity was Ag NP > Cu NP > ascorbic acid > TiO2 NP > leaf extract. In this case, there was no significant difference between treatments with control.
Figure 11. Total antioxidant activity and DPPH free radical scavenging activity of leaf extract and Ag, Cu, TiO2 NPs. Ascorbic acid solution was presented as standard. Values are means of three independent analyses ± standard deviation (n = 3).
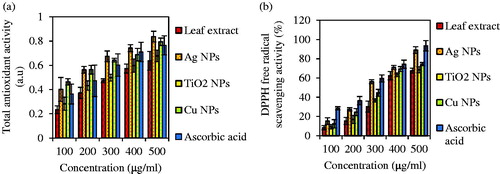
Similarly, demonstrates the DPPH free radical scavenging activity of the leaf extract of A. haussknechtii and green synthesized Ag, Cu and TiO2 NPs compare with ascorbic acid as the standard compound. In this way, Ag NPs had more DPPH activity by 89.02% than Cu NPs (74.45%), TiO2 (68.43%) and leaf extract (67.54) at 500 μg/ml concentration. This assay exhibited that three green synthesized NPs have higher free radical scavenging activity compare with aqueous leaf extract of A. haussknechtii. Sanna et al. [Citation59] illustrated no meaningful DPPH antioxidant activities of the non-functionalized Au NPs as control at the same concentration with polyphenols-capped Au NPs, which can be indicated reason of radical-scavenging activities of polyphenols on the gold NPs’ surface. Also, it was reported that the inhibition activity of the AgNPs was augmented with the increasing concentration, and the maximum DPPH activity of 55.84%±1.31% was observed at highest test concentration (100 µg/ml) [Citation60].
Reducing power assay and metal ion chelating activity
The ability of an antioxidant to donate an electron can be measured by the reducing power assay. This assay is based on reaction of samples with potassium ferricyanide (Fe3+) to produce potassium ferrocyanide (Fe2+), followed by reaction with ferric chloride (FeCl3) to form ferric–ferrous complex that has an absorbance maximum at 700 nm [Citation61]. As shown in , the reducing power of test samples increased by the concentration increase of sample [Citation58]. Three NPs, Ag, Cu and TiO2 had higher value of absorbance than leaf extract. The reducing power was found to be in order of Ag NPs > Cu NPs > TiO2 NPs > ascorbic acid > BHA > A. haussknechtii leaf extract. The maximum and minimum absorbances were respectively observed for Ag NPs and leaf extract with 2.533 and 0.902 at 500 μg/mL. Also, suitable linear relationship was observed in leaf extract (r2 = 0.925) and ascorbic acid (r2 = 0.972) and BHA (r2 = 0.980). These results were similar with results in assay of TAA. Also, previous studies about reducing power of NPs prove these results [Citation62].
Figure 12. Comparative reducing power assay (a) and metal ion chelating activity (b) of ethanolic leaf extract of A. haussknechtii and three NPs. Ascorbic acid and BHA were used as positive control for reducing power. EDTA was used as standard solution. Values are means of three independent analyses ± standard deviation (n = 3).
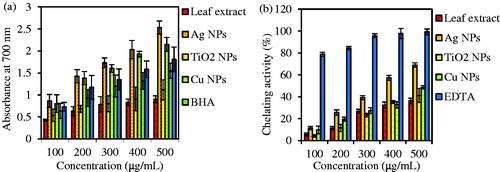
As shown in , the results of the metal ion chelating activity illustrate that leaf extract and three NPs have reducing ability of ferric (Fe3+) to ferrous (Fe2+) ion. EDTA, standard solution, demonstrated maximum Fe2+ ion chelating activity (99.27 ± 2.63) at higher concentration (500 μ/mL) and minimum value of this activity at higher concentration was 36.32 ± 2.37 for leaf extract. Also, the Fe2+ ion chelating ability for three NPs was found to be in order of Ag NPs (68.93 ± 2.37) > Cu NPs (48.53 ± 1.62) > TiO2 NPs (41.23 ± 6.32). Compared with the previous results, biosynthesized silver NPs by Nothapodytes nimmoniana fruit extract illustrated 98.41 ± 20.49 mg EDTA/g extract [Citation63] which are similar with results of this investigation.
Total phenolic and TFC
It was used standard curve of gallic acid for quantitative measurement of total phenols. illustrates linearity of the calibration curve from 20 to 100 μg/ml concentration for gallic acid (r2=0.9824). The TPC of the methanolic leaf extract, Ag, Cu and TiO2 NPs were respectively 16.69 ± 1.73, 4.03 ± 1.45, 4.31 ± 1.1 and 3.6 ± 1.6 mg gallic acid equivalent (GAE)/g DW (). Based on a standard curve of rutin, determination of total flavonoids content (TFC) was quantitatively carried out and linearity of the calibration curve was obtained from 20 to 140 μg/ml concentration for rutin (r2=0.9998; ). The leaf extract, Ag, Cu and TiO2 NPs respectively show TFC by 7.09 ± 1.22, 2.23 ± 0.96, 2.06 ± 1.17 and 1.44 ± 0.57 mg rutin equivalent (RE)/g DW (). Also, a standard curve of (+)-catechin, measurement of total tannin was quantitatively carried out and linearity of the calibration curve was obtained from 20 to 100 μg/ml concentration for (+)-catechin (r2=0.9703; ). The leaf extract, Ag, Cu and TiO2 NPs, respectively illustrate TTC by 2.56 ± 0.56, 1.31 ± 0.23, 0.89 ± 0.38 and 0.46 ± 0.30 mg (+)-catechin equivalent (CE)/g DW (). There was significant difference (p ≤ 0.05) between total phenols/flavonoids content of leaf extract and three NPs. Although, TPC, TFC and TTC of leaf extract had significant difference compared to three NPs (p ≤ 0.05), but there was not meaningful difference between NPs. Also, among three types NPs, Ag NPs had higher TPC, TFC and TTC which may be resulted in more silver ion reduction than copper and titanium dioxide ions [Citation64].
Figure 13. Standard curve of extinction against gallic acid concentration y= 0.2293x − 0.2614; r2=0.9824 (a) rutin concentration y = 0.0587x − 0.0512; r2=0.9975 (b) and (+)-catechin concentration y = 0.0069x − 0.0133; r2= 0.9703.
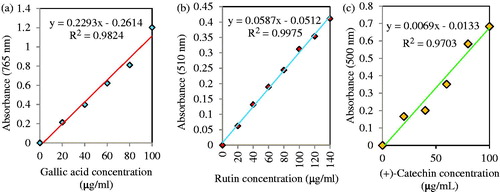
Table 2. Total phenolics flavonoids and tannin content of metahnoloic extract of A. haussknechtii leaf.
Similarly, in study of green synthesized Ag NPs by Nothapodytes nimmoniana fruit extract, there was the highest amount of flavonoid (283.33 ± 7.18 mg RE/g DW) and total phenolic (194.56 ± 3.15 mg GAE/g DW) for fruit extract than to silver NPs. Phenolic compounds have function as antioxidants by their redox properties. The total phenolic concentration could be applied as a rapid screening of antioxidant activities. The antioxidant activities of flavonoids, including flavones, flavanols and condensed tannins, as plant secondary metabolites are related to the presence of free OH groups, which they can reduce of metal ions to NPs. In this case, the metal ions can bind to the reducing flavonoids and stabilizing agents [Citation63].
Conclusions
In this investigation, an eco-friendly and cost-effective method was utilized for synthesis of Ag, Cu and TiO2 NPs by A. haussknechtii leaf aqueous extract. Characterization, morphology and antibacterial effects of NPs were measured by various methods. Results of this study illustrated that A. haussknechtii leaf aqueous extract with various groups of phytochemicals such as phenols and flavonoids had suitable property in green synthesis of Ag, Cu and TiO2 NPs. Several medicinal aspects of these NPs including antioxidant and antibacterial activity were evaluated. Detailed antibacterial effects of Ag NPs on E. coil ATCC 25922 cell surface were based on observing of (a) NPs on the cell surface, (b) membrane blebs, (c) membrane clumping and (d) bacterium damage. Also, we demonstrated that more antibacterial effects of Ag NPs, may be result from their smaller size and triangle shapes. However, concentrated surveys are necessary in order to determination of other aspects of NPs green synthesis such as chemical composition properties of leaf extract and their mechanisms effect.
Acknowledgements
The authors wish to appreciate Graduate school of Razi University for providing necessary facilities to carry out this work.
Disclosure statement
No potential conflict of interest was reported by the authors.
Related Research Data
References
- De Jong WH, Borm PJA. Drug delivery and nanoparticles: applications and hazards. Int J Nanomed. 2008;3:133–149.
- Arvizo RR, Bhattacharyya S, Kudgus R, et al. Intrinsic therapeutic applications of noble metal nanoparticles: past, present and future. Chem Soc Rev. 2012;41:2943–2970.
- Davies J, Davies D. Origins and evolution of antibiotic resistance. Microbiol Mol Biol Rev. 2010;74:417–433.
- Singh H, Du J, Singh P, et al. Ecofriendly synthesis of silver and gold nanoparticles by Euphrasia officinalis leaf extract and its biomedical applications. Artif Cells, Nanomed Biotechnol. 2017 [Aug 8];[1–8]. doi: http://dx.doi.org/10.1080/21691401.2017.1362417
- Kumar N, Desagani D, Chandran G, et al. Biocompatible agarose-chitosan coated silver nanoparticle composite for soft tissue engineering applications. Artif Cells, Nanomed Biotechnol. 2017 [Jun 22];[1–13]. doi: http://dx.doi.org/10.1080/21691401.2017.1337021
- Rafique M, Sadaf I, Rafique MS, et al. A review on green synthesis of silver nanoparticles and their applications. Artif Cells, Nanomed Biotechnol. 2017;45:1272–1291.
- Mittal AK, Chisti Y, Banerjee UC. Synthesis of metallic nanoparticles using plant extracts. Biotechnol Adv. 2013;31:346–356.
- Chahardoli A, Karimi N, Sadeghi F, et al. Green approach for synthesis of gold nanoparticles from Nigella arvensis leaf extract and evaluation of their antibacterial, antioxidant, cytotoxicity and catalytic activities. Artif Cells, Nanomed Biotechnol. 2017 [May 25];[1–10]. doi: 10.1080/21691401.2017.1332634
- Abad MJ, Bedoya LM, Apaza L, et al. The Artemisia L. genus: a review of bioactive essential oils. Molecules (Basel, Switzerland). 2012;17:2542–2566.
- Ferreira JFS, Luthria DL, Sasaki T, et al. Flavonoids from Artemisia annua L. as antioxidants and their potential synergism with artemisinin against malaria and cancer. Molecules (Basel, Switzerland). 2010;15:3135–3170.
- Nahrevanian H, Esmaeili B, Kazemi M, et al. In vivo antimalarial effects of Iranian flora Artemisia khorassanica against Plasmodium berghei and pharmacochemistry of its natural components. Iran J Parasitol. 2010;5:6.
- Chaisabai W, Khamhaengpol A, Siri S. Sericins of mulberry and non-mulberry silkworms for eco-friendly synthesis of silver nanoparticles. Artif Cells, Nanomed Biotechnol. 2017 [May 17];[1–8]. doi: http://dx.doi.org/10.1080/21691401.2017.1328686
- Sharifi S, Behzadi S, Laurent S, et al. Toxicity of nanomaterials. Chem Soc Rev. 2012;41:2323–2343.
- He Y, Ingudam S, Reed S, et al. Study on the mechanism of antibacterial action of magnesium oxide nanoparticles against foodborne pathogens. J Nanobiotechnol. 2016;14:54.
- Dakal TC, Kumar A, Majumdar RS, et al. Mechanistic basis of antimicrobial actions of silver nanoparticles. Front Microbiol. 2016;7:1831.
- Janthima R, Khamhaengpol A, Siri S. Egg extract of apple snail for eco-friendly synthesis of silver nanoparticles and their antibacterial activity. Artif Cells, Nanomed Biotechnol. 2017 [Apr 11];[1–7]. doi: http://dx.doi.org/10.1080/21691401.2017.1313264
- Dwivedi AD, Gopal K. Biosynthesis of silver and gold nanoparticles using Chenopodium album leaf extract. Colloids Surf A: Physicochem Eng Aspects. 2010;369:27–33.
- Odabasi Z, Paetznick V, Goldstein BP, et al. Disk diffusion-based methods for determining Candida parapsilosis susceptibility to anidulafungin. Antimicrobial Agents Chemother. 2003; 47:3018–3020.
- Bussmann RW, Malca-García G, Glenn A, et al. Minimum inhibitory concentrations of medicinal plants used in Northern Peru as antibacterial remedies. J Ethnopharmacol. 2010;132:101–108.
- Kelley KD, Olive LQ, Hadziselimovic A, et al. Look and see if it is time to induce protein expression in Eschericia coli cultures. Biochemistry. 2010;49:5405–5407.
- Arakha M, Saleem M, Mallick BC, et al. The effects of interfacial potential on antimicrobial propensity of ZnO nanoparticle. Sci Rep. 2015;5:9578.
- Wan C, Yu Y, Zhou S, et al. Antioxidant activity and free radical-scavenging capacity of Gynura divaricata leaf extracts at different temperatures. Pharmacognosy Mag. 2011;7:40–45.
- Villano D, Fernandez-Pachon MS, Moya ML, et al. Radical scavenging ability of polyphenolic compounds towards DPPH free radical. Talanta. 2007;71:230–235.
- González-Palma I, Escalona-Buendía HB, Ponce-Alquicira E, et al. Evaluation of the antioxidant activity of aqueous and methanol extracts of Pleurotus ostreatus in different growth stages. Front Microbiol. 2016;7:1099.
- Dinis TCP, Madeira VMC, Almeida LM. Action of phenolic derivatives (acetaminophen, salicylate, and 5-aminosalicylate) as inhibitors of membrane lipid peroxidation and as peroxyl radical scavengers. Arch Biochem Biophys. 1994;315:161–169.
- Blainski A, Lopes GC, de Mello JC. Application and analysis of the folin ciocalteu method for the determination of the total phenolic content from Limonium brasiliense L. Molecules (Basel, Switzerland). 2013;18:6852–6865.
- Khorasani Esmaeili A, Mat Taha R, Mohajer S, et al. Antioxidant activity and total phenolic and flavonoid content of various solvent extracts from in vivo and in vitro grown Trifolium Pratense L. (Red Clover). BioMed Res Int. 2015;2015:643285.
- Sun B, Ricardo-da-Silva JM, Spranger I. Critical factors of vanillin assay for catechins and proanthocyanidins. J Agric Food Chem. 1998;46:4267–4274.
- Amin M, Anwar F, Janjua MRSA, et al. Green synthesis of silver nanoparticles through reduction with Solanum xanthocarpum L. Berry extract: characterization, antimicrobial and urease inhibitory activities against Helicobacter pylori. IJMS. 2012;13:9923–9941.
- Díaz-Visurraga J, Daza C, Pozo C, et al. Study on antibacterial alginate-stabilized copper nanoparticles by FT-IR and 2D-IR correlation spectroscopy. Int J Nanomed. 2012;7:3597–3612.
- Upadhyay LSB, Kumar N. Green synthesis of copper nanoparticle using glucose and polyvinylpyrrolidone (PVP). Inorganic Nano-Metal Chem. 2017;47:1436–1440.
- Zhao L, Yu J. Controlled synthesis of highly dispersed TiO2 nanoparticles using SBA-15 as hard template. J Colloid Interface Sci. 2006;304:84–91.
- Ruparelia JP, Chatterjee AK, Duttagupta SP, et al. Strain specificity in antimicrobial activity of silver and copper nanoparticles. Acta Biomater. 2008;4:707–716.
- Morones JR, Elechiguerra JL, Camacho A, et al. The bactericidal effect of silver nanoparticles. Nanotechnology. 2005;16:2346–2353.
- Kumari J, Mathur A, Rajeshwari A, et al. Individual and co transport study of titanium dioxide NPs and zinc oxide NPs in Porous Media. PLoS ONE. 2015;10:e0134796
- Hussain I, Singh NB, Singh A, et al. Green synthesis of nanoparticles and its potential application. Biotechnol Lett. 2016; 38:545–560.
- Nasrollahzadeh M, Sajadi SM, Rostami-Vartooni A, et al. Green synthesis of CuO nanoparticles using aqueous extract of Thymus vulgaris L. leaves and their catalytic performance for N-arylation of indoles and amines. J Colloid Interface Sci. 2016;466:113–119.
- Vijayaraghavan K, Nalini SP. Biotemplates in the green synthesis of silver nanoparticles. Biotechnol J. 2010;5:1098–1110.
- Zheng J, Nagashima K, Parmiter D, et al. SEM X-ray microanalysis of nanoparticles present in tissue or cultured cell thin sections. Methods Mol Biol (Clifton, NJ). 2011;697:93–99.
- Gardea-Torresdey JL, Gomez E, Peralta-Videa JR, et al. Alfalfa Sprouts: a natural source for the synthesis of silver nanoparticles. Langmuir. 2003;19:1357–1361.
- Baskaran X, Geo Vigila AV, Parimelazhagan T, et al. Biosynthesis, characterization, and evaluation of bioactivities of leaf extract-mediated biocompatible silver nanoparticles from an early tracheophyte, Pteris tripartita Sw. IJN. 2016;11:5789–5806.
- Suárez-Cerda J, Espinoza-Gómez H, Alonso-Núñez G, et al. A green synthesis of copper nanoparticles using native cyclodextrins as stabilizing agents. J Saudi Chem Soc. 2017;21:341–348.
- Chellappa M, Anjaneyulu U, Manivasagam G, et al. Preparation and evaluation of the cytotoxic nature of TiO(2) nanoparticles by direct contact method. Int J Nanomed. 2015;10(Suppl 1):31–41.
- Logeswari P, Silambarasan S, Abraham J. Synthesis of silver nanoparticles using plants extract and analysis of their antimicrobial property. J Saudi Chem Soc. 2015;19:311–317.
- Kumar CMK, Yugandhar P, Savithramma N. Biological synthesis of silver nanoparticles from Adansonia digitata L. fruit pulp extract, characterization, and its antimicrobial properties. J Intercult Ethnopharmacol. 2016;5:79–85.
- Jagtap UB, Bapat VA. Green synthesis of silver nanoparticles using Artocarpus heterophyllus Lam. seed extract and its antibacterial activity. Ind Crops Products. 2013;46:132–137.
- Buszewski B, Railean-Plugaru V, Pomastowski P, et al. Antimicrobial activity of biosilver nanoparticles produced by a novel Streptacidiphilus durhamensis strain. J Microbiol, Immunol Infect. 2016 [Apr 18]. doi: http://dx.doi.org/10.1016/j.jmii.2016.03.002
- Das B, Dash SK, Mandal D, et al. Green synthesized silver nanoparticles destroy multidrug resistant bacteria via reactive oxygen species mediated membrane damage. Arab J Chem. 2017;10:862–876.
- Li H, Chen Q, Zhao J, et al. Enhancing the antimicrobial activity of natural extraction using the synthetic ultrasmall metal nanoparticles. Sci Rep. 2015;5:11033.
- Azam A, Ahmed AS, Oves M, et al. Size-dependent antimicrobial properties of CuO nanoparticles against Gram-positive and -negative bacterial strains. Int J Nanomed. 2012;7:3527–3535.
- Santhoshkumar T, Rahuman AA, Jayaseelan C, et al. Green synthesis of titanium dioxide nanoparticles using Psidium guajava extract and its antibacterial and antioxidant properties. Asian Pac J Trop Med. 2014;7:968–976.
- Bresee J, Bond CM, Worthington RJ, et al. Nanoscale structure–activity relationships, mode of action, and biocompatibility of gold nanoparticle antibiotics. J Am Chem Soc. 2014;136:5295–5300.
- Lemire JA, Harrison JJ, Turner RJ. Antimicrobial activity of metals: mechanisms, molecular targets and applications. Nat Rev Micro. 2013;11:371–384. Available from: http://www.nature.com/nrmicro/journal/v11/n6/abs/nrmicro3028.html#supplementary-information
- Zhou Y, Kong Y, Kundu S, et al. Antibacterial activities of gold and silver nanoparticles against Escherichia coli and bacillus Calmette-Guerin. J Nanobiotechnol. 2012;10:19.
- Dehghanizade S, Arasteh J, Mirzaie A. Green synthesis of silver nanoparticles using Anthemis atropatana extract: characterization and in vitro biological activities. Artif Cells, Nanomed Biotechnol. 2017 [Apr 3];[1–9]. doi: http://dx.doi.org/10.1080/21691401.2017.1304402
- Fröhlich EE, Fröhlich E. Cytotoxicity of nanoparticles contained in food on intestinal cells and the Gut Microbiota. IJMS. 2016;17:509.
- Chatterjee AK, Chakraborty R, Basu T. Mechanism of antibacterial activity of copper nanoparticles. Nanotechnology. 2014;25:135101.
- Dipankar C, Murugan S. The green synthesis, characterization and evaluation of the biological activities of silver nanoparticles synthesized from Iresine herbstii leaf aqueous extracts. Colloids Surf B: Biointerfaces. 2012;98:112–119.
- Sanna V, Pala N, Dessi G, et al. Single-step green synthesis and characterization of gold-conjugated polyphenol nanoparticles with antioxidant and biological activities. Int J Nanomed. 2014; 9:4935–4951.
- Netala VR, Bethu MS, Pushpalatha B, et al. Biogenesis of silver nanoparticles using endophytic fungus Pestalotiopsis microspora and evaluation of their antioxidant and anticancer activities. IJN. 2016;11:5683–5696.
- Firuzi O, Lacanna A, Petrucci R, et al. Evaluation of the antioxidant activity of flavonoids by “ferric reducing antioxidant power” assay and cyclic voltammetry. Biochim Biophys Acta (BBA)-General Subjects. 2005;1721:174–184.
- Reddy NJ, Vali DN, Rani M, et al. Evaluation of antioxidant, antibacterial and cytotoxic effects of green synthesized silver nanoparticles by Piper longum fruit. Mater Sci Eng C. 2014; 34:115–122.
- Mahendran G, Ranjitha Kumari BD. Biological activities of silver nanoparticles from Nothapodytes nimmoniana (Graham) Mabb. fruit extracts. Food Sci Hum Wellness. 2016;5:207–218.
- Saxena A, Tripathi RM, Zafar F, et al. Green synthesis of silver nanoparticles using aqueous solution of Ficus benghalensis leaf extract and characterization of their antibacterial activity. Mater Lett. 2012;67:91–94.