
 ?Mathematical formulae have been encoded as MathML and are displayed in this HTML version using MathJax in order to improve their display. Uncheck the box to turn MathJax off. This feature requires Javascript. Click on a formula to zoom.
Abstract
In the present study, sulforaphane (SFN)-loaded nanostructured lipid carriers (NLC) were developed and optimized for improved oral efficacy against cancer. The SFN-loaded NLC formulation was developed by melt emulsification ultrasonication technique and optimized by Box–Behnken statistical design. The optimized SFN-loaded NLC formulation composed of precirol® ATO 5 (solid lipid) and vitamin E (liquid lipid) as lipid phase (3% w/v), poloxamer 188 (1%) and Tween 80 (1%) as surfactant. The mean particle size, polydispersity index, zeta potential, entrapment efficiency (%) and drug loading (%) of optimized SFN-loaded NLC formulation was observed to be 145.38 ± 4.46 nm, 0.181 ± 0.023, −25.12 ± 2.36 mV, 84.94 ± 3.82% and 14.82 ± 3.46%, respectively. In vitro drug release studies showed that the release of SFN from optimized NLC formulation was significantly higher (86.52 ± 5.48%) compared to SFN suspension (38.47 ± 5.52%) up to 24 h. Ex vivo gut permeation studies revealed a very good enhancement in permeation of drug present in the NLC compared to plain SFN solution and were further confirmed by CLSM. MTT assay in different cancer cell lines showed that the optimized SFN-loaded NLC formulation exhibited significantly improved (p < .05) cytotoxicity compared to free SFN solution. SFN-loaded NLC formulation showed significantly improved antioxidant activity compared to free SFN solution. Furthermore, pharmacokinetic study on albino Wistar rats showed 5.04-fold increase in relative oral bioavailability with NLC (p < .05) compared to SFN suspension. Therefore, NLC represents a great potential for improved efficacy of SFN after oral administration.
Introduction
Sulforaphane (SFN) is a naturally occurring sulphur-containing isothiocyanate found in broccoli, Brussels sprouts, cauliflower, cabbage and other cruciferous vegetables, and chemically was named 1-isothiocyanato-4-(methylsulphinyl)-butane, acts as an efficient incidence reducer in a variety of tumours [Citation1,Citation2]. It has been revealed that SFN has a potent anti-carcinogen activity in different types of cancers such as pancreatic, breast, hepatic, bladder, prostate, osteosarcoma and melanoma [Citation3−6]. SFN acts by reducing NF-κB activity and influence expression of NF-κB mediated genes encoding adhesion molecules, anti-apoptotic factors, inflammatory cytokines and growth factors [Citation7]. SFN also modulates multiple cellular targets, which regulate several cellular activities including oxidative stress, apoptosis induction, cell cycle arrest, angiogenesis and metastasis suppression [Citation8]. However, its instability and sensitivity to oxygen, heat and alkaline condition confine the utilization of SFN in pharmaceutical industries [Citation9,Citation10].
Oral chemotherapy is preferred in the first place for its convenience for patients and its potential to improve patients’ quality of life. Oral therapy reduces the cost of inpatient and ambulatory patient care services, and ancillary support by healthcare personnel like nurses and technicians [Citation11]. However, oral delivery is restricted by various physicochemical constraints. The significant physicochemical constraints to the efficient oral absorption of anticancer drugs include poor solubility in the aqueous intestinal milieu. Additionally, they are either substrates for the biological transporters including P-glycoprotein (P-gp) or cytochrome P450, metabolizing enzyme or both, resulting in a significant loss owing to their expulsion or first pass metabolism. Furthermore, unfavourable physical–chemical properties of anticancer drugs along with unfavourable gastrointestinal tract (GIT) environment prevent their successful oral delivery [Citation12].
Nanostructured lipid carriers (NLCs), regarded as the second-generation solid lipid nanoparticles (SLNs), are attracting foremost consideration as an alternative colloidal drug carrier. NLCs deliver the drug without any modification to the drug molecule [Citation13−15]. These biodegradable and/or biocompatible lipid-based nanoparticles are composed of a mixture of spatially different lipid molecules; i.e. the solid lipid is blended with liquid lipid (oil) to overcome the limitations of SLNs. The absence of burst effect and easy scale-up technique make them promising carriers for drug delivery [Citation16,Citation17]. The differences in the structures of the solid and liquid lipids, there is the formation of a perfect crystal mixture. The mixture accommodates the drugs in molecular form or in amorphous clusters [Citation17]. This allows significantly higher encapsulation of both hydrophilic and lipophilic drug molecules, minimization of drug expulsion during storage, modulation of the drug release profile by varying the lipid matrix and significantly improves stability in different pH of GIT [Citation13−16]. NLCs by virtue of their lipophilic nature and particle size in nanometric range (<200 nm) are extensively explored as oral drug delivery system for a large number of chemotherapeutic drugs and shown excellent therapeutic efficacy in the studies performed in animals [Citation18−21].
It is reported that after 24 h of a single dose administration of SFN in rats, 72% of the SFN was detected in urine as N-acetylcysteine–SFN conjugate [Citation22,Citation23]. These data clearly indicate that there is the need of maintaining therapeutic levels of SFN for a prolonged period to provide an improved anticancer efficacy. A comprehensive literature search revealed no reports on the NLC and other oral lipid-based nanocarrier systems for SFN. Therefore, the specific objective of this study was to develop NLC for the oral delivery of SFN by ultrasonication technique. The SFN-loaded NLC was developed and characterized with simultaneous optimization by Box–Behnken statistical design. The optimized SFN-loaded NLC formulations were further evaluated for in vitro drug release profile, ex vivo gut permeation, antioxidant potential, in vitro cytotoxicity and pharmacokinetic activity.
Materials and methods
dl-Sulforaphane and vitamin E purchased from Sigma Aldrich (St. Louis, MO). Compritol 888 ATO (glyceryl behenate), Precirol ATO 5 (glyceryl palmitostearate), Labrasol and Capryol 90 were kindly donated by Gattefosse (Mumbai, India) as gift samples. Stearic acid and glyceryl monostearate were purchased from Qualikems fine chemicals, India. Tween 20, Tween-80 and canola oil were purchased from Merck (Schuchardt, Hokenbrunn, Germany). HPLC grade methanol, ethanol acetonitrile and ortho-phosphoric acid purchased from SRL (Mumbai, India). All the other reagents used in the study were of analytical grade.
Animals
All the animal experiments were carried out as per the duly approved animal protocol reviewed by the University Animal Ethics Committee (UAEC) of Jamia Hamdard (Hamdard University), New Delhi, India (Approval No. 1067). Albino Wistar rats (200−250 g each) of either sex were selected and kept under standard laboratory conditions (temperature 25 ± 2 °C and R.H. 55 ± 5%) with 12 h light/dark cycle at 25 ± 2 °C and were housed in polypropylene cages, with free access to standard laboratory diet (Lipton, Kolkata, India) and water ad libitum.
HPLC method for quantification of SFN
The RP-HPLC technique was developed and validated for the analysis of SFN in different samples. A Shimadzu model RP-HPLC equipped with quaternary LC-10 A VP pump, variable wavelength programmable UV/VIS detector (Waters, India Pvt. Ltd), SPD-10AVP column oven (Shimadzu, Kyoto, Japan), SCL 10AVP system controller (Shimadzu, Kyoto, Japan), Rheodyne injector fitted with a 20 μl fixed loop was used for sample injection. Data acquisition, analysis and reporting were done using Shimadzu CLASS-VP software. The HPLC method used for the SFN in formulation employed a mixture of 50% acetonitrile and 50% water as mobile phase C18 column (4.6 × 250 mm, 5 μm, Phenomenex®, Merck) at a flow rate 0.6 ml/min and column temperature 30 °C. Sample analysis was carried out at the detection wavelength of 202 nm.
Screening of excipients
The saturation solubility of SFN in different liquid lipids was determined by adding an excess amount of SFN in 1 ml of different oils in 2 ml glass vials. The glass vials were tightly closed and continuously stirred to reach equilibrium for 72 h at 37 ± 2 °C in a mechanical shaker. After that liquid lipid and SFN mixtures were centrifuged using a high-speed centrifuge (Sigma-3K30, Osterode am Harz, Germany) at 10,000 rpm for 10 min at 37 ± 2 °C [Citation14]. The supernatant was separated, dissolved in acetonitrile and saturation solubility was analyzed by RP-HPLC technique at 202 nm. For the selection of solid lipid, accurately weighed amount (1 g) of the solid lipids was taken and heated to 4–5 °C above their melting point with continuous stirring using magnetic stirrer with hot plate (Remi Instrument Ltd., Mumbai, India) at 200 rpm. SFN was added in increments of 1 mg until SFN was completely dissolved in the molten solid lipids and the amount of solid lipids required to solubilize SFN was calculated. The experiment was repeated in triplicate and results were represented as mean value (mg/g) ± SD [Citation14]. Binary lipid phase selected on the basis of good miscibility of solid and liquid lipid in the fixed ratio. For this, selected solid and liquid lipid was mixed in the ratio ranging from 90:10 to 10:90 in order to determine their miscibility. Lipid mixtures were stirred at 200 rpm for 1 h at 55 ± 2 °C using a magnetic stirrer with hot plate (Remi instruments Ltd., Mumbai, India). The samples were assessed visually for turbidity and phase separation. Surfactants were selected on the basis of observation of aqueous titration. Primary emulsions were prepared by melting and agitating the lipid mixture using a magnetic stirrer, to which different surfactants were added followed by drop-wise addition of double-distilled water. The preparations obtained were observed for clarity and homogeneity [Citation24].
Preparation of nanostructured lipid carriers
The SFN-loaded NLCs were prepared by melt emulsification ultrasonication technique with slight modification [Citation14]. Accurately weighed SFN, solid lipid (Precirol® ATO 5) and liquid lipid (Vitamin E) were blended and melted at 55 ± 2 °C to prepare a uniform and clear oil phase. Meanwhile, 10 ml of aqueous phase was prepared by dispersing surfactants i.e. poloxamer 188 and Tween 80 in the ratio of 1:1 in double-distilled water and heated to the same temperature. Then, the hot aqueous phase was added to the oil phase drop by drop at 55 ± 2 °C under magnetic stirring at 600 rpm. A transparent emulsion was obtained by continuous agitation and stirring using magnetic stirrer. Finally, obtained emulsion was subjected to sonication for 3–5 min through Ultrasonicator (Hielscher, Ultrasound UP-50 H, Germany) to develop NLC formulation.
The NLC dispersion was lyophilized for long-term stability. NLC dispersion was lyophilized by using mannitol (2.5% w/v) as a cryoprotectant. After the addition of mannitol, gentle mixing was done to ensure the proper mixing of the mannitol with the NLC formulation. After this, the samples were kept in a deep freezer at −20 °C for 24 h for freezing. The frozen samples were lyophilized using the freeze dryer for 24 h. The samples were obtained, stored carefully and used for further analysis.
Optimization of NLC by Box–Behnken statistical design
Box–Behnken statistical design was used to optimize the NLC formulation using Design-Expert software (Design-Expert® Software Version 10, State-Ease Inc., Minneapolis, MN). A three-factor, three-level study with 17 experimental runs was used. This experimental design was used to investigate the effect of independent variables on various dependent variables. The independent variables were lipid concentration (A), surfactant concentration (B) and sonication time (C) represented by low (−1), medium (0) and high (+1) respectively, while the dependent variables were particle size (Y1), % entrapment efficiency (Y2) and % drug loading (Y3) as described in . This design explicates the main effects, interaction effects and quadratic effects of the independent variables on the formulation characteristics [Citation25−27]. The polynomial equation generated from the Box–Behnken experimental design is given below.
Table 1. Various independent and dependent variables used in the Box–Behnken design for preparation of SFN-loaded NLCs.
Where Y is the response related to each factor level combination; b0 is constant; b1, b2 and b3 are linear coefficients, b12, b13 and b23 are interaction coefficients while b11, b22 and b33 are quadratic coefficients generated from the observed experimental values of response from experimental runs, while A, B and C are the coded intensity of independent variables. The terms A2, B2 and C2 represent the interaction and quadratic terms, respectively.
Characterization of optimized SFN-loaded NLC formulation
Particle size, polydispersity index (PDI) and zeta potential measurement
The particle size, PDI and zeta potential of NLC formulations were measured by dynamic light scattering using Zetasizer (Nano ZS90, Malvern Instruments Ltd, Worcestershire, UK). In order to determine the particle size, PDI and zeta potential, a suitably dilute suspension of lyophilized NLC was prepared in PBS (pH 6.8). The experiment was repeated in triplicate and results were represented as mean value ± SD.
Entrapment efficiency and drug loading
The entrapment efficiency and drug loading of NLC formulations were determined by centrifugation using high-speed centrifuge (Sigma-3K30, Osterode am Harz, Germany) for 15 min at 15,000 rpm. After centrifugation, the supernatant was separated, filtered using Millipore VR membrane (0.2 µm) and appropriately diluted with acetonitrile and examined by RP-HPLC technique at 202 nm to determine the unencapsulated drug. The experiment was repeated in triplicate and results were represented as mean value ± SD. Consequently, entrapment efficiency and drug loading were determined by the following equations [Citation28]:
where Wtotal was the total amount of SFN, Wfree was the amount of unencapsulated SFN and Wlipid was the weight of the lipids (solid + liquid lipid).
Transmission electron microscopy (TEM)
The optimized SFN-loaded NLC formulation was observed under TEM to determine the surface morphology and size of the formulation. The optimized SFN-loaded NLC formulation was diluted 50-fold with double distilled water and stained negatively by phosphotungstic acid and then dried on the carbon coated grid. Finally, it was observed using Morgagni 268 D (Fei Electron Optics, Netherland) transmission electron microscope (TEM) which operates at 100 kV.
Fourier transform infrared spectroscopy (FTIR)
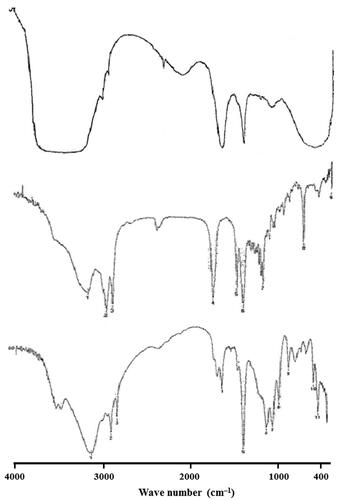
FT-IR spectroscopic study was performed using a Shimadzu FTIR Spectrophotometer (Shimadzu, Tokyo, Japan) and the FT-IR spectra were recorded in the wavelength region of 4000–400 cm−Citation1. The procedure consisted of dispersing a 5 mg sample in KBr and compressing into discs by applying a pressure of 5 tons for 5 min in a hydraulic press [Citation28]. SFN, Precirol® ATO 5 and lyophilized SFN loaded NLC in each case was placed in the light path and the spectrum obtained.
In vitro drug release study
In vitro release study was carried out according to USP XXIV method using 500 ml of freshly prepared dissolution medium, that is, simulated intestinal fluid pH 6.8. The apparatus was set at 100 rpm and was maintained at 37 ± 0.5 °C. The dissolution was carried out using dialysis bag (MW 12 kDa, Sigma–Aldrich) method [Citation14]. The dialysis bag was pre-treated by soaking it in the dissolution medium for 24 h prior to the commencement of each release experiment. Optimized SFN-loaded NLC formulation was placed in dialysis bag containing 5 ml of the dissolution medium tied with a thermoresistant thread. About 2 ml samples were withdrawn at regular time intervals (0.5, 1, 2, 4, 6, 8, 12 and 24 h) and the same amount (2 ml) of dissolution medium was replaced to maintain sink condition. The release of SFN from optimized NLC formulation was compared to the SFN suspension. Analysis for the SFN content was done after filtering the samples through a 0.45 μ filtering unit using the RP-HPLC technique. The experiment was repeated in triplicate and results were represented as mean value ± SD.
Release kinetics
To study the drug release kinetics of optimized SFN-loaded NLC formulation, the data obtained from in vitro drug release study was fitted to various kinetic models like zero-order model, first-order model, Higuchi matrix model and Korsmeyer−Peppas model. The correlation coefficient (R2) for each model was calculated. Model giving R2 nearer to 1 was selected as the best fit model for the drug release [Citation29,Citation30].
Stability study
The stability studies of the optimized SFN-loaded NLC formulation were conducted on the basis of the guidelines given by ICH Q1A (R2). The samples of SFN-loaded NLC formulation were stored under 25 ± 2 °C/65% ± 5% RH and 40 ± 2 °C/75% ± 5% RH in stability chamber (TH 90 S, Thermolab, Mumbai, India) for 3 months. SFN-loaded NLC samples were withdrawn at different time intervals i.e. 0, 30, 60 and 90 days. These were analyzed for particle size distribution, PDI, entrapment efficiency, drug loading, phase separation, the appearance of precipitation and re-dispersibility [Citation31].
Ex vivo gut permeation studies
The ex vivo gut permeation study of the optimized SFN-loaded NLC formulation was conducted by adopting a method previously reported and compared with the plain SFN solution under the same experimental conditions [Citation29,Citation32]. Albino Wistar rats fasted overnight with free access to water were sacrificed using anaesthetic ether just before the experiments. The intestine was surgically removed and flushed with saline. The small intestine was cut to obtain 5 cm long ileum. The plain drug (SFN) 1 mg/ml was prepared in methanol and filled in the mucosal side and both ends of the sac were ligated tightly. The sac containing drug solution was immersed in a jacketed glass assembly containing 100 ml of Kreb’s solution pre-warmed to 37 ± 2 °C by providing a continuous flow of hot water in the jacket. The sample (2 ml) was collected at predetermined time intervals from the serosal medium and replenished with fresh Kreb’s solution. The collected sample was filtered through 0.25 μm membrane filter and the amount of the drug permeated was determined by using the RP-HPLC technique. Similarly, the experiment was repeated with optimized SFN-loaded NLC formulation. The experiment was repeated in triplicate and results were represented as mean value ± SD. The apparent permeability coefficient (Papp) of plain drug (SFN) solution and optimized SFN-loaded NLC formulation was calculated using the following equation:
where F is the permeation flux (μg/cm2/min), A is the surface area of the barrier membrane and C0 is the initial concentration of the drug in the mucosal medium. Permeation flux (F), was calculated by taking the slope of the linear portion of the graph plot of the cumulative amounts of drug permeated (μg) through the sac against time (min).
Intestinal permeation study of optimized SFN-loaded NLC formulation by confocal laser scanning microscopy
Intestinal permeation study of the optimized SFN-loaded NLC formulation was conducted by adopting a method previously reported [Citation14,Citation25]. The small intestine was used for this study and was obtained as per the protocol given in ex vivo gut permeation section. The sliced section was tied at one end to create a pouch and the test samples, i.e. 0.03% plain rhodamine B solution and rhodamine B loaded NLC formulation were introduced with the help of a syringe. For the preparation of rhodamine B loaded NLC formulation, rhodamine was first dissolved in ethanol and then mixed in the preparation step of NLC formulation as described in material and method section. Each of these was tied and suspended in 200 ml of aerated Kreb’s solution maintained at 37 ± 2 °C. The samples were allowed to stand for about 4–5 h. Each tissue was then cut open and washed with normal saline solution to remove excess of the dye. The tissues were then fixed into different slides. The extent of the penetration of the Rhodamine B dye in the z-axis was analyzed in each sample by confocal laser scanning microscope (CLSM; Olympus Fluoview™ FV 1000).
MTT assay
MTT assay was conducted to evaluate the cytotoxic activity of SFN from the optimized SFN-loaded NLC formulation and an equivalent dose of free drug (SFN) solution in human lung adenocarcinoma cancer cells (MFC-7), human Caucasian colon adenocarcinoma cells (SW620) and murine melanoma cell lines (B16-F10). All the three cancer cells were carefully seeded in 96 well plates at a density of 5000 cells per well in 100 μl of Dulbecco’s Modified Eagle’s Medium (DMEM) supplemented with 10% foetal bovine serum, 1% l-glutamine, 1% sodium pyruvate, 1% non-essential amino acids and 100 mg/ml streptomycin and 100 U/ml penicillin. The cancer cells were left for incubation in a humidified chamber maintained at 37 °C and 100% relative humidity (R.H) supplied with 5% CO2. The cancer cells were treated with different concentrations of free SFN solution and an equivalent amount of optimized SFN-loaded NLC formulation for a period of 4 h. Following the 4 h treatment period, the treatments were removed and the cells were supplied with fresh DMEM and allowed to incubate for 24 h in a humidified chamber. After the incubation period, the cells were treated with fresh MTT reagent (250 μl, 5 mg/ml) and further incubated for 2 h in a humidified chamber. Excess media was blotted off, and 150 ml of DMSO was added to dissolve the purple formazan crystals. The amount of formazan formed is indicative of the number of viable cells. The plates were kept on the shaker for 5 min to solubilize the dye completely. The plates were then read on a microplate reader at 550 nm on Microplate Reader (BioTek Synergy HT) [Citation33,Citation34]. The data are expressed as the percent cell survival of control cell monolayers receiving just the media. The % cell survival was determined by using following equation.
IC50 values were determined by plotting optical density against concentration and expressed as concentration (μM).
Antioxidant activity
DPPH radical scavenging assay
The capacity of plant materials to catalyze the decomposition of free radicals can be determined by their ability to reduce the concentration of the stable free radical 1,1-Diphenyl-2-picrylhydrazyl (DPPH). The DPPH• radical scavenging ability of free SFN solution and SFN-loaded NLC was estimated by adapting a method previously reported [Citation33]. Both the free SFN solution (0.1 ml), as well as SFN-loaded NLC (0.1 ml) were mixed with 3.9 ml of 0.025% DPPH• solution and the mixture was shaken vigorously, followed by incubation for 30 min at 28 °C. The absorbance was measured at 515 nm by utilizing UV–Vis spectrophotometer. The free radical scavenging potential of free SFN solution and SFN-loaded NLC was determined as a decrease in the absorbance (%) with respect to control. The SFN concentration which reduced 50% of the absorbance of free radical DPPH• (IC50) was measured and % inhibition was calculated as follows.
The decrease in the concentration of remaining DPPH• was measured by using the calibration curve of Trolox as the standard and the antioxidant activity was measured in μg of Trolox equivalent/g of sample.
ABTS radical scavenging assay
The 2,2′-azinobis-(3-ethylbenzothiazoline-6-sulfonic acid) (ABTS) radical cation decolorization test is a spectrophotometric technique widely used for the assessment of antioxidant activity of different molecules. The experiment was conducted by adopting a method previously reported [Citation35]. In brief, ABTS+• radical cation was generated by reacting 2 mM of ABTS+• and 2.45 mM of potassium persulphate in water and incubating the resulting mixture for 12−16 h at room temperature in the dark conditions. The ABTS+• radical solution was diluted with phosphate buffer solution to an absorbance of 0.6 ± 0.05 at 734 nm. Trolox standard (10 μl) taken in different concentrations in phosphate buffer solution and was mixed with pre-diluted ABTS+• radical solution (1 ml), followed by vigorous shaking and incubation for 30 min at room temperature. Optimized SFN-loaded NLC formulation was diluted appropriately with phosphate buffer solution to produce the antioxidant activity within the effective range of calibration curve of Trolox standard (10–100 μg/ml). The per cent inhibition as Trolox equivalent antioxidant capacity (TEAC) was measured at 734 nm by utilizing UV–vis spectrophotometer and % inhibition was calculated as follows.
In vivo pharmacokinetic study
In vivo pharmacokinetic studies were conducted on albino Wistar rats to investigate the potential of the NLC formulation in improving oral bioavailability of sulforaphane (SFN). The dose calculation for the rats was based on body weight and was determined to be 30 mg/kg as per reported method [Citation36]. The animals were divided into two groups (n = 6) and were orally administered with plain SFN suspension (Group I), and SFN-loaded NLC formulation (Group II) using the 18-gauge oral-feeding needle. At the time of blood sampling, each animal was anaesthetized with diethyl ether and blood samples (0.5 ml) were collected from the retro orbital route into microcentrifuge tubes containing EDTA as anticoagulant. The blood samples were collected at the predetermined time points (pre-dose, 0.5, 1, 2, 3, 4, 6, 8, 12 and 24 h). The blood samples were immediately centrifuged at 5000 rpm for 15 min. The supernatant was separated and stored in a deep freezer at −20 °C until analyzed by the established RP-HPLC technique.
Statistical analysis
All the results obtained from the experiment were expressed as mean ± SD using Graph Pad Software (InStat 3.06, San Diego, CA) with more than three replicates for each experiment. Comparisons were made by using Student’s t-test and the level of significance was set p < .05.
Results and discussion
Screening of excipients
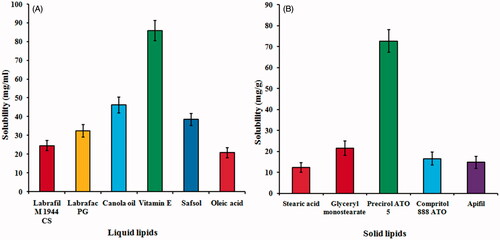
As per the results of solubility studies with different solid lipids (), SFN showed maximum solubility in Precirol® ATO 5 (72.64 ± 5.38 mg/g) whereas on screening of different liquid lipids (), vitamin E showed maximum solubility (85.96 ± 6.28 mg/ml) among all liquid lipids. Thus, Precirol® ATO 5 and vitamin E were selected as solid lipid and liquid lipid, respectively. Based on the visual observation for turbidity and phase separation, binary lipid phase (Precirol® ATO 5 and vitamin E) was selected in the ratio 7:3 w/w. Based on the clarity and stability of the primary emulsion formed by aqueous titration, a mixture of poloxamer 188 and Tween 80 (1:1) was selected as a surfactant. It was found that mixture of poloxamer 188 and Tween 80 in 1:1 ratio showed best emulsification capacity for binary lipids in comparison to the other surfactants/or mixture of surfactants. It was observed from the previous studies that a combination of surfactant is always better to produce small-sized NLCs with better storage stability [Citation37].
Figure 1. Solubility of SFN in different (A) liquid lipids, and (B) solid lipids.
Preparation and optimization of SFN-loaded NLC
A three-factor, three-level Box–Behnken statistical design was used for preparation and optimization of SFN-loaded NLC formulation () using Design-Expert software (Design-Expert® Software Version 10, State-Ease Inc., Minneapolis, MN). All individual and interactive effects of independent variables were investigated and all the responses of these runs fitted to first order, second order and quadratic models and found that best fit model was quadratic (p < .0001). The summary of results of regression analysis for responses Y1, Y2 and Y3 for fitting to the quadratic model is represented in . Three dimensional (3D) plots showed the interaction effects of the independent variables on the responses as well as their usefulness in studying the effects of two factors on one response at a time (). quantitatively compared the resultant experimental values of the responses with that of the predicted values.
Figure 2. Three dimensional (3D) response surface plots showing simultaneous influence of independent variables on response parameters: (A) particle size, (B) entrapment efficiency and (C) drug loading of SFN-loaded NLC formulated within Box–Behnken experimental design.
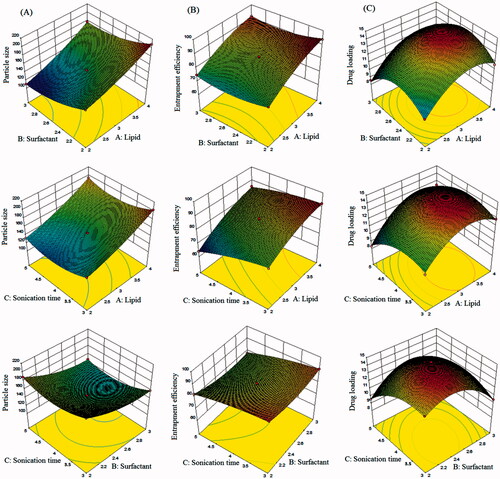
Figure 3. Linear correlation plots between actual and predicted values and the corresponding residual plots for (A) particle size, (B) entrapment efficiency and (C) drug loading.
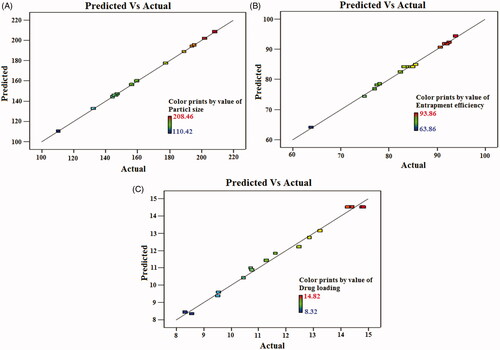
Table 2. Observed Box–Behnken experimental runs of SFN-loaded NLCs with their actual and predicted experimental value of Y1 (particle size), Y2 (entrapment efficiency) and Y3 (drug loading).
Table 3. Summary of regression analysis for responses Y1 (particle size in nm), Y2 (entrapment efficiency in %) and Y3 (drug loading in %) for fitting data to different models.
Fitting of data to the model
The results of regression analysis of different responses are given in . Larger values of the standard error for coefficients shows that the quadratic nature of the relationship. From , it is evident that the one independent variables viz. the concentration of total lipids (Precirol® ATO 5 and vitamin E) have positive effects on the response Y1 (particle size), Y2 (entrapment efficiency) and Y3 (drug loading). The concentration of surfactants (poloxamer 188 and Tween 80) has the positive effect on response Y2 (entrapment efficiency) and Y3 (drug loading) whereas the concentration of surfactants has an inverse effect on response Y1 (particle size). Sonication time has inverse effects on all the responses, i.e. Y1 (particle size), Y2 (entrapment efficiency) and Y3 (drug loading).
Effect of independent variables on particle size (Y1)
Considering all experiments in , observed average particle size was 161.56 nm, with minimum and maximum of 208.46 nm and 110.42 nm, respectively. As per polynomial equation, the concentration of total lipids (A) was directly dependent on particles size. Small particle size is most important criteria for the effective oral drug delivery of NLCs. It was found that the particle size of SFN-loaded NLCs increased with the increase of total lipid (Precirol® ATO 5 and vitamin E) concentration (). Increase in surfactant concentration (B) and sonication time (C) resulted in the decrease in the particle size (). This decrease in size at higher surfactant concentrations might be due to the reduction in interfacial tension between the aqueous and lipid phases, leading to the formation of emulsion droplets of smaller size [Citation38]. Higher concentration of surfactants efficiently stabilizes the nanoparticles by developing a steric barrier on the surface of nanoparticles, and thereby protects smaller nanoparticles and prevents their aggregation into bigger ones [Citation39]. Another possible explanation for such decrease in the particle size (Y1) might arise from the duration of sonication time (C), involved at the last stage of development of NLCs. Our results are in agreement with previous findings [Citation40,Citation41]. Such an effect of independent variables on particle size (Y1) is represented in 3D response surface plot (). quantitatively compared the resultant experimental values of the responses with that of the predicted values.
Effect of independent variables on entrapment efficiency (Y2)
Considering all experiments in , observed average entrapment efficiency was 83.6%, with minimum and maximum of 93.86 and 63.82%, respectively. The higher estimation of entrapment efficiency is desirable for NLCs so that the maximum amount of drug can be stacked, and the higher amount can reach to the target site. In our study, it was revealed by the model graphs that increasing the amount of lipid concentration (Precirol® ATO 5 and vitamin E) from 2% to 4% resulted in gradual increase in entrapment efficiency. This may be because of the hydrophobic nature of Precirol ATO® 5 and vitamin E that increased the encapsulation of drug in the lipid as the higher concentration of lipid is available to encapsulate the drug [Citation42]. Increase in surfactant concentration (B) and sonication time (C) resulted in a decrease in the entrapment efficiency of NLCs (). High surfactant level in the external phase might increase the partition of the drug from internal to the external phase of the medium. This increased partition is due to the increased solubilization of the drug in the external aqueous phase so more drug can disperse and dissolve in it [Citation39]. Increase in sonication time resulted in a decrease in entrapment efficiency because the decrease in particle size results in poor entrapment of drug. Our results are in agreement with previous findings [Citation40,Citation41]. Such an effect of independent variables on entrapment efficiency (Y2) is represented in 3D response surface plot (). quantitatively compared the resultant experimental values of the responses with that of the predicted values.
Effect of independent variables on drug loading (Y3)
Considering all experiments in , observed average entrapment efficiency was 11.88%, with minimum and maximum of 14.82 and 8.32%, respectively. The higher estimation of drug loading is desirable for NLCs so that the maximum amount of drug can be stacked, and the higher amount can reach to the target site. In our study, it was found that with an increase in the concentration of total lipid (A), drug loading (Y3) increases. Increase in the lipid concentration also reduces the efflux of drug from lipid matrix to the external phase [Citation43]. An increased drug loading was observed with the increase in the amount of liquid lipid (). Surfactant concentration (B) and sonication time (C) showed an inverse effect on drug loading. Our results are in agreement with previous findings [Citation41,Citation44]. Such an effect of independent variables on drug loading (Y3) is represented in 3D response surface plot (). quantitatively compared the resultant experimental values of the responses with that of the predicted values.
Optimization
The optimized SFN-loaded NLC formulation was selected based on the criteria of attaining the maximum value of entrapment efficiency and drug loading whereas minimizing the particle size by applying point prediction method of the Design Expert® software [Citation41]. Upon “trading of” various response variables and comprehensive evaluation of feasibility search and exhaustive grid search, the formulation composition with total lipid (3%), surfactant (2.5%), and sonication (4 min) was found to fulfil requisites of an optimum formulation, i.e. NLC5. The optimized SFN-loaded NLC formulation (NLC5) has the particle size of 145.38 ± 4.46 nm with entrapment efficiency 84.94 ± 3.82% and drug loading of 14.82 ± 3.46%, respectively. showed the quantitatively linear relationship between resultant experimental values of the responses with that of the predicted value of all dependents variables.
Characterization of optimized SFN-loaded NLC formulation
Particle size, polydispersity index (PDI) and zeta potential measurement
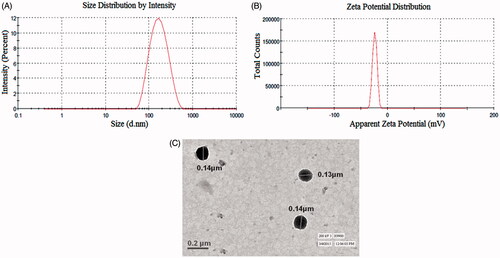
The particle size and PDI of the optimized SFN-loaded NLC formulation were found to be 145.38 ± 4.46 nm and 0.181 ± 0.023, respectively (). Zeta potential of the optimized SFN-loaded NLC formulation was found to be −25.12 ± 2.36 mV (). Zeta potential indicates the stability of the dispersed particles in the dispersion medium. Higher zeta potential value shows higher repulsion between the particles and particle aggregation is less likely to occur. A negative value of the zeta potential showed that optimized SFN-loaded NLC had gained good stability and dispersion quality [Citation14].
Figure 4. Image showing (A) particle size and particle size distribution, (B) zeta potential and (C) TEM analysis of optimized SFN-loaded NLC formulation.
Entrapment efficiency and drug loading
The entrapment efficiency of optimized SFN-loaded NLC formulation was found to be 84.94 ± 3.82% and drug loading was observed to be 14.82 ± 3.46%. High entrapment efficiency and drug loading are possible due to unique binary lipid matrix of NLCs.
Transmission electron microscopy (TEM)
The surface morphology and mean diameter of optimized SFN-loaded NLC formulation was visualized using TEM. TEM images showed almost spherical surface of the optimized SFN-loaded NLC formulation with uniform size distribution (<200 nm) and it corroborated the particle size measurements by zeta sizer. The results indicate that the particles were uniformly distributed and separated from each other. TEM photomicrograph of optimized SFN-loaded NLC formulation is given in .
Fourier transform infrared spectroscopy (FTIR) analysis
The FT-IR spectrum of SFN, Precirol ATO® 5 and optimized SFN-loaded NLC formulation was recorded and the characteristic peaks were compared for drug-excipient interaction (). The pure drug showed very strong characteristic absorption peak at 3230, 1460, 1123 and 1022 cm−Citation1 corresponding to the carbonyl group. A comparison of the FT-IR spectral data of pure drug with optimized SFN-loaded NLC formulation revealed that the characteristic peaks of the pure drug (SFN) slightly diminished in intensity and amplitude. These results clearly indicated that there is no significant physicochemical interaction between the original drug and excipients added. The negligible spectral variation in the final formulation is perhaps due to overlap of the common functional groups of the excipients.
Figure 5. FT-IR spectra of (A) SFN, (B) Precirol® ATO 5 and (C) SFN-loaded optimized NLC formulation.
In vitro release study
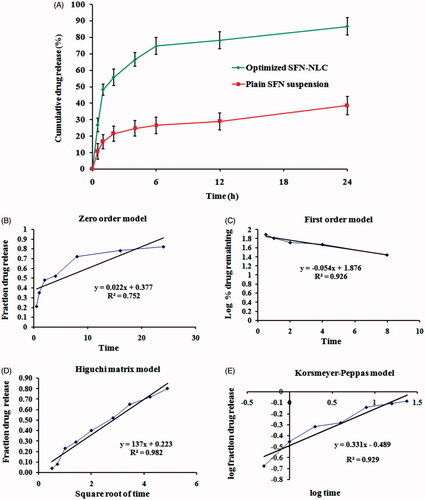
The % cumulative SFN released from optimized SFN-loaded NLC formulation and API suspension in simulated intestinal fluid pH 6.8 was plotted as a function of time (). The in vitro release study of the optimized SFN-loaded NLC formulation exhibited biphasic behaviour with initial burst release in the first 6 h followed by a sustained release pattern for 24 h. The initial burst release effect was measured as the maximum percentage of drug release in the first 6 h (74.69 ± 5.24%) and after 24 h the % cumulative drug release was measured as 86.52 ± 5.48%. At the same time, in vitro release study of the free SFN suspension was also carried out under the same experimental condition, which showed 38.47 ± 5.52% release of SFN after 24 h. Factors that can influence the release of the drug from the NLCs are solubility of the drug in the lipid, lipid matrix and its concentration, partition coefficient and particle size [Citation14].
Figure 6. Image showing (A) in vitro drug release profile of plain SFN solution, and optimized SFN-loaded NLC formulation and (B), (C), (D) and (E) represents the release kinetics models for optimized SFN-loaded NLC formulation.
Release kinetics
The obtained in vitro release data was incorporated into various release kinetic models described previously in the manuscript. Release kinetics models for optimized SFN-loaded NLC formulation is shown in . The highest value of the correlation coefficient (R2 = 0.982) was observed for Higuchi matrix model, followed by the Korsmeyer–Peppas model (R2 = 0.929), first-order model (0.926) and zero-order (R2 = 0.752). R2 values for all the models are presented in . The correlation coefficients (R2) obtained after fitting the in vitro release data to the respective model equation indicated that the best fit model was the Higuchi’s model (R2 = 0.982) for optimized SFN-loaded NLC formulation. Higuchi describes the drug release as a diffusion mechanism based on the Fick’s law, dependent on the square root of time. This relation can be used to describe the drug dissolution from various types of modified or controlled release pharmaceutical dosage forms [Citation29].
Table 4. In vitro release models fitting in terms of linear regression coefficient (R2).
Stability studies
The developed SFN-loaded NLC formulation was evaluated for particle size distribution, PDI, entrapment efficiency, drug loading, phase separation, the appearance of precipitation and re-dispersibility at pre-determined intervals of time. It was found that the optimized SFN-loaded NLC formulation exhibited particle size, PDI, entrapment efficiency and drug loading of 196.46 ± 8.64 nm, 0.192 ± 0.034, 76.47 ± 3.58% and 12.94 ± 3.78% respectively after 90 days at 25 °C. Optimized SFN-loaded NLC formulation does not exhibit phase separation and precipitate formation after 90 days at 25 °C. Furthermore, the developed NLC formulation exhibited good re-dispersibility after 90 days of study. The results of stability studies are summarized in .
Table 5. Stability data of the optimized SFN-loaded NLC formulation at 25 °C ± 2 °C/65% ± 5% RH and 40 °C ± 2 °C/75% ± 5% RH for 90 days (n = 3).
Ex vivo gut permeation studies
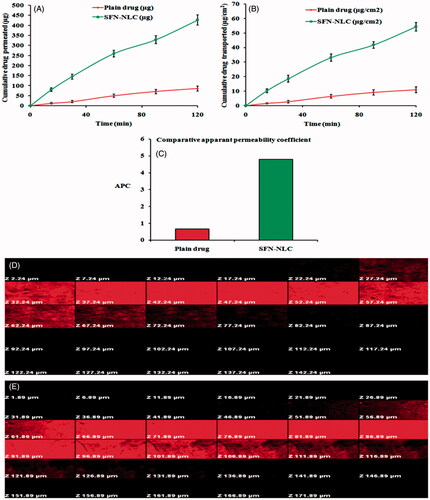
Ex vivo gut permeation studies suggested that the SFN-loaded NLC formulation composed of lipids (Precirol® ATO 5 and vitamin E) and surfactants (poloxamer 188 and Tween 80) have better permeation than plain API solution, measured at the same time with the same experimental conditions. The cumulative amount of drug permeated (μg) was plotted against time (min) to obtain the permeation flux (F) from the linear portion of the graph shown in . Further, the cumulative drug transported (μg cm−2) was plotted against time as shown in which clearly showed that a higher amount of the drug was transported through the intestinal sac from the SFN-loaded NLC formulation compared to plain SFN solution. Further, apparent permeability coefficient (APC; Papp) for the transport of plain SFN solution was compared with that for SFN-loaded NLC formulation in ileum as shown in . The Papp for the SFN-loaded NLC formulation and plain SFN solution was found to be 4.82 × 10⁻⁴ and 0.67 × 10⁻⁴ cm min−1, respectively. The enhancement ratio of SFN-loaded NLC formulation was found to be 7.194 compared to plain SFN solution (p < .05). The result indicated that the cumulative drug transport (μg cm−2) and Papp were found in the order SFN-loaded NLC formulation > plain SFN solution. NLCs composed of lipids and surfactants with the simultaneous reduction in particle size had proved to increase the permeability of the drug from the intestine. The combination of surfactants (poloxamer 188 and Tween 80) which are present in the developed SFN-loaded NLC formulation not only provides stability to the formulation but also mitigate intestinal efflux by inhibition of P-glycoprotein efflux pumps which are present in the villus tip of enterocytes in the GIT [Citation32].
Figure 7. Ex vivo gut permeation study showing: (A) cumulative amount of drug permeated (µg) versus time, (B) Cumulative drug transported (µg cm−2) versus time, and (C) Papp (ACP) for plain SFN solution and optimized SFN-loaded NLC formulation. Image (D) and (E) represents confocal laser scanning microscopic image of gut treated with plain rhodamine B solution, and optimized NLC formulation containing rhodamine B, respectively.
Intestinal permeation study of optimized SFN-loaded NLC formulation by confocal laser scanning microscopy
Confocal laser scanning microscopic (CLSM) study was performed to confirm the enhanced permeation of the optimized SFN-loaded NLC formulation through enterocytes. Intestinal tissues were viewed along the z-axis to analyze the depth of fluorescent permeate through the layers of the intestinal lumen. In case of plain rhodamine B solution, fluorescence was observed only up to 67.24 μm () whereas, in case of optimized NLC formulation with rhodamine B dye, the depth of permeation was extended to the level more than 121.89 µm (). Hence, the results from the CLSM study corroborate the hypothesis of better intestinal permeation with NLCs [Citation45].
MTT toxicity studies
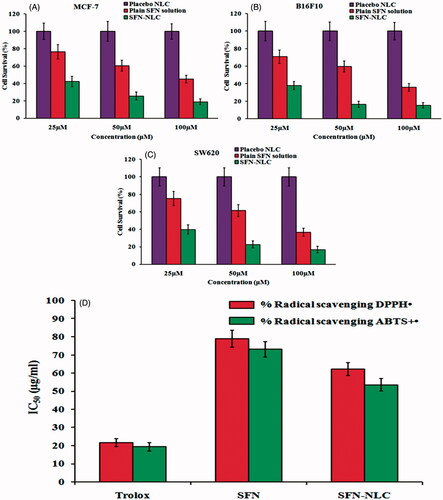
Optimized SFN-loaded NLC formulation, placebo NLC formulation, and plain SFN solution were tested for their in vitro cytotoxicity in a panel of cell lines including MCF-7, B16F10 and SW620 at different concentrations for 24 h. Placebo NLC formulation showed no cell cytotoxic activity. clearly indicated that optimized SFN-loaded NLC formulation exhibited significantly higher cell death compared to an equivalent dose of plain SFN solution (p < .05). This may be due to the fact that the higher amount of the SFN accumulated in the cancer cells from the NLC. The burst release of the SFN from the NLC at the initial stage made the SFN for transport into the cancer cells through nucleoside transporters. The biphasic release behaviour of the NLC showed great advantages in the delivery of chemotherapeutic drugs at the site of action. The result of MTT assay of optimized SFN-loaded NLC formulation, placebo NLC formulation, and plain SFN solution is depicted in .
Figure 8. Image showing MTT assay for placebo NLC formulation, plain SFN solution and optimized SFN-loaded NLC formulation with (A) MCF-7 human lung adenocarcinoma cancer cells, (B) B16-F10 murine melanoma cells and (C) SW620 human Caucasian colon adenocarcinoma cells. Image (D) represents DPPH and ABTS free radical scavenging assay of free SFN solution and optimized SFN-loaded NLC formulation. All data are mean ± SD (n = 3) with statistical difference at p < .05.
Antioxidant activity
DPPH assay is a highly sensitive antioxidant assay and therefore most commonly used. Here, the unpaired electron of DPPH• accepts hydrogen atoms from antioxidant resulting in the reduction to DPPH•−H, leading to change in the absorbance spectrum. Calculation of Trolox equivalent antioxidant capacity (TEAC) was done from the standard plot of Trolox. To calculate the TEAC, the gradient of the plot of the % inhibition of absorbance versus concentration plot for the antioxidant in question is divided by the gradient of the plot for Trolox. In the present study, DPPH• and ABTS+• exhibited IC50 of 21.58 ± 2.21 μg/ml and 20.43 ± 2.28 μg/ml, respectively, showing IC50 value to be higher for DPPH•. The ABTS+• assay is predominantly interesting as the absorption maxima at a wavelength of 734 nm exclude colour interference [Citation35]. The IC50 value of optimized SFN-loaded NLC formulation and SFN solution for ABTS+• was found to be 62.24 ± 4.54 μg Trolox equivalent and 78.98 ± 4.32 μg Trolox equivalent, respectively. While for DPPH•, the IC50 value was found to be 53.56 ± 3.48 μg Trolox equivalent for optimized SFN-loaded NLC formulation and 73.11 ± 3.56 μg Trolox equivalent for SFN solution (). The concentration of the tested samples at which it scavenges DPPH• radical by 50% in the solution is defined as IC50. A stronger antioxidant activity is indicated by a lower IC50 value. The radical scavenging potential of optimized SFN-loaded NLC formulation was found to be significantly higher (p < .05) compared to SFN solution which can be described as the high payload of NLC matrix and sustained release of SFN from NLCs.
In vivo pharmacokinetic study
The comparative pharmacokinetic profiles of optimized SFN-loaded NLC formulation and SFN suspension, following the oral administration, are shown in and the pharmacokinetic parameters are summarized in . At all-time points, the SFN plasma concentrations in rats treated with optimized SFN-loaded NLC formulation was significantly higher (p < .05) than those treated with SFN suspension. Cmax of optimized SFN-loaded NLC formulation was 3.78 fold higher (p < .05) compared to SFN suspension. Relative bioavailability of NLC formulation was 5.04-fold higher (p < .05) than the SFN suspension. Statistically, the difference in Cmax of optimized SFN-loaded NLC formulation was highly significant (p < .05) when compared with the SFN suspension. In addition, AUC0 → 24 of optimized SFN-loaded NLC formulation was 5475.32 ± 25.46 ng.h/ml which is highly significant (p < .05) compared to AUC0→24 of SFN suspension 1086.67 ± 14.82 ng h/ml. High differences in Cmax and AUC0→24 might be due to higher encapsulation of SFN in NLC matrix. Tmax for the SFN got prolonged from the optimized NLC formulation (7.53 ± 0.86 h) compared to SFN suspension (2.54 ± 0.48 h), which might be due to the sustained release of SFN from optimized NLC formulation. These results showed encapsulation of SFN into NLC resulted in its enhanced absorption after oral administration.
Figure 9. Plasma concentration–time profiles of SFN in rats after oral administration of optimized SFN-loaded NLC formulation and plain SFN suspension.
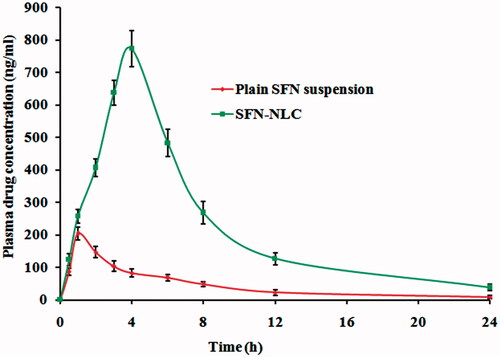
Table 6. Pharmacokinetic parameters of SFN in optimized NLC formulation and plain SFN suspension (n = 6, mean ± SD).
Conclusion
In the present study, SFN-loaded NLC formulations were successfully prepared by the melt emulsification followed by ultrasonication technique with high entrapment efficiency, drug loading, satisfactory particle size distribution and improved dissolution rate by optimizing different lipid/surfactant ratio. The optimized SFN-loaded NLC formulation was found to be effective as suggested by in vitro, ex vivo and in vivo assessments. A much deeper penetration to the intestine was observed with NLC formulation by using confocal laser scanning microscopy. MTT assay proved that the SFN-loaded NLC formulation has more affinity towards cancer cells and along with cytotoxic activity against cancer cells. Furthermore, the pharmacokinetic study revealed that the optimized SFN-loaded NLC formulation showed many folds increased relative oral bioavailability compared to SFN suspension. Thus, SFN-loaded NLC formulation represents an important and valuable strategy for treatment of cancer through oral administration.
Acknowledgements
The authors are thankful to Dr. Manu Jaggi, Chief Scientific Officer, Dabur Research Foundation, Ghaziabad, Uttar Pradesh, India, for providing cell line facilities.
Disclosure statement
The authors report no conflicts of interest. The authors alone are responsible for the content and writing of this article.
Additional information
Funding
Related Research Data
References
- Zhang Y, Talalay P, Cho CG, et al. A major inducer of anticarcinogenic protective enzymes from broccoli: isolation and elucidation of structure. Proc Natl Acad Sci USA. 1992;89:2399–2403.
- Jackson SJ, Singletary KW. Sulforaphane inhibits human MCF-7 mammary cancer cell mitotic progression and tubulin polymerization. J Nutr. 2004;134:2229–2236.
- Clarke JD, Dashwood RH, Ho E. Multi-targeted prevention of cancer by sulforaphane. Cancer Lett. 2008;269:291–304.
- Parnaud G, Li P, Cassar G, et al. Mechanism of sulforaphane-induced cell cycle arrest and apoptosis in human colon cancer cells. Nutr Cancer. 2004;48:198–206.
- Hahm ER, Singh SV. Sulforaphane inhibits constitutive and interleukin-6-induced activation of signal transducer and activator of transcription 3 in prostate cancer cells. Cancer Prev Res. 2010;3:484–494.
- Rausch V, Liu L, Kallifatidis G, et al. Synergistic activity of sorafenib and sulforaphane abolishes pancreatic cancer stem cell characteristics. Cancer Res. 2010;70:5004–5013.
- Kallifatidis G, Rausch V, Baumann B, et al. Sulforaphane targets pancreatic tumour-initiating cells by NF-kappaB-induced antiapoptotic signalling. Gut 2009;58:949–963.
- Lampe JW. Sulforaphane: from chemoprevention to pancreatic cancer treatment? Gut. 2009;58:900–902.
- Jin Y, Wang M, Rosen RT, et al. Thermal degradation of sulforaphane in aqueous solution. J Agric Food Chem. 1999;47:3121–3123.
- Qian X, Hao L, Qipeng Y. Effect of temperature, pH and light on the stability of sulforaphane solution. Chinese Pharm J. 2007;142:193–196.
- Khurana RK, Mahajan M, Teenu, et al. The sojourn from parenteral to oral taxanes using nanocarrier systems: a patent review. Recent Pat Drug Deliv Formul. 2016;10:44–58.
- Ahmad J, Singhal M, Amin S, et al. Bile salt stabilized vesicles (Bilosomes): a novel nano-pharmaceutical design for oral delivery of proteins and peptides. Curr Pharm Des. 2017;23:1575–1588.
- Rizwanullah M, Ahmad J, Amin S. Nanostructured lipid carriers: a novel platform for chemotherapeutics. Curr Drug Deliv. 2016;13:4–26.
- Rizwanullah M, Amin S, Ahmad J. Improved pharmacokinetics and antihyperlipidemic efficacy of rosuvastatin-loaded nanostructured lipid carriers. J Drug Target. 2017;25:58–74.
- Jaiswal P, Gidwani B, Vyas A. Nanostructured lipid carriers and their current application in targeted drug delivery. Artif Cells Nanomed Biotechnol. 2016;44:27–40.
- Beloqui A, Solinís MÁ, Rodríguez-Gascón A, et al. Nanostructured lipid carriers: promising drug delivery systems for future clinics. Nanomedicine 2016;12:143–161.
- Khan A, Imam SS, Aqil M, et al. Brain targeting of temozolomide via the intranasal route using lipid-based nanoparticles: brain pharmacokinetic and scintigraphic analyses. Mol Pharm. 2016;13:3773–3782.
- Akhter MH, Rizwanullah M, Ahmad J, et al. Nanocarriers in advanced drug targeting: setting novel paradigm in cancer therapeutics. Artif Cells Nanomed Biotechnol. 2017;1–12. doi: https://doi.org/10.1080/21691401.2017.1366333
- Ling G, Zhang T, Zhang P, et al. Nanostructured lipid-carrageenan hybrid carriers (NLCCs) for controlled delivery of mitoxantrone hydrochloride to enhance anticancer activity bypassing the BCRP-mediated efflux. Drug Dev Ind Pharm. 2016;42:1351–1359.
- Shete HK, Selkar N, Vanage GR, et al. Tamoxifen nanostructured lipid carriers: enhanced in vivo antitumor efficacy with reduced adverse drug effects. Int J Pharm. 2014;468:1–14.
- Ahmad J, Akhter S, Rizwanullah M, et al. Nanotechnology-based inhalation treatments for lung cancer: state of the art. Nanotechnol Sci Appl. 2015;8:55–66.
- Conaway CC, Wang CX, Pittman B, et al. Phenethyl isothiocyanate and sulforaphane and their N-acetylcysteine conjugates inhibit malignant progression of lung adenomas induced by tobacco carcinogens in A/J mice. Cancer Res. 2005;65:8548–8557.
- Hanlon N, Coldham N, Gielbert A, et al. Absolute bioavailability and dose-dependent pharmacokinetic behaviour of dietary doses of the chemopreventive isothiocyanate sulforaphane in rat. Br J Nutr. 2008;99:559–564.
- Qidwai A, Khan S, Md S, et al. Nanostructured lipid carrier in photodynamic therapy for the treatment of basal-cell carcinoma. Drug Deliv. 2016;23:1476–1485.
- Ahmad J, Mir SR, Kohli K, et al. Quality by design approach for self nanoemulsifying system of paclitaxel. Sci Adv Mater. 2014;6:1778–1791.
- Ahmad J, Mir SR, Kohli K, et al. Effect of oil and co-surfactant on the formation of Solutol HS 15 based colloidal drug carrier by Box–Behnken statistical design. Colloids Surf A: Physicochem Eng Asp. 2014;453:68–77.
- Patil GB, Patil ND, Deshmukh PK, et al. Nanostructured lipid carriers as a potential vehicle for Carvedilol delivery: application of factorial design approach. Artif Cells Nanomed Biotechnol. 2016;44:12–19.
- Zhang T, Chen J, Zhang Y, et al. Characterization and evaluation of nanostructured lipid carrier as a vehicle for oral delivery of etoposide. Eur J Pharm Sci. 2011;43:174–179.
- Neupane YR, Srivastava M, Ahmad N, et al. Lipid based nanocarrier system for the potential oral delivery of decitabine: formulation design, characterization, ex vivo, and in vivo assessment. Int J Pharm. 2014;477:601–612.
- Sharma K, Hallan SS, Lal B, et al. Development and characterization of floating spheroids of atorvastatin calcium loaded NLC for enhancement of oral bioavailability. Artif Cells Nanomed Biotechnol. 2016;44:1448–1456.
- Soni K, Mujtaba A, Kohli K. Lipid drug conjugate nanoparticle as a potential nanocarrier for the oral delivery of pemetrexed diacid: formulation design, characterization, ex vivo, and in vivo assessment. Int J Biol Macromol. 2017;103:139–151.
- Ahmad J, Mir SR, Kohli K, et al. Solid-nanoemulsion preconcentrate for oral delivery of paclitaxel: formulation design, biodistribution, and γ scintigraphy imaging. Biomed Res Int. 2014;2014:984756.
- Singh A, Neupane YR, Panda BP, et al. Lipid based nanoformulation of lycopene improves oral delivery: formulation optimization, ex vivo assessment and its efficacy against breast cancer. J Microencapsul. 2017;34:416–429.
- Tran TH, Nguyen AN, Kim JO, et al. Enhancing activity of artesunate against breast cancer cells via induced-apoptosis pathway by loading into lipid carriers. Artif Cells Nanomed Biotechnol. 2016;44:1979–1987.
- Sanna V, Pala N, Dessì G, et al. Single-step green synthesis and characterization of gold-conjugated polyphenol nanoparticles with antioxidant and biological activities. Int J Nanomedicine. 2014;9:4935–4951.
- Kheiri Manjili H, Sharafi A, Attari E, et al. Pharmacokinetics and in vitro and in vivo delivery of sulforaphane by PCL-PEG-PCL copolymeric-based micelles. Artif Cells Nanomed Biotechnol. 2017;45:1728–1739.
- Tan SW, Billa N, Roberts CR, et al. Surfactant effects on the physical characteristics of Amphotericin-B containing nanostructured lipid carriers. Colloids Surf A: Physicochem Eng Asp. 2010;372:73–79.
- Liu J, Gong T, Wang C, et al. Solid lipid nanoparticles loaded with insulin by sodium cholate-phosphatidylcholine-based mixed micelles: preparation and characterization. Int J Pharm. 2007;340:153–162.
- Rahman Z, Zidan AS, Khan MA. Non-destructive methods of characterization of risperidone solid lipid nanoparticles. Eur J Pharm Biopharm. 2010;76:127–137.
- Moghddam SM, Ahad A, Aqil M, et al. Optimization of nanostructured lipid carriers for topical delivery of nimesulide using Box-Behnken design approach. Artif Cells Nanomed Biotechnol. 2017;45:617–624.
- Mishra A, Imam SS, Aqil M, et al. Carvedilol nano lipid carriers: formulation, characterization and in-vivo evaluation. Drug Deliv. 2016;23:1486–1494.
- Jenning V, Thünemann AF, Gohla SH. Characterisation of a novel solid lipid nanoparticle carrier system based on binary mixtures of liquid and solid lipids. Int J Pharm. 2000;199:167–177.
- Alam S, Aslam M, Khan A, et al. Nanostructured lipid carriers of pioglitazone for transdermal application: from experimental design to bioactivity detail. Drug Deliv. 2016;23:601–609.
- Aslam M, Aqil M, Ahad A, et al. Application of Box–Behnken design for preparation of glibenclamide loaded lipid based nanoparticles: optimization, in vitro skin permeation, drug release and in vivo pharmacokinetic study. J Mol Liq. 2016;219:897–908.
- Beloqui A, Solinís MÁ, Gascón AR, et al. Mechanism of transport of saquinavir-loaded nanostructured lipid carriers across the intestinal barrier. J Control Release. 2013;166:115–123.