
Abstract
Early detection of Parkinson’s disease (PD), as a dangerous neurodegenerative disease, is a key factor in the therapy or prevention of further development of this disease. We developed an electrochemical nanobiosensor for early detection of PD based on the quantification of circulating biomarker, miR-195. Exfoliated graphene oxide (EGO) and gold nanowires (GNWs) were used to modify the surface of screen-printed carbon electrode. A single-strand thiolated probe was designed for specific hybridization with target miRNA (miR-195), and doxorubicin was used as an electrochemical indicator for differential pulse voltammetry measurements. The results of scanning electron microscope imaging and cyclic voltammetry experiments confirmed the accuracy of the working electrode modification steps. The results of analytical performance nanobiosensor showed a high sensitivity of the biosensing with 2.9 femtomolar detection limit and dynamic range of 10.0–900.0 femtomolar. In addition, good selectivity for target miRNA over non-specific oligonucleotides (one and three base replacement in target miRNA, and non-complementary) was achieved. The results of real human serum analysis did not show any interference in the function of the biosensor. Based on the results, the miR-195 electrochemical nanobiosensor could be suggested for clinicians in the medical diagnosis of PD.
Introduction
Parkinson’s disease (PD) is known as one of the most common neurodegenerative disease in the world [Citation1–3]. By some estimations, PD frequency ranges from 1 to 2% in persons over 60 years of age causing serious clinical problems which might affect quality of life of the patients [Citation4,Citation5]. Besides, the growing number of incidence, limitation of current therapeutic agents, and also importance of inhibition of PD progression made the early detection of PD even more important [Citation6,Citation7]. Among several biomarkers discovered for early detection of PD, which are mostly proteins, the most recent ones are the circulating miRNAs [Citation8–11]. Aberrant expression of miR-195 in the serum of patients with PD has been proved in several publications so far, and it can be used as a reliable biomarker. As it is a blood-based biomarker, its sampling would be non-invasive and easy [Citation12,Citation13]; therefore, quantification of miR-195 in human serum was used in this research for early detection of PD.
Nanotechnology has been used for both diagnosis and therapeutics of the PD in advance medical studies worldwide [Citation14–16]. For PD diagnosis, several nanobiosensors have been developed so far based on the quantification of different biomarkers of PD such as dopamine [Citation17,Citation18], alpha-synuclein protein [Citation19], homovanilic acid [Citation20] and even PD-related genetic mutation [Citation21]. Nanobiosensors comprise the advantages of using nanomaterials and nanostructures in biosensors, especially electrochemical nanobiosensors. There are many reports regarding the positive effect of the application of nanotechnology for enhancing the sensitivity of electrochemical nanobiosensors [Citation22–25]. For the electrochemical nanobiosensor of PD detection, scientists have used different nanoparticles or nanostructures, such as single-walled carbon nanotubes [Citation18], multi-walled carbon nanotubes [Citation26], gold nanoparticles [Citation27], graphene [Citation17], graphene oxide nanoribbons [Citation28], electrochemically reduced fullerene-graphene oxide [Citation20], etc.
Quantification of miRNAs using nanobiosensors is one of the main challenges in analytical biochemistry and has attracted a lot of attention in the past decade [Citation23,Citation29]. Due to their advantages over the conventional methods of medical diagnosis, the electrochemical nanobiosensors are the most important and most attended types of miRNA detection in scientific publications [Citation23,Citation24,Citation30]. These miRNA electrochemical nanobiosensors can be implied for the quantification of different miRNAs for detection of different diseases, such as lung cancer [Citation31], breast cancer [Citation24], gastric cancer [Citation32], glioma [Citation33], Alzheimer [Citation34], etc. But, beside the electrochemical methods, there are other types of high-performance nanobiosensors such as fluorescent methods which can be applied for miRNA quantification and responded very well [Citation35–38].
Despite development of several miRNA biomarkers for disease like PD, there is no study regarding miRNA nanobiosensors for early detection of PD. Based on our literature review, this work is the first in this case. Herein, we developed an electrochemical nanobiosensor for quantification of miR-195 for early detection of PD based on a screen-printed carbon electrode (SPCE), which was modified with nanomaterials like exfoliated graphene oxide (EGO) and gold nanowires (GNWs) and also ssDNA-specific probes for hybridization with the miR-195 and Doxorubicin (Dox) as an electrochemical indicator.
Graphene is an attractive nanomaterial used in electrochemical nanobiosensor due to its larger surface area, higher electrical conductivity and better mechanical performance. The EGO as a reduced-graphene oxide has been used before in electrochemical nanobiosensors for increasing the surface of the working electrode [Citation39–43]. Dox is an intercalating molecule, which is a good choice for DNA-hybridization-based biosensors. Due to the intercalating nature of DOX, it can differentaite a single-strand oligo from a double-strand oligo. In addition, the Dox molecule has been reported as a strong electroactive molecule [Citation44–48].
Experimental
Materials
All the materials were purchased from Sigma-Aldrich Company (St. Louis, MO, USA) and were of analytical grade, including Gold nanowires (GNWs) (716944 ALDRICH, dispersion in water and contains CTAB as stabilizer). The Doxorubicin Hydrochloride (2.0 mg/ml) were obtained from Ebewe (Austria). The EGO were synthesized based on a previous protocol [Citation49]. In addition, protocols of solution preparation were taken from our previous studies [Citation24,Citation50].
Oligonucleotides were purchased from the TAG Copenhagen Company (Copenhagen, Denmark), including miR-195 (5'-TAGCAGCACAGAAATATTGGC-3′); specific thiolated single-strand probe for miR-195 (5′-GCCAATATTTCTGTGCTGCTA-3′); one-base mismatch oligonucleotide from miR-195 (5′-TAGCAGCACATAAATATTGGC-3′); three-base mismatch oligonucleotide from miR-195 (5′-TAGCCGCACAAAAATAGTGGC-3′) and non-complementary oligonucleotide from miR-195 (5′-GCATGATGTCACGCACGATTA-3′).
Electrochemical system
The electrochemical system of this research involved an Autolab potentiostat/galvanostat model PGSTAT 101 (EcoChemic, Utrecht, The Netherlands) connected to a computer with the NOVA software (version 2.0) and a SPCE (Model DRP-C110) (Dropsens Co., Llanera, Spain) with the working electrode of carbon; platinum as counter electrode and silver as reference electrode. In addition, the cyclic voltammetry (CV) and the differential pulse voltammetry (DPV) methods were used for the assessment of fabrication process and final quantification of the miRNA, respectively.
Nanobiosensor fabrication and characterization
To fabricate the nanobiosensor, the working area of the SPE was washed thoroughly with 50% ethanol and consequently with double-distilled sterilized water. Next, a drop of EGO solution (final concentration of 8.0 mg L−1) was placed on the cleaned SPE and alowed to dry in the room. Afterwards, a drop of GNWs (final concentration of 25.0 µg mL−1) was placed on the EGO-modified SPE and the electrode was kept in the sealed and humid container to be slowly dried. These steps of fabrication were checked and confirmed via field emission scanning electron microscope (FESEM) imaging (Zeiss Sigma model 500 VP FESEM) of the SPE surface.
After modification of the working electrode with the EGO and GNWs, a 3.0 µl of 220.0 nM solution of thiolated SSDNA probes was placed on the electrode and kept in the humid container for 90 min to be attached on the surface of GNWs. After a mild double-distilled water wash, the modified electrode was immersed in the solution of MCH and was washed again [Citation51]. The prepared nanobiosensor was used for quantification of the target miRNA in the solution for the required concentration. For this purpose, a 3.0 µl drop of the required concentration of target miRNA was dropped on the surface of the modified electrode and was kept isolated for 90 min and washed with the washing solution [Citation51]. The hybridized nanobiosensor was immersed in the 0.095 mM solution of Dox for 11 min to allow the Dox molecule being intercalated in the double-strand structure. Finally, the modified electrode was washed gently with the double-distilled water and the DPV (amplitude of 25 mV, a modulation time of 0.05 s, step potential of 50 mV) was performed in the 0.1 M PBS solution pH = 7.0.
After every modification step of the electrode, the CV experiments were performed in 1.0 mM K3[Fe(CN)6] in PBS solution within the potential range of 0.025–0.33 V and sweep rate of 0.02 V s−1. The resulted CV curves were compared for observing the changes made on the surface of the modified electrode.
In addition, the developed nanobiosensor was assessed by testing the solution of different oligonucleotides as well as the target miRNA. For this, a specific concentration of target miRNA was prepared and tested by hybridization with the prepared nanobiosensor and the DPV curve was saved. Next, a solution of one-base mismatched oligonucleotide (an oligo with one nucleotide difference with the target miRNA) was prepared and tested similar to the target miRNA. The same experiments were repeated for three-base mismatched oligonucleotide, non-complementary oligonucleotide and the biosensor without any hybridization (just ssProbe). Finally, all the DPVs were compared to assess the selectivity of the developed system.
Furthermore, the real sample study was performed for the developed electrochemical nanobiosensor. An isolated human serum was used as a medium for making a solution of target miRNA as a simulated sample of a patient with PD. Three concentrations of miR-195 (30, 100 and 400 fM of miR-195) spiked in the collected human serum for four replications were tested by the developed nanobiosensor. The resulted percentage of recovery and also percentage of relative standard deviation (RSD) of four replications were calculated.
Results and discussion
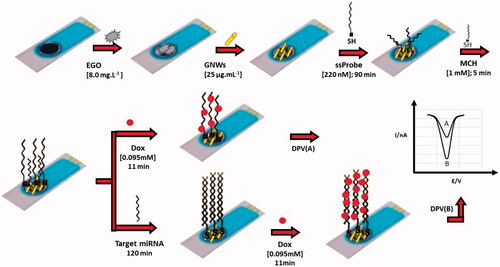
The electrochemical nanobiosensor for miR-195 quantification was fabricated based on the protocol explained in the “Experimental” section, which is explained schematically in . The name, concentrations and incubation time of every applied material is mentioned in this figure.
Figure 1. A Schematic for representation of miR-195 nanobiosensor for early detection of Parkinson’s disease.
Assessment of nanobiosensor preparation phases
Fabrication of the nanobiosensor was checked and confirmed sequentially using two reliable and recognized methods: CV and FESEM. In addition, characterization of the synthesized EGO was done by TEM imaging.
After synthesis of EGO using the aforementioned protocol, the TEM imaging was performed using a Zeiss-EM10C-80 KV transmission electron microscope (Germany) for characterization. Acording to the TEM image (), the shape and layer form of EGO sheets were approved to be of accurate form and shape of the EGO sheets for application in modification of electrode. In addition, the TEM imaging of the purchased GNWs is depicted in , which confirmed the size and shape of the gold nanowires.
Figure 2. Results of characterization studies. TEM images of (A) EGO, and (B) GNWs. SEM images of the electrode surface modified with (C) EGO, and (D) GNWs decorated on EGO layer. And (E) EDS spectrum of the electrode surface modified with EGO and GNWs.
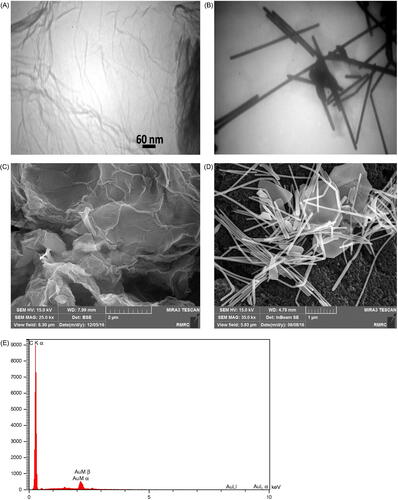
The FESEM imaging is known to be one of the main characterization methods for modification of the electrode by nanomaterials. Therefore, the FESEM images of the electrode after modification by EGO layer () and also after the addition of GNWs to the EGO-modified electrode (EGO/GNWs modified electrode) () are shown here. In addition, the energy-dispersive X-ray spectroscopy (EDS) analysis was done for the EGO/GNWs modified electrode and the resulted spectrum is represented in . The spectrum confirmed the presence of the elements like carbon and gold on the modified electrode surface, which is a confirmation for modifications with EGO and GNWs.
The CV measurement in [Fe(CN)6]3-/4- buffer is known as a reliable method for assessing the modifications on the electrode surface, which was used in this research after every modification phase of the nanobiosensor fabrication and the resulted curves were compared based on changes in both current and potential of oxidation/reduction peaks. As depicted in , the peak current increased after the addition of EGO layer (curve SPE-EGO) on the bare SPE electrode and consequently after the addition of GNWs (SPE-EGO + GNWs). The reasonable explanation is the high electrical conductivity of both nanomaterials, such as EGO and GNWs. But, after adding the ssDNA probes on the surface of the electrode and self-assembling on the GNWs (SPE-EGO + GNWs-Probe), the current decreased dramatically due to the blocking and repulsion of the electron towards the surface of the electrode by DNA probes which poses negative charges. Application of MCH for adjusting the orientation of the DNA probes made the electrode surface more reachable for the [Fe(CN)6]3-/4- ions, therefore the peak currect increased (SPE-EGO + GNWs-Probe + MCH). Finally, after hybridization of the target miRNAs with the self-assembled DNA probes (SPE-EGO + GNWs-Probe + miRNA), the peak current dramatically decreased because of increase in the volume of oligonucleotides with negative charges and also increase in the rate of spatial blockage of [Fe(CN)6]3-/4- ions. Similarly, positive shift occurred in the anodic peak potential, and also a negative shift in the cathodic peak potential from curve (SPE-EGO + GNWs-Probe) to curve (SPE-EGO + GNWs-Probe + miRNA). These potential shifts can also be seen in some other comparisons among CV curves.
Figure 3. Results of CV experiments for different stages of electrode surface modification during nanobiosensor fabrication. (CVs performed in 1.0 mM K3[Fe(CN)6] solution (pH =7.0)).
![Figure 3. Results of CV experiments for different stages of electrode surface modification during nanobiosensor fabrication. (CVs performed in 1.0 mM K3[Fe(CN)6] solution (pH =7.0)).](/cms/asset/25082fbe-e74c-410e-b034-9be3ec684665/ianb_a_1411930_f0003_c.jpg)
Determining best values for parameters of nanobiosensor preparation
In order to achieve the best value for parameters which are important in the final results of the electrochemical nanobiosensor, the optimization experiment was carried out sequentially for concentrations of GNWs, concentration and incubation time for ssDNA Probe, and concentration and incubation time for Dox. The rest of the parameters were applied based on the previous publications [Citation50,Citation52]. Value of the DPV currents of intercalated Dox in double-strand hybridized miRNA-ssProbes were assumed as a final indicator for better evaluation of effect of parameters.
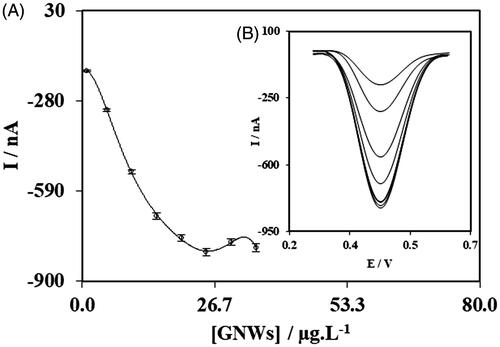
First, the concentration of GNWs decorated on the surface of EGO layer was assessed to achieve the best value for maximum peak current of the final DPV. For this, the concentrations between 1.0 to 35.0 µg/mL of GNWs was used and compared and the best value was 25.0 µg/mL of GNWs which was selected to be included in the fabrication protocol of the nanobiosensor () and the resulted DPVs are also represented in .
Figure 4. Results of experiments for determining optimum value of fabrication parameters; concentrations of GNWs.
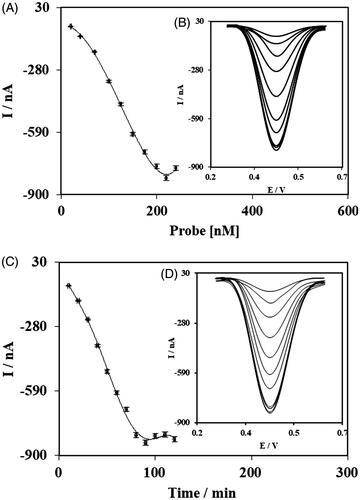
The optimize value of the ssProbe concentration and incubation time was also achieved by testing and comparing different levels (). The peak current of DPVs for different ssProbe concentrations, from 20.0 to 240.0 nM, are compared in and their respected DPV curves are shown in ; as it can be seen, the best result was achieved for the concentration of 220.0 nM. For the incubation time of the ssProbe, the comparison of the different time periods (10–120 min) showed that 90 min was the best (), which can be seen in the resulted DPVs ().
Figure 5. Results of experiments for determining optimum value of fabrication parameters; concentrations of ssDNA Probes (A) and their DPV curves (B), incubation time of ssDNA Probes (C) and their DPV curves (D).
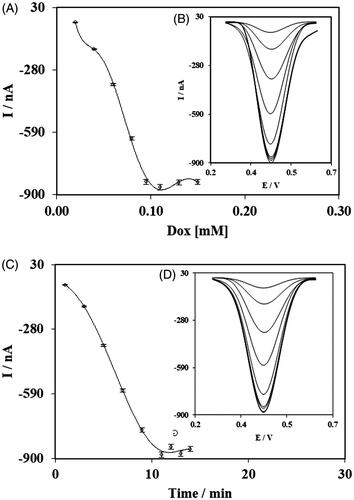
In addition, maximum peak current of DPVs for determining the best applied Dox concentration was for 0.095 mM of Dox (tested from 0.02 to 0.15 mM) (from as it can be seen in , from the resulted DPVs (). Afterwards, the incubation time period of the Dox was assessed and 11 min time period (was tested from 1 to 14 min) was selected to be used in the final fabrication protocol of the nanobiosensor ().
Figure 6. Results of experiments for determining optimum value of fabrication parameters; (A) concentrations of Dox (A) and their DPV curves (B); and incubation time of Dox (C) and their DPV curves (D).
Specificity evaluation
Selectivity of the DNA and/or miRNA biosensors is one of the most important specifications of the hybridization-based biosensors. Selectivity of the fabricated nanobiosensor was evaluated by testing in the solution of different oligonucleotides as well as the target miRNA, one-base mismatched oligonucleotide, three-base mismatched oligonucleotide, non-complementary oligonucleotide and the biosensor without any hybridization. The resulted DPV curves are shown in , along the DPV curve of bare SPCE electrode for comparison.
Figure 7. Results of DPV experiments for evaluation of nanobiosensor selectivity for target miRNA over non-specific oligonucleotides. (DPVs performed in 0.1 M phosphate buffer solution (pH 7.0)).
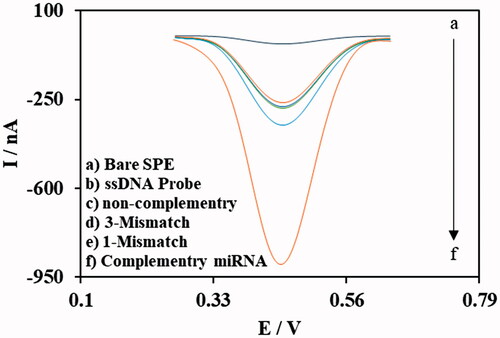
As presented in , current of the DPV curve of target miRNA is much higher and distinctive than the other non-specific oligos (one-base mismatch, three-base mismatch and non-complementary), non-hybridized ssDNA probes on the electrode and the bare SPCE electrode. Based on this result, it can be concluded that the specificity and selectivity of the fabricated electrochemical nanobiosensor poses a good selectivity for determining the target miR-195 over the non-specific oligos even with only one nucleotide difference. Such an opportunity could be helpful in the application of nanobiosensor in medical diagnosis without sample manipulation and preconcentrating the target miRNA.
Dynamic range and limit of detection
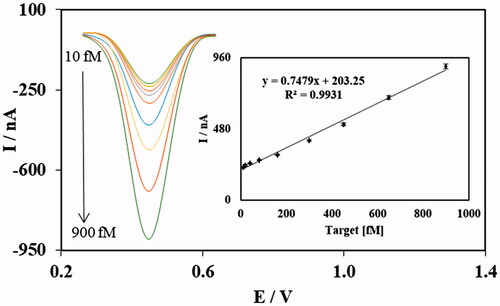
After optimization of the fabrication process, the electrochemical nanobiosensor was fabricated several times and tested in different concentrations of the target miR-195 in PBS solution pH = 7.0. The plot of concentration and DPV peak current showed that the linear correlation (R2 = 0.9933) between these two parameters was achieved for the nanobiosensor in miR-195 concentration between 10.0 and 900.0 fM, which is a relatively wide dynamic range for miRNA quantification. In addition, the calculation for the limit of detection based on previously reported method [Citation50] showed the sensitivity of the fabricated nanobiosensor was down to 2.9 fM. The analytical performance of the electrochemical nanobiosensor is comparable and somehow relatively better compared to previous publications regarding electrochemical biosensing and nanobiosensing of miRNAs [Citation23,Citation32,Citation53].
The repeatability of the fabrication procedure was also evaluated by making the nanobiosensor for five replications in 80.0 fM concentration of the target miRNA. The mean DPV peak current for five replications was 270 nA ±10 with RSD of 3.7%. The low RSD percentage of five replications representing the high repeatability of the fabrication process is one of the main advantages of the developed biosensing mechanism ().
Figure 8. DPV curves for linear range of target miRNA concentrations. Inset figure shows the linear correlation of DPV currents and regarding target miRNA concentrations (DPVs performed in 0.1 M phosphate buffer solution (pH 7.0)).
Real sample assay
Real human samples are a complicated mixture of molecules, ions and many other different types of moieties which can be a thread to function and also selectivity of every biosensing strategies. Evaluation of every new developed system for clinical detection in real sample environment is basically unavoidable. After spiking three different quantity of the target miRNA in a human serum, the resulted percentage of recovery and also percentage of RSD of replications were calculated, which is reported in .
Table 1. Results of performance of the sensing method in real sample.
The recovery percentages of the real sample studies for every used concentration of miR-195 were close to 100%, with an acceptable distance (). This is a good performance and reveals the acceptable function of the nanobiosensor in human serum environment. In addition, the low RSD percentages of the four replications for every tested concentration could be another valuable characteristic of the nanobiosensor in human serum environment. Such results for real sample study of the nanobiosensor make it a good candidate for application in assessment of human serum samples in clinics and diagnosis of PD.
shows the comparision of the features of previously published electrochemical nanobiosensors of miRNA with the developed nanobiosensor of miR-195.
Table 2. Comparison of the different published electrochemical nanobiosensors of miRNAs.
It can be concluded from that the developed electrochemical nanobiosensor with 10.0–900.0 fM dynamic range and detection limit of 2.9 fM is an acceptable sensitivity and wide linear range. In addition, the easy and cost-effective production of the nanobiosensor, and also its good response in the simulated real sample environment, make it a good potential method to be used in future clinical applications.
Conclusions
Nowadays, biosensors have attracted a lot of attention, especially those with the applied nanomaterials which led to the enhanced sensitivity. Herein, an SPCE electrode was modified with EGO and then decorated with the GNWs for increasing the effective surface area of electrode. An approved intercalated electrochemical label was also used to enhance the sensitivity and selectivity of the nanobiosensor. The resulted low detection limit (2.9 fM) and also a broad linear range (10.0–900.0 fM), as well as good selectivity and performance in real sample environment, make the fabricated electrochemical nanobiosensor a good candidate for quantification of the miR-195 for early detection of PD. The results were better than a vast number of the presented biosensors developed for miRNA quantification. In addition, a simple and cost-effective fabrication process is also the superiority of the designed biosensing mechanism. Therefore, it can be suggested to the laboratories and clinicians for actual usage in early detection of PD and hopefully help them embrace development of the disease and even cure it at the proper time.
Disclosure statement
There is no potential conflict of interest.
Related Research Data
References
- Pringsheim T, Jette N, Frolkis A, et al. The prevalence of Parkinson’s disease: a systematic review and meta-analysis. Mov Disord. 2014;29:1583–1590.
- Lakshminarayana R, Wang D, Burn D, et al. Using a smartphone based self-management platform to support medication adherence and clinical consultation in Parkinson’s disease results from the smart-pd randomised controlled trial. Value Health. 2016;19:A700.
- Lang AE, Lozano AM. Parkinson’s disease. First of two parts. N Engl J Med. 1998;339:1044–1053.
- Obeso JA, Rodriguez-Oroz MC, Goetz CG, et al. Missing pieces in the Parkinson’s disease puzzle. Nat Med. 2010;16:653–661.
- Klemann M, Martens M, Sharma M, et al. Integrated molecular landscape of Parkinson’s disease. NPJ Parkinson’s Dis. 2017;3:1.
- Miller DB, O’Callaghan JP. Biomarkers of Parkinson’s disease: present and future. Metabolism. 2015;64:S40–S46.
- Berg D, Lang AE, Postuma RB, et al. Changing the research criteria for the diagnosis of Parkinson’s disease: obstacles and opportunities. Lancet Neurol. 2013;12:514–524.
- Schwienbacher C, Foco L, Picard A, et al. Plasma and white blood cells show different miRNA expression profiles in Parkinson’s disease. J Mol Neurosci. 2017;62:1–11.
- Vallelunga A, Ragusa M, Di Mauro S, et al. Identification of circulating microRNAs for the differential diagnosis of Parkinson’s disease and Multiple System Atrophy. Front Cell Neurosci. 2014;8:156. doi: https://doi.org/10.3389/fncel.2014.00156
- Petillo D, Orey S, Choon Tan A, et al. Parkinson’s disease-related circulating microRNA biomarkers - a validation study. AIMS Med Sci. 2015;2:7–14.
- Shah P, Cho SK, Thulstrup PW, et al. MicroRNA biomarkers in neurodegenerative diseases and emerging nanosensors technology. Jmd. 2017;10:18.
- Cao X-Y, Lu J-M, Zhao Z-Q, et al. MicroRNA biomarkers of Parkinson’s disease in serum exosome-like microvesicles. Neurosci Lett. 2017;644:94–99.
- Ding H, Huang Z, Chen M, et al. Identification of a panel of five serum miRNAs as a biomarker for Parkinson’s disease. Parkinson Relat Disord. 2016;22:68–73.
- Soursou G, Alexiou A, Md Ashraf G, et al. Applications of nanotechnology in diagnostics and therapeutics of Alzheimer's and Parkinson’s disease. Curr Drug Metab. 2015;16:705–712.
- Linazasoro G. Country NfNDSGotB. Potential applications of nanotechnologies to Parkinson’s disease therapy. Parkinson Relat Disord. 2008;14:383–392.
- Ganesh HV, Chow AM, Kerman K. Recent advances in biosensors for neurodegenerative disease detection. Trends Anal Chem. 2016;79:363–370.
- Kim Y-R, Bong S, Kang Y-J, et al. Electrochemical detection of dopamine in the presence of ascorbic acid using graphene modified electrodes. Biosens Bioelectron. 2010;25:2366–2369.
- Alwarappan S, Liu G, Li C-Z. Simultaneous detection of dopamine, ascorbic acid, and uric acid at electrochemically pretreated carbon nanotube biosensors. Nanomedicine. 2010;6:52–57.
- Bryan T, Luo X, Forsgren L, et al. The robust electrochemical detection of a Parkinson’s disease marker in whole blood sera. Chem Sci. 2012;3:3468–3473.
- Rather JA, Khudaish EA, Munam A, et al. Electrochemically reduced fullerene–graphene oxide interface for swift detection of Parkinsons disease biomarkers. Sensor Actuat B. 2016;237:672–684.
- Kouloulia S, Lazaridou M, Christopoulos TK, et al. Multi-allele dipstick assay for visual genotyping of four novel SIRT1 gene variant alleles as candidate biomarkers for sporadic Parkinson disease. Microchim Acta. 2017;183:1–9.
- Syedmoradi L, Daneshpour M, Alvandipour M, et al. Point of care testing: the impact of nanotechnology. Biosens Bioelectron. 2017;87:373–387.
- Azimzadeh M, Rahaie M, Nasirizadeh N, et al. Electrochemical miRNA Biosensors: the benefits of nanotechnology. Nanomed Res J. 2017;1:158–171.
- Azimzadeh M, Rahaie M, Nasirizadeh N, et al. An electrochemical nanobiosensor for plasma miRNA-155, based on graphene oxide and gold nanorod, for early detection of breast cancer. Biosens Bioelectron. 2016;77:99–106.
- Shojaei S, Nasirizadeh N, Entezam M, et al. An electrochemical nanosensor based on molecularly imprinted polymer (MIP) for detection of gallic acid in fruit juices. Food Anal Methods. 2016;9:1–11.
- Liu A, Honma I, Zhou H. Simultaneous voltammetric detection of dopamine and uric acid at their physiological level in the presence of ascorbic acid using poly (acrylic acid)-multiwalled carbon-nanotube composite-covered glassy-carbon electrode. Biosens Bioelectron. 2007;23:74–80.
- Atta NF, Galal A, Abu-Attia FM, et al. Simultaneous determination of paracetamol and neurotransmitters in biological fluids using a carbon paste sensor modified with gold nanoparticles. J Mater Chem. 2011;21:13015–13024.
- Sun C-L, Su C-H, Wu J-J. Synthesis of short graphene oxide nanoribbons for improved biomarker detection of Parkinson’s disease. Biosens Bioelectron. 2015;67:327–333.
- Topkaya SN, Azimzadeh M, Ozsoz M. Electrochemical biosensors for cancer biomarkers detection: recent advances and challenges. Electroanalysis. 2016;28:1402–1419.
- Kerman K, Saito M, Tamiya E, et al. Nanomaterial-based electrochemical biosensors for medical applications. Trend Anal Chem. 2008;27:585–592.
- Liu S, Su W, Li Z, et al. Electrochemical detection of lung cancer specific microRNAs using 3D DNA origami nanostructures. Biosens Bioelectron. 2015;71:57–61.
- Daneshpour M, Omidfar K, Ghanbarian H. A novel electrochemical nanobiosensor for the ultrasensitive and specific detection of femtomolar-level gastric cancer biomarker miRNA-106a. Beilstein J Nanotechnol. 2016;7:2023–2036.
- Wang J, Yi X, Tang H, et al. Direct quantification of microRNA at low picomolar level in sera of glioma patients using a competitive hybridization followed by amplified voltammetric detection. Anal Chem. 2012;84:6400–6406.
- Isin D, Eksin E, Erdem A. Graphene oxide modified single-use electrodes and their application for voltammetric miRNA analysis. Mater Sci Eng C. 2017;75:1242–1249.
- Borghei Y-S, Hosseini M, Ganjali MR, et al. Label-free fluorescent detection of microRNA-155 based on synthesis of hairpin DNA-templated copper nanoclusters by etching (top-down approach). Sens Actuat B. 2017;248:133–139.
- Hosseini M, Ahmadi E, Borghei Y-S, et al. A new fluorescence turn-on nanobiosensor for the detection of micro-RNA-21 based on a DNA-gold nanocluster. Methods Appl Fluoresc. 2017;5:015005
- Hosseini M, Akbari A, Ganjali MR, et al. A novel label-free microRNA-155 detection on the basis of fluorescent silver nanoclusters. J Fluoresc. 2015;25:925–929.
- Li Y, Pu Q, Li J, et al. An “off-on” fluorescent switch assay for microRNA using nonenzymatic ligation-rolling circle amplification. Microchim Acta. 2017;184:4323–4330.
- Pumera M. Graphene in biosensing. Mater Today. 2011;14:308–315.
- Artiles MS, Rout CS, Fisher TS. Graphene-based hybrid materials and devices for biosensing. Adv Drug Deliv Rev. 2011;63:1352–1360.
- Pei S, Cheng H-M. The reduction of graphene oxide. Carbon. 2012;50:3210–3228.
- Ensafi AA, Alinajafi HA, Jafari-Asl M, et al. Cobalt ferrite nanoparticles decorated on exfoliated graphene oxide, application for amperometric determination of NADH and H2O2. Mater Sci Eng C. 2016;60:276–284.
- Kavinkumar T, Manivannan S. Uniform decoration of silver nanoparticle on exfoliated graphene oxide sheets and its ammonia gas detection. Ceram Int. 2016;42:1769–1776.
- Yau HC, Chan HL, Yang M. Electrochemical properties of DNA-intercalating doxorubicin and methylene blue on n-hexadecyl mercaptan-doped 5′-thiol-labeled DNA-modified gold electrodes. Biosens Bioelectron. 2003;18:873–879.
- Zunino F, Di Marco A, Zaccara A, et al. The interaction of daunorubicin and doxorubicin with DNA and chromatin. Biochim Biophys Acta. 1980;607:206–214.
- Agudelo D, Bourassa P, Bérubé G, et al. Intercalation of antitumor drug doxorubicin and its analogue by DNA duplex: structural features and biological implications. Int J Biol Macromol. 2014;66:144–150.
- Ting BP, Zhang J, Gao Z, et al. A DNA biosensor based on the detection of doxorubicin-conjugated Ag nanoparticle labels using solid-state voltammetry. Biosens Bioelectron. 2009;25:282–287.
- Hahn Y, Lee HY. Electrochemical behavior and square wave voltammetric determination of doxorubicin hydrochloride. Arch Pharm Res. 2004;27:31–34.
- Zhu Y, Stoller MD, Cai W, et al. Exfoliation of graphite oxide in propylene carbonate and thermal reduction of the resulting graphene oxide platelets. ACS Nano. 2010;4:1227–1233.
- Nasirizadeh N, Zare HR, Pournaghi-Azar MH, et al. Introduction of hematoxylin as an electroactive label for DNA biosensors and its employment in detection of target DNA sequence and single-base mismatch in human papilloma virus corresponding to oligonucleotide. Biosens Bioelectron. 2011;26:2638–2644.
- Azimzadeh M, Rahaie M, Nasirizadeh N, et al. Application of Oracet Blue in a novel and sensitive electrochemical biosensor for the detection of microRNA. Anal Methods. 2015;7:9495–9503.
- Aghili Z, Nasirizadeh N, Divsalar A, et al. A nanobiosensor composed of exfoliated graphene oxide and gold nano-urchins, for detection of GMO products. Biosens Bioelectron. 2017;95:72–80.
- Tian T, Wang J, Zhou X. A review: microRNA detection methods. Org Biomol Chem. 2015;13:2226–2238.
- Tran HV, Nguyen ND, Piro B, et al. Fabrication of a quinone containing layer on gold nanoparticles directed to a label-free and reagentless electrochemical miRNA sensor. Anal Methods. 2017;9:2696–2702.
- Miao X, Wang W, Kang T, et al. Ultrasensitive electrochemical detection of miRNA-21 by using an iridium(III) complex as catalyst. Biosens Bioelectron. 2016;86:454–458.
- Rafiee-Pour H-A, Behpour M, Keshavarz M. A novel label-free electrochemical miRNA biosensor using methylene blue as redox indicator: application to breast cancer biomarker miRNA-21. Biosens Bioelectron. 2016;77:202–207.
- Liu L, Chang Y, Xia N, et al. Simple, sensitive and label–free electrochemical detection of microRNAs based on the in situ formation of silver nanoparticles aggregates for signal amplification. Biosens Bioelectron. 2017;94:235–242.
- Zeng D, Wang Z, Meng Z, et al. DNA tetrahedral nanostructure-based electrochemical miRNA biosensor for simultaneous detection of multiple miRNAs in pancreatic carcinoma. ACS Appl Mater Interfaces. 2017;9:24118–24125.
- Wu X, Chai Y, Yuan R, et al. A novel label-free electrochemical microRNA biosensor using Pd nanoparticles as enhancer and linker. Analyst. 2013;138:1060–1066.
- Zhu W, Su X, Gao X, et al. A label-free and PCR-free electrochemical assay for multiplexed microRNA profiles by ligase chain reaction coupling with quantum dots barcodes. Biosens Bioelectron. 2014;53:414–419.
- Li F, Peng J, Wang J, et al. Carbon nanotube-based label-free electrochemical biosensor for sensitive detection of miRNA-24. Biosens Bioelectron. 2014;54:158–164.
- Yin H, Zhou Y, Zhang H, et al. Electrochemical determination of microRNA-21 based on graphene, LNA integrated molecular beacon, AuNPs and biotin multifunctional bio bar codes and enzymatic assay system. Biosens Bioelectron. 2012;33:247–253.