
 ?Mathematical formulae have been encoded as MathML and are displayed in this HTML version using MathJax in order to improve their display. Uncheck the box to turn MathJax off. This feature requires Javascript. Click on a formula to zoom.
Abstract
The drug with poor oral bioavailability necessitates the development of novel carrier for efficient drug delivery. This paper reports the rutin–phospholipid complex in polymer matrix for sustained delivery of rutin via the skin for the treatment of acute and chronic inflammatory diseases. Rutin in phospholipid complex (RNPs) are better soluble and permeable than the free rutin. The RNPs-loaded polymeric matrix patch with moderate adhesiveness was developed for convenient means of long term drug application on the skin. The patch was analysed for physicochemical properties, ex vivo skin permeability and in vivo efficacy in rat paw oedema model. The skin targeting efficacy was analysed by CLSM study. Optimized formulation (F2) showed 31 ± 2.32% and 26.56 ± 5.52% skin permeation at 24 h across excised rat skin and human cadaver skin, respectively. The sustained anti-inflammatory effect of the patch formulation in rat paw oedema model confirmed its unique in vivo efficacy over the conventional diclofenac gel. The CLSM study confirmed the localization of RNPs in the dermis for sustained anti-inflammatory effect. Our results suggest that the developed patch has a potential for long term site specific delivery of rutin in arthritic patients.
Introduction
Pain is one of the most frequent inflammatory symptoms encountered by orthopaedic surgeons and rheumatologists as it is one of the main reasons for patients seeking medical help. The nonsteroidal anti-inflammatory drugs (NSAIDs) represent a widely prescribed group of analgesic and anti-inflammatory agents used to treat a variety of acute and chronic painful conditions including osteoarthritis (OA) and rheumatoid arthritis (RA). Indomethacin was introduced in 1962 [Citation1] as the first “modern” NSAID. Now, several NSAIDs are commercially available in many countries in oral dosage forms and a few as parenteral and topical formulations. In the United Kingdom, 20–24 million prescriptions predominantly for oral NSAIDs are written each year, representing fully 5% of all National Health Service prescriptions [Citation2]. The oral NSAIDs are associated with a dose-dependent risk of gastrointestinal, cardiovascular, hematologic, hepatic and renal adverse events (AEs) [Citation3]. The use of NSAIDs in a topical formulation may be beneficial in reducing the likelihood of a patient experiencing adverse effects associated with systemic therapy. Several topical NSAIDs (ketoprofen gel or patch, ibuprofen gel or cream, diclofenac gel or patch) were developed to provide analgesia similar to their oral counterparts with less systemic exposure and fewer serious AEs [Citation4]. The topical analgesics represent an alternative treatment modality for patients experiencing acute pain who cannot or choose not to take oral therapies. Based on efficacy and safety benefits of topical NSAIDs, the American Academy of Orthopaedic Surgeons 2013 guidelines strongly recommend that topical NSAIDs be used for symptom management in patients with osteoarthritis of the knee [Citation5,Citation6]. The National Institute for Health and Clinical Excellence (NICE) 2008 guidelines also recommend topical NSAIDs as first-line therapy for osteoarthritis of the hand or knee. The NICE guidelines specifically recommend a trial of topical NSAIDs prior to therapy with oral NSAIDs, cyclooxygenase 2 inhibitors or opioids [Citation7]. The American College of Rheumatology 2012 guidelines also identify topical NSAIDs as one first-line therapy choice in osteoarthritis of the knee and strongly recommend the use of topical NSAIDs rather than oral NSAIDs in patients aged 75 years or older [Citation6,Citation8]. However, a systemic review of adverse effects with topical NSAIDs used in arthritic patients found 39.3% of patients reported application site adverse effects (dry skin, erythema, irritation and pruritus) and 17.5% of patients reported systemic adverse effects (GI upset and headache) with one reported case of GI bleeding. The same review reported 0–21% of patients treated with topical NSAIDs discontinued treatment due to adverse effects, which is similar to the rate for oral NSAIDs (0–25%) [Citation6,Citation9].
The efforts are underway to develop safer therapeutic strategies that inhibit the inflammatory process while reducing the side effects associated with long-term treatment. Researchers have found that phytochemicals from natural foods, spices and herbs, are safe and effective in the treatment and prevention of inflammatory diseases including OA and RA. The polyphenolic compounds derived from botanic sources such as rutin (3,3′,4 ′ ,5,7-pentahydroflavone-3-rhamnoglucoside or quercetin-3-rhamnosyl glucoside) have demonstrated anti-inflammatory activity in vivo. Extensive clinical trial addressed its pharmacokinetics, safety and efficacy against the acute and chronic inflammatory diseases in humans [Citation10–13]. Literatures related to anti-inflammatory activity of rutin suggested its usefulness in acute inflammation like pain, reddening and swelling and chronic inflammation where biological oxidation is the underlying reason, e.g. atherosclerosis, rheumatoid arthritis, neurodegenerative disorders. Guardia et al. [Citation14] investigated the anti-inflammatory activities of three flavonoids namely quercetin, rutin and hesperidin and results revealed that these compounds inhibited both acute and chronic phases of experimental model of inflammation on adjuvant arthritis in rat and rutin was most active in the chronic phases. Choi et al. [Citation15] reported rutin exerts anti-inflammatory effects in ultraviolet B-irradiated mouse skin by inhibiting the expression of cyclooxygenase-2 and inducible nitric oxide synthase. Kumar et al. [Citation16] put forward that nitric oxide modulation could possibly be involved in the effect of rutin against neuroinflammation. Kauss et al. [Citation17] observed that rutin significantly suppressed clinical sign of arthritis as well as circulating proinflammatory cytokines in a rat model. Another study suggested that the anti-inflammatory activity of rutin might be due to its modulation of the expression of the ASC (apoptosis-associated speck-like protein) complex that mediates inflammation [Citation18]. Nikfarjam et al. [Citation19] advocated that rutin may be considered as a therapeutic strategy for neutrophil-mediated inflammatory diseases. Despite the potent anti-inflammatory activities and high-safety profile of rutin, the limitations, such as poor aqueous solubility and low systemic bioavailability are still some obstacles that need to be overcome, which interns limit its therapeutic efficacy [Citation20–22]. The previous studies in human subjects reported slower GI absorption and only 17% absorption of orally administered rutin in men with peak plasma concentration at 6–7 h [Citation23–25]. Therefore, it imposes some restraints to its further therapeutic use especially via per oral administration [Citation26]. Furthermore, for the treatment of chronic inflammatory diseases, the drug molecule should present at the site of pain/inflammation for longer period of time to exert its therapeutic effect. Thus, the improvement of solubility, permeability across biomembrane and the release/bioavailability become the urgent and necessary issues.
It is well known that phospholipid is a vital component of cell membrane with good biocompatibility/biodegradability and low toxicity. It plays a major role in drug delivery due to its amphiphilic nature that can modify the release rate of drug for the enhancement of drug permeation across biological barriers. The development of amphilic rutin–phospholipid complex may prove to be a potential approach for improving solubility, drug stability, drug loading capacity and permeability across biomembrane compared to free rutin. Moreover, it has been reported that the diffusion of drug across lipid membrane and into target cells is accelerated when it is present as a complex with phospholipid [Citation27]. In the previous study, we reported rutin–phospholipid complexes (RNPs) with better skin permeability than the free rutin [Citation28]. Compared to free rutin, these RNPs enhanced the drug delivery efficacy across rat abdominal skin [Citation29].
The present study aims to develop RNPs embedded polymeric patch for long term site specific sustained delivery of rutin in the treatment of acute and chronic arthritic pain/inflammation.
Materials and methods
Materials
Rutin (RN) was purchased from TCI Chemicals (India) Pvt. Ltd., Chennai. Phosphatidylcholine (PC) (Egg lecithin) was purchased from Sigma Aldrich, Bengaluru, India. Eudragit RL 100 (ERL), Polyvinyl Pyrrolidone K30 (PVP) was purchased from Yarrow Chem Products, Mumbai, India. Rhodamine B was purchased from Sisco Research Laboratories Pvt. Ltd., Mumbai, India. Poly ethylene glycol 400 (PEG), methanol, dichloromethane, iso-propyl alcohol are all analytical grade and purchased from Loba Chem, Mumbai, India.
Animals
Male albino rats were used in the animal studies. The animals were treated according to the standard guidelines after getting approval from the Institutional Animal Ethical Committee vide reference number GIPS/IAEC/11/2013. The selected species shows certain amount of resemblance to human anatomy for meaningful inference for human applications.
Preparation and evaluation of rutin–phospholipid complex (RNPs)
The polyphenolic nature of rutin ensures its complexation with phosphatidylcholine [Citation30]. RNPs were prepared by refluxing a solution of RN and PC followed by solvent evaporation. RN was dissolved in 80 ml of methanol in a beaker. PC was dissolved in 80 ml of dichloromethane in a round bottom flux and drug solution was mixed into it. The mixture was refluxed for 3 h at 70 °C. It was then cooled and poured into the petri dish. The petri dish was kept open overnight at room temperature for evaporation of solvent. The product was then kept in a hot air oven at 60 °C for 2 h. The dried product was stored in desiccator for further studies.
The solubility of RNPs was checked by saturating 5 ml of various solvent systems (water, phosphate buffer pH 6.8, acetate buffer pH 4.5) [Citation31] with an excess amount of RNPs. The partition coefficient was determined by shake flask method in octanol/water and octanol/aqueous buffer system [Citation32].
The drug entrapment efficiency (%) was determined in a weighed quantity of RNPs in 50 ml of phosphate buffer of pH 6.8 in a beaker, magnetically stirred for 4 h and then allowed to stand for one hour. Clear liquid was decanted and centrifuged at 5000 rpm for 15 min in a centrifuge (Model CF10; Daihan Scientific Co. Ltd., Seoul, South Korea). The supernatant was filtered through 0.45 µ whatman filter paper, suitably diluted with phosphate buffer of pH 6.8 and analysed for rutin at 257 nm using a UV–VIS spectrophotometer (Model Shimadzu 1800; Shimadzu Corporation, Kyoto, Japan). The entrapment efficiency was calculated using the following formula [Citation33]: drug entrapment (%) = (actual amount of drug determined/theoretical amount of drug taken) × 100.
The size of the RNP particles was measured using a particle size analyser. The prepared RNPs were dispersed in isopropyl alcohol on a magnetic stirrer for 10 min. The particle size was measured using a Malvern size analyser (Model S90 Zetasizer; Malvern Instruments Ltd., Malvern, UK).
The morphology and internal orientation of RNPs was analysed by transmission electron microscopy (TEM). The RNPs samples were dispersed in water and a drop was placed on a carbon coated copper grid to form a thin film. The film was stained with 2% uranic acid and allowed to dry in air. The stained film was viewed and photographed using a JEOL (JEM 2100) transmission electron microscope.
Preparation and evaluation of RNPs containing polymeric patch
The RNPs with equimolar composition of RN (1.748 g) and PC (2 g) was selected as optimized batch for incorporation into polymeric patch. The RNPs containing sustained release polymeric patch was prepared by solvent casting method using polymeric blend of ERL 100 and PVP along with PEG 400 as plasticizer (). Free rutin or RNPs were dispersed in polymer solution in isopropyl alcohol. PEG 400 was added into the polymeric dispersion and mixed thoroughly by magnetic stirring for 15 min. The formulation in the viscous liquid state (4 ml) was poured into the pre-shaped aluminium mould (12 cm2, fabricated with aluminium sheet, thickness 0.4 mm) covered with pre-shaped aluminium foil (thickness 0.2 mm) to serve as impermeable backing and allowed to dry by solvent evaporation at room temperature for 24 h. The patches were then dried in a hot air oven at 60 °C for 2 h. The formulation along with the backing was removed from the mould after drying, so that patch formulation was protected from one side by the impermeable aluminium backing and stored for future use in a desiccator (without any desiccant) to prevent moisture entry.
Table 1. Composition of the polymeric patch prepared with free rutin and with rutin-phospholipid complexes (RNPs).
Physicochemical properties of the RNPs containing polymeric patch
The prepared patches were evaluated for various physicochemical properties by standard procedures. The weight uniformity of the patch was determined by taking the individual weight of three patches from each formulation and the average weight was calculated. The patch thickness was measured in triplicate using a Vernier caliper at six different points on each patch surface and the average value was calculated. The average surface area of three patches from each batch was determined by measuring the patch dimensions (length × width) using a standard measuring scale to ascertain the batch uniformity. The moisture content (%) was calculated as a difference between initial and final weight of the patch with respect to its initial weight. Initial weight was recorded before keeping the patch in the desiccator with desiccant. The final weight of the patch was the constant weight gained by moisture loss in desiccator. For moisture uptake capacity, a pre-weighed patch was kept in a desiccator with silica gel for 24 h. The desiccated patch was transferred to a desiccator containing saturated sodium chloride solution (RH 75%) at 25 °C for 24 h. The moisture uptake capacity (%) was calculated based on the change in the weight of the patch with respect to its initial weight. Water vapour transmission rate of the patch was determined by fixing a patch sample with the help of an adhesive over the brim of a glass vial previously filled with 1 g of fused calcium chloride. Then the vial was weighed and stored at 85% RH in a humidity chamber for a period of 24 h. The final weight of the vial was determined after 24 h to determine the weight gain and the water vapour transmission rate (gm/cm2/day) of each patch was calculated. The drug content uniformity of the patch was determined using 1 cm2 patch sample cut out from three different places of each patch. The patch sample was dissolved in 2 ml of methanol and subsequently diluted with phosphate buffer (pH 6.8) containing 50%v/v of PEG 400. The resulted solution was filtered through 0.45 µm filter paper. The filtrate was appropriately diluted with phosphate buffer (pH 6.8) containing 50%v/v of PEG 400 and analysed for rutin spectrophotometrically at 257 nm against a blank prepared using a drug free patch. The folding endurance of the patch was measured as the maximum number of times the patch can be folded without breaking. The patch was repeatedly folded and unfolded at the same line till its breaking and the value of folding endurance was recorded [Citation34]. The flatness of the patch was calculated by measuring constriction (%) of longitudinal strips and a zero percent constriction was considered to be equal to a hundred-percent flatness [Citation35]. Longitudinal strips were cut out from the patch and the length of each strip was measured using a standard measuring scale. The variation in the lengths due to the nonnuniformity in flatness of the strips was measured.
where, L1 = initial length and L2 = final length of strip.
The surface morphology of the patch was analysed by the scanning electron microscopy (SEM). A small patch sample was fixed on a copper stab and dried in a hot air oven at 70 °C for 30 min. The dried sample was then placed in a Fine Coat Ion Sputter (JFC-1100) for gold coating under vacuum for 15 min. The patch surface was then photographed under a scanning electron microscope (Model JSM 6360; ZEOL Ltd., Tokyo, Japan).
Adhesive property of the patch
Thumb tack test: The test was performed based on a previously reported protocol [Citation36,Citation37]. The thumb was pressed lightly on a patch for about 5 s and then quickly withdrawn. The relative tack property was detected using an arbitrary adhesion scoring system based on patch survival rate as to how easily, quickly and strongly the adhesive can form a bond with the skin. The scoring system applied was: Score 0 or 90% adhesion indicating no lifting off of the skin; Score 1 or 75–90% adhesion indicating some edges only lifting off of the skin; Score 2 or 50–75% adhesion indicating less than 50% of the system lifting off of the skin; Score 3 or <50% adhesion but not detached indicating more than 50% of the system lifting off of the skin without falling off; and Score 4 or patch completely off the skin.
Probe tack test: The patch specimen was placed on the working platform of the Texture Analyzer (Stable Micro Systems, Godalming, Surrey, UK) at room temperature and set with approach speed at 0.05 mm/s, return speed at 1.00 mm/s, target force at 1000.0 g and contact time at 1 s. The probe of the texture analyzer was lowered to come in contact with the patch and the adhesive nature of the patch was analysed. The mean adhesive force and the mean area under the curve were obtained from the adhesion graph [Citation38].
Ex vivo drug permeation study
The excised rat skin and human cadaver skin were used in the in vitro permeation study. The male Wister rats weighing 180–220 g were sacrificed by excess chloroform inhalation. The abdominal hairs were carefully removed using an electric razor (Model ES-SA40K; Panasonic Corporation, Osaka, Japan). A full thickness abdominal skin (5 × 5 cm) was excised and subcutaneous fat was removed carefully using a forceps. The skin sample was washed with distilled water; blotted dry and visually inspected for any damage. The integrity of the skin sample was confirmed under an optical microscope before the ex vivo permeation study. Skin samples with holes were not used in the experiments. The human cadaver skin was excised from the abdominal region of a male cadaver (43 years of age) within 12 h of the post-mortem at Guwahati Medical College Guwahati India). The human skin specimen was processed as explained for rat skin. The processed skin samples were stored at −20 °C until use in the permeation experiment.
The ex vivo permeation study was carried out in a modified Franz-type diffusion cell (vertical) consisting of a thermostatic water-jacketed receptor chamber (32 ml) and a donor chamber with diffusion area of 1.77 cm2 [Citation39]. The patch sample equivalent to effective diffusion area was fixed with its backing side in the donor chamber using fevikwick adhesive (Pidilite Industries Ltd., Mumbai, India). The rat and/or human cadaver skin sample was freeze thawed in phosphate buffer of pH 6.8 at room temperature for 1 h and mounted in the donor chamber using cotton thread keeping the stratum corneum (SC) side in intimate contact with the release surface of the patch. The donor chamber was inserted into the receptor chamber keeping the dermis in close contact with the receptor solution (50%v/v PEG 400 in phosphate buffer of pH 6.8) maintained at 37 ± 0.5 °C. The whole assembly was fixed on a magnetic stirrer using a clamp. Aliquot (2 ml) was withdrawn from the receptor chamber at predetermined time intervals up to 24 h and immediately replenished with the same volume of pre-warmed receiver solution to maintain sink condition. The aliquot withdrawn was filtered through 0.22 µm membrane filter and analysed for drug content by UV–visible spectrophotometer (Shimadzu 1800, Japan) at 257 nm. The cumulative amount permeated at each time interval was calculated and plotted against time.
The skin sample after permeation study was carefully removed from the diffusion cell, washed with distilled water and blotted dry. The treated skin area was cut into small pieces and homogenized in a tissue homogenizer. The drug was extracted in methanol, filtered through 0.22 µm membrane filter and analysed in the UV–visible spectrophotometer after suitable dilution with phosphate buffer (pH 6.8) PEG 400 (50% v/v) to determine the drug retained in the skin.
FT-IR and DSC of the human cadaver skin used in drug permeation study
The FT-IR and DSC studies of the treated and/or untreated skin were performed to investigate the fate of the accumulated RNPs in the skin and the changes in fluidity of the SC lipid after the dug permeation study. The skin sample after ex vivo permeation study was washed with distilled water, blotted dry with filter paper and completely dried in a freeze dryer (INSTIND Laboratory Freeze Dryer, MechaTech Systems Ltd., Bristol, UK) for 24 h. The dried skin was cut into a size of (0.5 × 0.5) cm2 and IR spectra were recorded using a FT-IR (Alpha FT-IR Spectrometer, Bruker, Billerica, MA, USA). The DSC thermograms of skin samples were recorded using a DSC (Model JADE DSC; PerkinElmer Inc., Waltham, MA, USA). The skin sample of about 5 mg was placed in an aluminium crimp pan and analysed between 30 and 350 °C with a heating rate of 10 °C/min under nitrogen environment [Citation40,Citation41].
Field emission scanning electron microscopy (FE-SEM) of the skin used in drug permeation study
The surface morphology of the skin with and/or without RNP patch treatment was analysed using field emission scanning electron microscopy (FE-SEM) images to observe the changes in the barrier properties of the skin. Small piece of about 5.0 mm2 of the skin exposed to RNP patch in the permeation study, was washed thoroughly using distilled water and blotted dry. The skin sample was fixed by storing at 4 °C for 4 h in 2.5% v/v glutheraldehyde solution, followed by storing at 4 °C for 24 h in 0.05 M cacodylate buffer (pH 7.4). The skin was then dehydrated in the series of acetone solution (30%, 50%, 70%, 95% and 100% v/v). The dehydrated skin was fixed on copper stab, fed into a sputter coater (Emitech Middle East FZCO, Sharjah, UAE) under high vacuum for 30 min for coating of 1–2 nm layers with Pd/Au. Skin surface was photographed in Carl Zeiss Sigma VP field emission scanning electron microscope [Citation42].
FE-SEM of the patch after drug permeation study
Field emission scanning electron microscopy photographs were used to investigate the changes in the patch surface and the RNPs vesicular structure after drug permeation study. The patch after the permeation study was removed carefully from the diffusion cell, washed with distilled water, blotted dry with tissue paper, and further dried in a desiccator for 24 h. Small section of the patch was fixed on copper grid and dried in hot air oven at 70 °C for 1 h. Sample was fed into a coater (Emitech Sputter Coater; Emitech Middle East FZCO, Sharjah, UAE) under high vacuum for coating of 1–2 nm layers with Pd/Au. Patch surface was photographed in a Carl Zeiss Sigma VP field emission scanning electron microscope.
In vivo anti-inflammatory study
The anti-inflammatory efficacy of the optimized RNP patch formulation was carried out by carrageenan induced hind paw oedema method in rats [Citation43]. The male albino rats, weighing approximately 180–220 g, were divided into three groups with six rats in each group. The left hind thigh of each animal was shaved without skin damage 12 h before starting the experiments. The rats were fasted overnight, but were allowed access to water ad libitum before the day of the experiment. Paw oedema was induced in the first group (control group containing six rats) by injecting 0.1 ml of a 1% w/v homogeneous suspension of carrageenan in double-distilled water subplantarly into the left hind paw. The rats in the second group (standard group) received marketed 1% diclofenac sodium gel (5 mg/kg of body weight) one hour before the carrageenan injection. The third group (test group) received RNP patch F2 (equivalent to 20 mg Rutin, patch area 2.4 cm2) to the shaved area one hour before the carrageenan injection. The volume of the left hind paw was measured at predetermined time interval for 0–24 h duration using a digital plethysmometer (INCO Instruments and Chemicals, Delhi, India).
Paw swelling was calculated as:
where V0 is the paw volume at time “0” and Vt is the paw volume at time “t”.
The percent (%) inhibition of oedema in treated groups was calculated against the control group using the following formula:
Results of the anti-inflammatory study were compared by one-way analysis of variance (ANOVA, one-way) followed by the least significant difference (LSD) as a post-hoc test was applied using SPSS Programe Version 9 Software (IBM Corporation, New York, NY, USA). The difference was considered as significant when p < .05.
Confocal laser scanning microscopy
Confocal laser scanning microscopy (CLSM) is an important technique to identify the skin transport pathways and localization of the fluorescent model compound in the tissue [Citation44]. In the present study, fluorescent model compound Rhodamine B (RhB, 1% w/w of PC) labelled rutin–phospholipid complex (RhBRNPs) was prepared by the same method of RNPs preparation. The RhBRNPs (214 mg equivalent to 100 mg of free RN) was then incorporated in the optimized patch formulation F2 by the same method of patch preparation. A fluorescent labelled control patch (RN 100 mg, RhB 1% w/w of RN) was also prepared to serve as control.
Confocal laser scanning microscopy study in vivo: The dorsal skin hairs of rats were shaved, fluorescent probe loaded patches were applied and left undisturbed for 24 h. The rats were kept in separate cages and maintained under optimum laboratory conditions. Food and water were allowed ad libitum. The rats were sacrificed after 24 h of patch application by cervical dislocation. The exposed skin was excised, washed with distilled water and frozen overnight in liquid nitrogen at −196 °C. The frozen skin samples were sectioned in a SHANDON CRYOTOME E (Thermo Electron Corporation, Waltham, MA, USA). Skin sections were examined in a Leica DMi8 confocal laser scanning microscope (Leica, Heidelberg, Germany) equipped with Leica TCS sp8 scanner and Leica Application Suit X Software. Optical excitation was carried out with an argon laser beam (at 520 nm) and fluorescence emission of RhB was detected above 580 nm. Skin sections were imaged under 20X objective in the x–y axis to find the penetration depth and deposition of the RhB-loaded RNPs in the whole thickness of the skin.
Confocal laser scanning microscopy study using human cadaver skin: The in vivo CLSM study using human volunteers was not carried out due to the existing ethical constraints and other limitations. Therefore, it was limited to in vitro CLSM study using human cadaver skin. Consequently, the fluorescent probe penetration was compared between the rat and human skin. The human cadaver skin specimen was prepared by the same method as explained in the drug permeation study. The experimental setup was same as in the ex vivo drug permeation study, except that the application of RhBRNPs-loaded patch for 24 h. At the end of the experiment, the skin was carefully removed from the diffusion cell and the exposed area was washed thoroughly with distilled water. The skin sample was processed and CLSM images were taken as described for in vivo CLSM study in rat model.
Stability study
Rutin in phospholipid complex containing patches were stored at 4 °C ± 2 °C, 25 °C ± 2 °C/60 ± 5% RH and 40 °C ± 2 °C/70 ± 5% RH for six months. Patch was firmly sealed separately and stored in a refrigerator at 4 °C under light protection in amber colour bottle. For the studies at 25 °C ± 2 °C/60 ± 5% RH and 40 °C ± 2 °C/70 ± 5% RH, patches were stored in a stability chamber (Model NEC2355; Nutronics India, New Delhi, India). Sampling was done on 0, 15, 30, 45, 60, 90, 120 and 180 days [Citation45,Citation46]. Drug content (%) was evaluated at the end of the specified period [Citation47].
Photo stability study of the patch
Rutin in phospholipid complex containing patch and free rutin samples were exposed to UV light in the UV-chamber (Macro Scientific Works (R), New Delhi, India) for 6 h. The samples were periodically collected at predetermined time intervals and analysed for drug content [Citation47,Citation48].
Statistical analysis
Experimental data are expressed as mean ± SEM and difference between groups were considered significant at p < .05 using one way ANOVA (Analysis of Variance) with Bonferroni’s or Dunnett’s post hoc tests to compare two replicate means, depending on the experimental setup.
Results and discussion
Preparation and evaluation of RNPs
The major roadblock in the clinical application of rutin is its poor aqueous solubility (0.0639 ± 0.008 mg/ml). The solubility of rutin in binary solution of phosphate buffer pH 6.8 with 50% v/v PEG 400 was found to be higher (1.8525 ± 0.012 mg/ml) than that in water. Rutin in the form of RNPs was found to be better soluble (3.464 ± 0.087 mg/ml) than pure rutin in phosphate buffer pH 6.8 containing 50% v/v PEG 400. The aqueous solubility of RNPs was found to be at 0.774 ± 0.054 mg/ml. The complex formation of rutin with PC is thus significantly enhanced its solubility than the free rutin (p < .05).
The partition coefficient of a drug molecule is an important property in the absorption of drug across the biological membrane. The drug molecule should have a partition coefficient (octanol/water) in the range of 1–4 [Citation49,Citation50] for effective dermal and/or transdermal application. Partition coefficient value when exceed 3 may retard drug permeation via skin due to the difficulties in permeating hydrophilic epidermis/dermis beneath the SC [Citation51,Citation52]. Partition coefficient values of pure rutin were found to be at 7.04 ± 0.28 (ocanol/water), 6.36 ± 0.33 (octanol/phosphate buffer pH 6.8) and 8.10 ± 0.44 (octanol/acetate buffer pH 4.5). The most satisfactory partition coefficient value for RNPs was observed at 3.11 ± 0.08 in octanol/phosphate buffer pH 6.8 partitioning medium. The complex formation of rutin with PC is thus significantly decreased its partition coefficient than the free rutin. It indicates the suitability of RNPs for dermal application. The RNPs will remain deposited in the skin for long-term site specific delivery of rutin.
Particle size analysis of RNPs indicates the formation of micronized particles of 1202 ± 3.23 nm. The formation of micronized RNP vesicular structure was confirmed in the TEM image reported earlier [Citation28]. The vesicular structure resulted from the effective physical enwrapment of the polyphenolic compound rutin by one or more PC molecules. The percent drug entrapment of RNPs was determined at 99.62 ± 0.93% suggesting uniform binding of drug and phosphatidylcholine in the RNPs. All the results suggested the suitability of RNPs for dermal application.
Preparation and physicochemical evaluation of RNPs containing polymeric patch
The polymeric dermal patches were prepared by solvent casting method without release liner and adhesive. The presence of plasticizer PEG 400 in the dried drug-polymer matrix imparts adhesive property to the prepared patch and no additional adhesive material was applied in the formulation [Citation53]. Patch formulation composed of 500 mg total polymer with ERL and PVP at 70:30 ratios and PEG at 20% w/w was selected as optimized patch. The patch formulation was evaluated for weight variation, thickness, surface area, % drug content, moisture content, moisture uptake, water vapour absorption rate, flatness and folding endurance to ascertain its desired physicochemical qualities. The various physicochemical data are tabulated in .
Table 2. Characteristics of the optimized RNPs containing polymeric patch F2 (mean ± SD, n = 3).
Weight variation, thickness and surface area of the patches were determined to ascertain batch uniformity. Surface area of all the patches was in the range of 12 cm2 and low standard deviations indicate good dimensional homogeneity. All patch formulations showed average drug content near to 100%. The results of moisture content, moisture uptake and water vapour transmission rate studies suggested that the patches tend to absorb moisture and care should be taken in their storage. The affinity for moisture was due to the presence of PVP in the drug–polymer matrix. The higher folding endurance value indicates that the patches will not break and would maintain their integrity with general skin folding when applied. Also these patch formulations showed 100% flatness indicating zero constriction and all patches had a smooth, flat surface and that smooth surface could be maintained when the patch is applied to the skin. The physicochemical data suggest the formation of good quality patch and that the drug release from the patch is governed by the polymer matrix composed of hydrophobic (Eudragit RL 100) and hydrophilic (PVP K30) polymers.
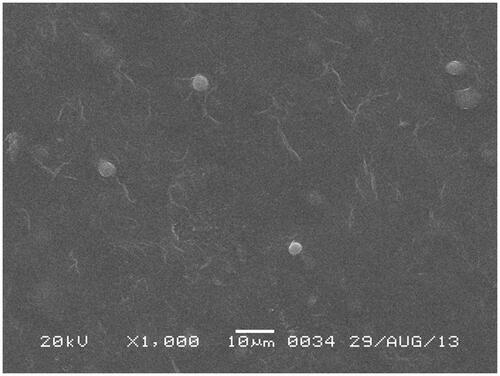
Scanning electron microscopy analysis revealed that the vesicular structure of RNPs were intact in the polymeric patch (), where numerous similar RNP particles are evenly distributed mostly beneath the patch surface. The patch surfaces were homogenous without any noticeable defects. The SEM photomicrograph suggests that phyto-phospholipid complexes of rutin unaffected by the patch ingredients and processing conditions and uniformly distributed in the polymer matrix.
Figure 1. SEM photographs of RNPs containing patch (F2).
Adhesive properties of the patch
Patch adhesiveness is evaluated by rolling ball tack test, probe tack test, loop tack test, shear adhesion or holding power, peel adhesion and thumb tack test [Citation36,Citation37]. Tack can be defined as the property that enables an adhesive to form a bond with the surface of another material upon brief contact under light pressure [Citation54]. Thumb tack of the patches was found to be moderate (++) for all the formulations ().
Table 3. Adhesion properties of the optimized RNPs containing patch F2.
The probe tack test by the texture analyzer measures the adhesive force (or stickiness) which is the peak force for detachment and the work of adhesion calculated as area under the curve and represents the total work required during the withdrawal of the probe. Results of the probe tack test are presented in . The optimized patch showed adhesive force at 353.1 ± 8.91 g and mean area under the curve at 18.0 ± 4.06 g s (). An increase in adhesive force was observed with the increase in polymer weight. Similar observations were also reported by Sezer et al. [Citation55]. They had observed that bioadhesive property was increased in the range of 0.076–1.771 mJ/cm2 with increase of polymer and lactic acid concentration in the film formulations.
Figure 2. Adhesion graph of the optimized RNP containing patch F2 obtained by a Texture Analyser (Stable Micro Systems, Godalming, Surrey, UK) at room temperature. The texture analyser was set for approach speed at 0.05 mm/s, return speed at 1.00 mm/s, target force at 1000.0 g and contact time for 1 s. The mean adhesive force and the mean area under the curve were obtained from the adhesion graph. The peak height indicates the required peel force of the RNP patch and a steep slope suggests the rigid nature of the patch.
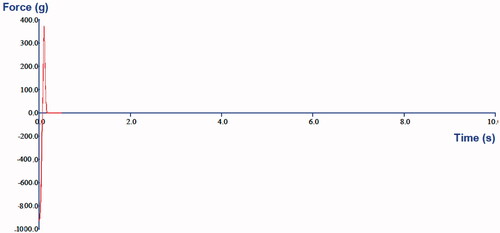
The adhesion graph from the texture analyser provides meaningful information about the material’s adhesiveness. The peak heights correlate the relative peel force of the adhesive systems under study and a steeper slope on the right side of the curve indicates a more rigid material, whereas a lean slope on the right side of the peak indicates softness or compressibility [Citation56]. The results obtained in the present study are in good agreement with the reports of Kerimoglu et al. [Citation38], where the optimized matrix type transdermal therapeutic systems containing captopril was developed using Eudragit polymer, PEG 400 and polyisobutylene adhesive. The adhesion properties of the optimized patch suggest that the patch would not give any pain on removal and it would give complete contact with the skin to ensure efficient drug delivery. The slope in the adhesion graph also suggests that the prepared patch is rigid enough and will not deform due to stress received during application.
Ex vivo drug permeation study
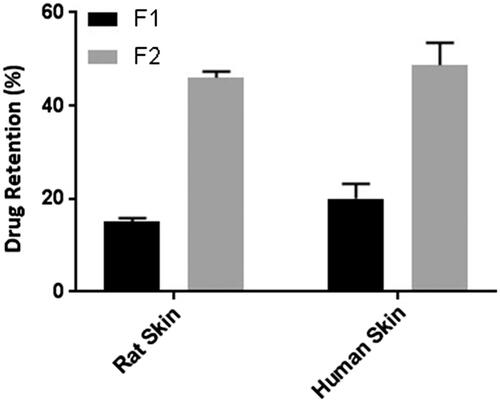
Skin permeation of patch containing free rutin (F1) and RNPs containing patch (F2) across excised rat abdominal skin was determined at 11.5 ± 1.84% and 31 ± 2.32%, respectively at the end of 24 h (). Whereas, the cumulative skin permeation of F1 and F2 across human cadaver skin was determined at 9.56 ± 2.73% and 26.56 ± 5.52%, respectively (). These results suggest that the RNPs are more permeable than free rutin (p < .05), across both the skin specimens. Our results are in good agreement with previous studies reported with phospholipid complex of sinigrin [Citation57], elagic acid [Citation58], curcumin [Citation59], puerarin [Citation60], oxymatrine [Citation61], lawsone [Citation62], ferrulic acid [Citation63], morin [Citation64] and umbelliferon [Citation65]. Compared to free drug, drug–phospholipid complex enhanced the rate and extent of drug permeation across the biomembrane. The skin extract obtained after permeation study with F1 and F2 showed accumulation of rutin (15 ± 0.8% and 46 ± 1.33%, respectively) in rat abdominal skin (). Whereas, the skin extract obtained from the human cadaver skin, drug content was found to be at 20 ± 3.16% and 48.66 ± 4.82%, respectively for F1 and F2. These results indicate a statistically significant difference (p < .05) in drug accumulation from F1 and F2 during permeation study across rat and human cadaver skin. In a similar study, Jun and co-workers [Citation66] reported higher skin retention of diammonium glycyrrhizinate in the form of phospholipid complex. Further, Pereira and co-worker [Citation67] found that administration of the amla extract (Phyllanthus emblica) via phospholipid complexes showed better skin retention compared to the conventional cream. Thus, a prolonged antioxidant effect was observed with phospholipid complex of amla extract. Comparison of the skin permeation data in the present study suggests that permeation of RNPs was slightly higher in the rat skin than in the human skin and this difference is statistically insignificant (p > .05). However, the skin retention of RNPs was higher in human skin than that in the rat skin and this difference is also statistically insignificant (p > .05). The higher thickness of human skin may be the reason for higher retention of RNPs in human skin [Citation68]. Retention of a higher quantity of drug in the skin layers will help in slow passage of rutin through the viable dermis and would give prolonged anti-inflammatory effect.
Figure 3. Drug permeation profile across rat abdominal skin in a modified Franz-type diffusion cell (vertical). Data points represent mean ± SD, n = 3. The Franz diffusion cell was consisted of a receptor chamber of 32 ml capacity and a donor chamber with diffusion area of 1.77 cm2. The patch sample equivalent to effective diffusion area was fixed with its backing side in the donor chamber keeping the stratum corneum side in intimate contact with the release surface of the patch and dermis in close contact with the receptor solution (50%v/v PEG 400 in phosphate buffer of pH 6.8) maintained at 37 ± 0.5 °C. The whole assembly was fixed on a magnetic stirrer using a clamp. The aliquot withdrawn for 24 h was filtered through 0.22 µm membrane filter and analysed for drug content by UV–visible Spectrophotometer (Shimadzu 1800, Japan) at 257 nm. The cumulative amount permeated at each time interval was calculated and plotted against time. Skin permeability of F2 was significantly higher than F1, p < .05.
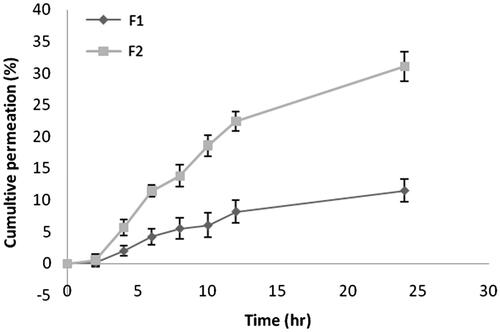
Figure 4. Drug permeation profile across human cadaver skin in a modified Franz-type diffusion cell (vertical). Data points represent mean ± SD, n = 3. The Franz diffusion cell was consisted of a receptor chamber of 32 ml capacity and a donor chamber with diffusion area of 1.77 cm2. The patch sample equivalent to effective diffusion area was fixed with its backing side in the donor chamber keeping the stratum corneum side in intimate contact with the release surface of the patch and dermis in close contact with the receptor solution (50%v/v PEG 400 in phosphate buffer of pH 6.8) maintained at 37 ± 0.5 °C. The whole assembly was fixed on a magnetic stirrer using a clamp. The aliquot withdrawn for 24 h was filtered through 0.22 µm membrane filter and analysed for drug content by UV–visible spectrophotometer (Shimadzu 1800, Japan) at 257 nm. The cumulative amount permeated at each time interval was calculated and plotted against time. Skin permeability of F2 was significantly higher than F1, p < .05.
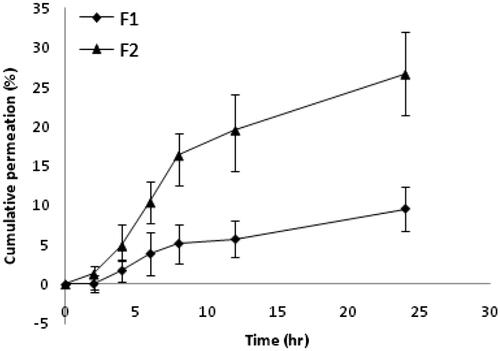
Figure 5. Comparison of drug retention in human skin and rat skin after permeation study for 24 h. Data points represent mean ± SD, n = 3. The effective diffusion area of the skin sample after permeation study was cut into small pieces and homogenized in a tissue homogenizer; the drug was extracted in methanol, filtered through 0.22 µm membrane filter and analysed in the UV–visible spectrophotometer after suitable dilution with phosphate buffer (pH 6.8) PEG 400 (50% v/v) to determine the drug retained in the skin. Drug retention in the skin for F2 is significantly higher than F1, both in rat skin and human cadaver skin (p < .05).
FT-IR and DSC of the human cadaver skin used in drug permeation study
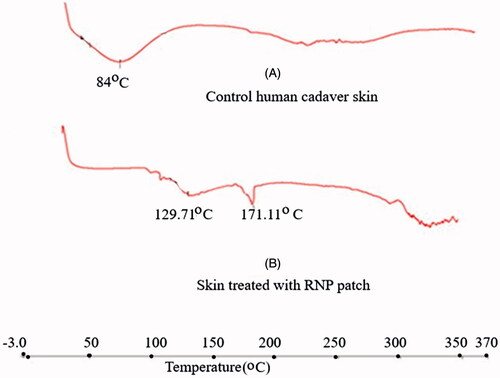
FT-IR spectrums of the patch treated human skin () revealed that characteristic IR absorption peaks of rutin appeared at their respective wave numbers. The results suggest that rutin was accumulated in the skin layers. Lin et al. [Citation69] studied the skin permeation and degradation profile of rutin in animal model and found that rutin did not undergo any degradation during skin permeation. The DSC thermogram of the untreated skin showed a broad endothermic peak at 84 °C (), which is found to appear at 129.71 °C in the treated skin sample. The DSC thermogram of the skin used in permeation study with RNPs containing patch showed the endothermic peak for rutin at 171.11 °C. These results indicate the accumulation of drug in the skin layers. The results of thermal analysis also suggest that rutin did not undergo any skin metabolism during 24 h skin permeation study.
Figure 6. FT-IR spectrum of RNP (1:1), untreated human cadaver skin and RNP patch F2 treated human cadaver skin. The dried skin was cut into a size of (0.5 × 0.5) cm2 and IR spectra were recorded using a FT-IR (Alpha FT-IR Bruker). The characteristic IR absorption peaks of rutin were appeared at their respective wave numbers in the patch treated skin indicating the accumulation of rutin without degradation during skin permeation.
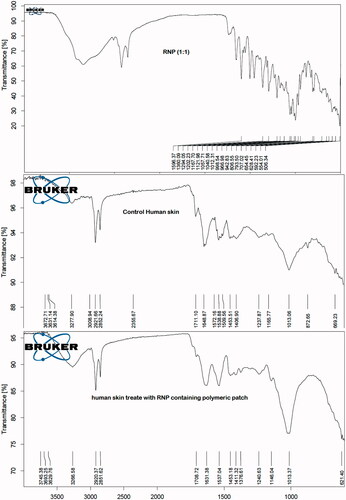
Figure 7. DSC thermograms (Heat Flow, Endo Down): (A) Control human cadaver skin, (B) human cadaver skin treated with RNP patch F2. The DSC thermograms of skin samples were recorded using a DSC (Perkin Elmer (USA), Model- JADE DSC). The dried skin sample of about 5 mg was placed in an aluminium crimp pan and analysed between 30–350° C with heating rate of 10° C/min under nitrogen environment rutin in the treated skin was indicated by the endothermic peak at 171.11 °C in thermogram B.
FESEM of the skin used in drug permeation study
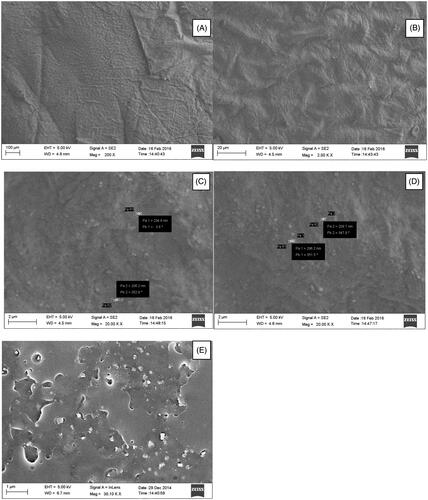
The FESEM images of the control skin showed the compact surface morphology of the skin (), whereas intimate surface adsorption of the RNPs can be seen in the FESEM images of RNP patch (F2) treated skin (). The mobility of skin appendages were observed in the RNP patch treated skin and the RNP particles can be seen in the pockets of the skin appendages penetrating the epidermis. The mobility of the skin appendages indicates the softening of the SC lipids (). Theses appendages are the main pathways of drug diffusions [Citation70]. The small particles of RNPs are generally released during skin permeation study and penetrated the skin layers due to their favourable partition coefficient towards the SC lipids.
Figure 8. (A) FESEM image of the untreated (control) human cadaver skin. The compact barrier nature of the upper epidermis layer of the skin can be seen in the FESEM photomicrograph; (B–D) FESEM images of human cadaver skin treated with RNP patch F2. The compact barrier property of the skin was altered and the mobilized skin appendages in the images indicating softening of the skin lipid after treatment with RNP patch F2. The process skin sample of 5.0 mm2 of the skin exposed to RNP patch in the permeation study was fixed in 2.5% v/v glutheraldehyde solution at 4 °C for 4 h, followed by storing at 4 °C for 24 h in 0.05 M cacodylate buffer (pH 7.4). The skin was then dehydrated in acetone solution (30–100% v/v). The dehydrated skin was fixed on copper stab and vacuum coated with 1–2 nm layers with Pd/Au in a sputter coater (Emitech) for 30 min. Skin surface was photographed in Carl Zeiss Sigma VP field emission scanning electron microscope. (E) FESEM image of the RNP containing patch F2 after skin permeation experiment. Diffusion of the RNP particles out of the polymer matrix formed permanent holes in the patch. The patch of post permeation study was dried in a desiccator for 24 h, fixed on copper grid and dried in hot air oven at 70 °C for 1 h. The patch sample was vacuum coated with 1 – 2 nm layer of Pd/Au in a coater (Emitech Sputter Coater). Patch surface was photographed in a Carl Zeiss Sigma VP field emission scanning electron microscope.
FESEM of the patch after drug permeation study
The SEM image () of the RNP patch after permeation study indicates the release of RNP particles from the polymer matrix during skin permeation study. The diffusion of RNPs from the patch had left multiple depression spots and pores on the patch surface and clusters of RNPs and larger particles mostly remain bound to the polymer network, yet to be released after long term exposure to skin. Polymer erosion in very few regions can be seen in the patches applied to the skin. The vesicular structure of RNPs was unaltered during diffusion through the polymeric matrix and upon contact with the skin. The polymeric patch provides sufficient mechanical strength for sustaining the release of RNPs from the matrix and would able to retain their vesicular structure for long term exposure to physiologic environment. FESEM images of the patch taken after drug release also suggest that the materials used and method applied resulted into good quality sustained release polymeric patch.
In vivo anti-inflammatory study
The comparative anti-inflammatory effect of the optimized RNP patch formulation and standard 1% diclofenac sodium gel was carried out by carrageenan induced paw oedema model in rats. The carrageenan induced inflammation resulted in paw swelling at significantly different rate (p < .05) in three different groups after 24 h: control group (1% w/v carrageenan suspension, 38.4 ± 3.48% swelling); standard group (standard 1% diclofenac sodium gel, 23.2 ± 4.58% swelling) and test group (test patch F2, 3.3 ± 2.18% swelling). The standard drug application (group II) produced 52.0% inhibition of inflammation at 2 h and 39.58% after 24 h. The results suggest that the drug action is faster with early lag time (<2 h) and failed to give long lasting inhibition. The RNP containing patch (F2) started to act slowly due to slow drug release from the polymer matrix (50.8% inhibition at 4 h). A statistically significant inhibition (p < .05) was observed with the RNPs patch (91.4%) compared to the standard diclofenac sodium gel (39.58%) at 24 h (). Similarly in previous study, luteolin–phospholipid complex produced significantly higher anti-inflammatory response than luteoline [Citation71]. In another study, curcumin–phospholipid complex incorporated polymeric patch showed higher anti-inflammatory efficacy than the orally administered free curcumin [Citation72]. It was concluded that curcumin upon phospholipid complexation needs lesser amount of drug to get therapeutic response by virtue of its increased systemic stability and an excellent penetration power across the SC. In the present study, the RNPs, being lipophilic in nature, get deposited in the epidermal-dermal site of the skin and slow drug release from the depot gives sustained anti-inflammatory effect. The results of skin permeation study showed a considerably higher retention of RNPs in the skin due to their lipophilic nature and slow passage of drug through the hydrophilic dermis to the adjacent tissues can produce sustained anti-inflammatory effect. The penetration and subsequent deposition of RNPs in the skin layers can be identified by CLSM study.
Figure 9. Comparison of % inhibition of oedema of the RNP patch F2 with standard 1% diclofenac sodium gel in rat paw oedema model. The male albino rats (180–220 g) were divided into three groups with six rats in each group. The left hind paw of each animal was shaved without skin damage 12 h before starting the experiments. Paw oedema was induced in the first group (control group) by injecting 0.1 ml of a 1% w/v homogeneous suspension of carrageenan in double-distilled water subplantarly into the left hind paw. The second group (standard group) received marketed 1% diclofenac sodium gel (5 mg/kg of body weight) and the third group (test group) received RNP patch F2 (equivalent to 20 mg rutin, patch area 2.4 cm2) to the shaved area one hour before the carrageenan injection. The volume of the left hind paw was measured at predetermined time interval for 0–24 h duration using a digital plethysmometer (INCO Instruments and Chemicals, Delhi, India). Paw swelling was calculated as: % Swelling = (Vt – V0/V0) × 100; where V0 is the paw volume at time “0” and Vt is the paw volume at time “t”. The percent (%) inhibition of oedema in treated groups was calculated against the control group using the following formula: % Inhibition = [% Swelling (control) − % Swelling (drug)/% Swelling (control)] × 100. The test patch showed significantly higher inhibition of oedema than the standard diclofenac sodium gel (p < .05, one-way ANOVA). Data points are mean ± SD, n = 3.
![Figure 9. Comparison of % inhibition of oedema of the RNP patch F2 with standard 1% diclofenac sodium gel in rat paw oedema model. The male albino rats (180–220 g) were divided into three groups with six rats in each group. The left hind paw of each animal was shaved without skin damage 12 h before starting the experiments. Paw oedema was induced in the first group (control group) by injecting 0.1 ml of a 1% w/v homogeneous suspension of carrageenan in double-distilled water subplantarly into the left hind paw. The second group (standard group) received marketed 1% diclofenac sodium gel (5 mg/kg of body weight) and the third group (test group) received RNP patch F2 (equivalent to 20 mg rutin, patch area 2.4 cm2) to the shaved area one hour before the carrageenan injection. The volume of the left hind paw was measured at predetermined time interval for 0–24 h duration using a digital plethysmometer (INCO Instruments and Chemicals, Delhi, India). Paw swelling was calculated as: % Swelling = (Vt – V0/V0) × 100; where V0 is the paw volume at time “0” and Vt is the paw volume at time “t”. The percent (%) inhibition of oedema in treated groups was calculated against the control group using the following formula: % Inhibition = [% Swelling (control) − % Swelling (drug)/% Swelling (control)] × 100. The test patch showed significantly higher inhibition of oedema than the standard diclofenac sodium gel (p < .05, one-way ANOVA). Data points are mean ± SD, n = 3.](/cms/asset/41d0f7b9-5571-46ec-bdae-eff95b4767a6/ianb_a_1411931_f0009_b.jpg)
CLSM study
Permeation of topically applied drug formulation have been studied in CLSM by identifying the transport pathways of the macromolecules and fluorescent labels in the skin after formulating into advanced system and drug carrier to assess the effect of these methods on increasing transdermal transport [Citation69–71]. To detect the penetration of fluorescent label into deeper layers of the skin, cross-sections perpendicular to the skin were taken and subsequently CLSM images parallel to the plane of these sections were captured [Citation76]. This assisted in visualizing the SC, viable epidermis and dermis in the same focal plane in the CLSM images. Fluorescent band was observed only on the surface of the skin in the control group (), where the probe could not penetrate the SC; however, it concentrated in the hair root due to its affinity for water. Rhodamine B, a hydrophilic fluorescence marker does not normally get into the deeper layers of the skin [Citation77]. Rhodamine B when presented with free rutin in the control patch could not penetrate the skin. The images obtained from the skin treated with Rhodamine B labelled RNP patch formulation F2 showed that fluorescence spread to deeper layer and reached the viable epidermis and dermis (). RNPs predominantly deposited in the dermis as evidenced by the intense fluorescent band in the dermis. Results suggest that skin permeability of Rhodamine B is significantly higher with RNPs than with free rutin.
Figure 10. CLSM images of rat and human skin: (A) Control rat skin treated with fluorescence labelled patch containing free rutin F1; (B–D) Rat skin treated with fluorescence labelled RNP containing patch F2; (E) Control human skin treated with fluorescence labelled patch containing free rutin F1; (F–H) Human skin treated with fluorescence labelled RNP containing patch F2. Fluorescent probe (RhB) loaded patches were applied to dorsal skin area of the rats and human cadaver skin for 24 h. The exposed skin area was excised, washed with distilled water, frozen overnight in liquid nitrogen at −196 °C and skin samples were sectioned in a SHANDON CRYOTOME E (Thermo Electron Corporation, Waltham, MA, USA). Skin sections were examined in a Leica DMi8 confocal laser scanning microscope (Leica, Heidelberg, Germany) with optical excitation of argon laser beam at 520 nm and fluorescence emission of RhB at above 580 nm. Skin sections were imaged under 20× objective in the x-y axis to find the penetration depth and deposition of the RhB-loaded RNPs in the whole thickness of the skin.
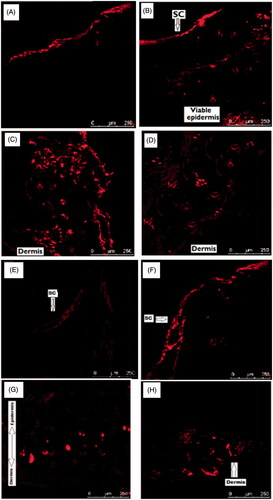
Similar to the results obtained in the CLSM study using rat skin, the images obtained using human cadaver skin showed that fluorescence label could only penetrate the superficial layer of the skin treated with free rutin (control) () and localized mostly in the SC layer. In RNP patch treated human skin, fluorescence spread to deeper layer and reached the viable epidermis and dermis (). As like in rats, scattered fluorescent spots were observed in the epidermal-dermal layers and intense regions in the dermis of the human cadaver skin. Naz et al. [Citation78] reported that hydrophilic Rhodamine B followed the polar pathway while the more lipophilic RhB-labelled Curcumin-loaded colloidal carrier system followed the non-polar pathway in permeating the skin. Meng et al. [Citation79] used the CLSM technique to investigate the skin permeation efficiency of three different formulations of Testosterone propionate by labelling the formulations with Rhodmine Red The study results suggest that RNPs partition between polymeric matrix and skin lipid and penetrate the skin due to the smaller body size, travels through the epidermis by the non-polar pathways and are mostly deposited in the viable epidermis and dermis.
Stability study
The drug content (%) of the RNP containing patches was almost unaltered in the storage condition of 4 °C ± 2 °C. The RNP patch when stored at 25 ± 2 °C/60 ± 5% RH, the drug content was gradually decreased from initial 99.06 ± 0.8% to 97.1 ± 0.45%, which is statistically insignificant (p > .05). The RNP patch showed 83.4 ± 4.66% drug content after six months when stored at 40 °C ± 2 °C/70 ± 5% RH. This reduction in drug content was statistically significant (p < .05) compared to the drug content with the storage conditions of 4 °C ± 2 °C and at 25 ± 2 °C/60 ± 5% RH. The reason may be the hydrolytic degradation of drug and/or formation of less soluble crystal form upon separation of rutin from the RNPs at the higher humidity and temperature. The results suggest the need for protection of the formulations from such stress conditions by providing appropriate packaging.
Photo stability study
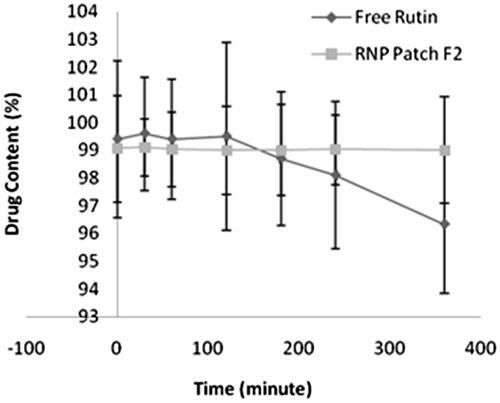
Phyto-phospholipid complex formation contributed to photo stability of rutin against UV irradiation. Photo stability study of free rutin revealed that drug content was decreased from initial 99.4 ± 2.82% to 96.34 ± 2.48% after six hours exposure to UV light (). For the RNP containing patch F2, no difference in drug content found before and after exposure to UV light. The photo stability of free rutin is comparatively less than rutin-phospholipid complex in the polymeric patch, which is statistically insignificant (p > .05). The results of the photo stability study suggest that RNP in polymeric patch remained stable on exposure to UV radiation.
Figure 11. Photo stability of free rutin and RNP patch F2. Data points represent mean ± SD, n = 3. RNP containing patch and free rutin samples were exposed to UV light in the UV-chamber (Macro Scientific Works (R), New Delhi, India) for 6 h and analysed for drug content at predetermined time intervals. The difference in photo stability of free rutin and rutin-phospholipid complex in polymeric patch is statistically insignificant (p > .05).
Conclusions
The present study has undoubtedly proved the potential effectiveness of drug–phospholipid complex for formulating rutin with improved physicochemical properties suitable for dermal drug delivery. The developed RNPs embedded patch showed long term sustained anti-inflammatory effect in rat paw oedema model compared to conventional diclofenac sodium gel. The current investigation may serve as a promising approach for the formulation development of other drugs or phytoconstituents with limited solubility in both water as well as lipids for dermal/transdermal drug delivery with no use of chemical permeation enhancer or any physical mean.
Acknowledgements
The authors acknowledge the facilities provided in Guwahati Biotech Park Guwahati for CLSM study and in Institute of Advanced Study in Science and Technology (IASST) Guwahati for FESEM study.
Disclosure statement
No potential conflict of interest was reported by the authors.
References
- Ekstrand R, Alvan G, L’E Orme M, et al. Double-blind dose-response study of indomethacin in rheumatoid arthritis. Eur J Clin Pharmacol. 1980;17:437–442.
- Haroutiunian S, Drennan DA, Lipman AG. Topical NSAID therapy for musculoskeletal pain. Pain Med. 2010;11:535–549.
- Altman R, Barkin RL. Topical therapy for osteoarthritis: clinical and pharmacologic perspectives. Postgrad Med. 2015;121:139–147.
- McCarberg B, D’Arcy Y. Options in topical therapies in the management of patients with acute pain. Postgrad Med. 2015;125:19–24.
- Brown GA. AAOS clinical practice guideline: treatment of osteoarthritis of the knee: evidence-based guideline, 2nd edition. J Am Acad Orthop Surg. 2013;21:577–579.
- McPherson ML, Cimino NM. Topical NSAID formulations. Pain Med. 2013;14:S35–S39.
- National Institute for Health and Clinical Excellence. NICE clinical guideline 59. The care and management of osteoarthritis in adults. 2008.
- Hochberg MC, Altman RD, April KT, et al. American college of rheumatology 2012 recommendations for the use of nonpharmacologic and pharmacologic therapies in osteoarthritis of the hand, hip, and knee. Arthritis Care Res. 2012;64:465–474.
- Makris UE, Kohler MJ, Fraenkel L. Adverse effects (AEs) of topical NSAIDs in older adults with osteoarthritis (OA): a systemic review of the literature. J Rheumatol. 2010;73:1236–1243.
- Hendra R, Ahmad S, Oskoueian E, et al. Anti-oxidant, anti-inflammatory and cytotoxicity of Phaleria macrocarpa (Boerl.) Scheff Fruit. BMC Complement Altern Med. 2011;11:1472–1482.
- Han Y. Rutin has therapeutic effect on septic arthritis caused by Candida albicans. Int J Immunopharmacol. 2009;9:207–211.
- Musthaba S, Athar M, Kamal T, et al. Fast analysis and validation of rutin in anti-psoriatic Ayurvedic formulation by HPLC. J Liq Chromatogr Relat. 2011;34:446–455.
- Sforcin JM. Propolis and the immune system: a review. J Ethnopharmacol. 2007;113:1–14.
- Guardia T, Rotelli AE, Juarez AO, et al. Anti-inflammatory properties of plant flavonoids. Effects of rutin, quercetin and hesperidin on adjuvant arthritis in rat. Farmaco. 2001;56:683–687.
- Choi KS, Kundu JK, Chun KS, et al. Rutin inhibits UVB radiation-induced expression of COX-2 and iNOS in hairless mouse skin: p38 MAP kinase and JNK as potential targets. Arch Biochem Biophys. 2014;559:38–45.
- Kumar A, Rinwa P, Dhar H. Possible nitric oxide modulation in the protective effects of rutin against experimental head trauma-induced cognitive deficits: behavioural, biochemical, and molecular correlates. J Surg Res. 2014;188:268–279.
- Kauss T, Moynet D, Rambert J, et al. Rutoside decreases human macrophage-derived inflammatory mediators and improves clinical signs in adjuvant-induced arthritis. Arthritis Res Ther. 2008;10:R19.
- Aruna R, Geetha A, Suguna P. Expression of caspase activation recruitment and pyrin domain levels of apoptosis-associated speck-like protein complex in the pancreas of rats subjected to experimental pancreatitis: influence of rutin administration. Hum Exp Toxicol. 2013;33:940–948.
- Nikfarjam BA, Adineh M, Hajiali F, et al. Treatment with rutin – a therapeutic strategy for neutrophil-mediated inflammatory and autoimmune diseases. J Pharmacopuncture. 2017;20:52–56.
- Khalifa TI, Muhtadi FJ, Hassan MMA. Rutin. In: Florey K., editor. Analytical profiles of drug substances. New York (NY): Academic Press; 1983. p. 623.
- Morand C, Manach C, Crespy V, et al. Respective bioavailability of quercetinaglycone and its glycosides in a rat model. Biofactors. 2008;12:169–174.
- Yang C-Y, Hsiu S-L, Wen K-C, et al. Bioavailability and metabolic pharmacokinetics of rutin and quercetin in rats. J Food Drug Anal. 2005;13:244–250.
- Hollman PCH, van Trijp JMP, Mengelers MJB, et al. Bioavailability of the dietary antioxidant flavonol quercetin in man. Cancer Lett. 1997;14:139–140.
- Erlund I, Kosonen T, Alfthan G, et al. Pharmacokinetics of quercetin from quercetin aglycone and rutin in healthy volunteers. Eur J Clin Pharmacol. 2000;56:545–554.
- Graefe EU, Wittig J, Mueller S, et al. Pharmacokinetics and bioavailability of quercetin glycosides in humans. J Clin Pharmacol. 2001;41:492–499.
- Mauludin R, Muller RH. Preparation and storage stability of rutin nanosuspensions. J Pharm Investigat. 2013;43:395.
- Lichtenberger LM, Wang ZM, Romero JJ, et al. Nonsteroidal anti-inflammatory drugs (NSAIDs) associate with zwitterionic phospholipids: insight into the mechanism and reversal of NSAID-induced gastrointestinal injury. Nat Med. 1995;11:154–158.
- Das MK, Kalita B. Design and evaluation of phyto-phospholipid complexes (phytosomes) of rutin for transdermal application. J Appl Pharm Sci. 2014;4:51–57.
- Kalita B, Das MK, Sarma M, et al. Skin targeted delivery of rutin-phospholipid complex: patch formulation, in vitro-in vivo evaluation. World J Pharm Sci. 2015;3:2042–2057.
- Marena C, Lampertico M. Preliminary clinical development of silipide (Siliphos®): a new complex of silybin in toxic liver disorders. Planta Med. 1991;57:A124–A125.
- Chaudhari P, Sharma P, Barhate N, et al. Solubility enhancement of hydrophobic drugs using synergistically interacting cyclodextrins and cosolvent. Current Sci 2007;92:1586–1591.
- Berthod A, Carda-Broch S. Determination of liquid-liquid partition coefficients by separation methods. J Chromatogr A. 2004;1037:3–14.
- Appa Rao B, Shivalingam MR, Kishore Reddy YV, et al. Formulation and evaluation of aceclofenac solid dispersions for dissolution rate enhancement. Int J Pharm Sci Drug Res. 2010;2:146–150.
- Grewal H, Dhakate SR, Goyal AK, et al. Development of transmucosal patch using nanofibers. Artif Cells Blood Substit Immobil Biotechnol. 2012;40:46–50.
- Gupta R, Mukherjee B. Development and in vitro evaluation of diltiazem hydrochloride transdermal patches based on povidone-ethylcellulose matrices. Drug Dev Ind Pharm. 2003;29:1–7.
- Mehdzadeha A, Toliate T, Rouini MR, et al. Design and in vitro evaluation of new drug-in-adhesive formulations of fentanyl transdermal patches. Acta Pharm. 2004;54:301–317.
- Cilurzo F, Gennari CGM, Minghetti P. Adhesive properties: a critical issue in transdermal patch development. Expert Opin Drug Deliv. 2012;9:33–45.
- Kerimoglu O, Sahbaz S, Sehirli O, et al. Mechanical evaluation of matrix type transdermal therapeutic systems containing captopril. Marmara Pharm J. 2015;19:67–72.
- Khullar R, Kumar D, Seth N, et al. Formulation and evaluation of mefenamic acid emulgel for topical delivery. Saudi Pharm J. 2012;20:63–67.
- Schiller R, Funke AP, Günther C. DSC measurements on full thickness mice skin an additional tool to investigate permeation enhancement of highly lipophilic drugs. J Therm Anal Calorim. 2004;77:497–510.
- Duangjit S, Opanasopit P, Rojanarata T, et al. Characterization and in vitro skin permeation of meloxicam-loaded liposomes versus transfersomes. J Drug Deliv. 2011;2011:418316.
- Jain S, Tiwary AK, Sapra B, et al. Formulation and evaluation of ethosomes for transdermal delivery of lamivudine. AAPS PharmSciTech. 2007;8:E1–E9.
- Soujanya C, Lakshmi SB, Lokesh RM, et al. Formulation and in vitro and in vivo evaluation of transdermal patches of lornoxicam using natural permeation enhancers. Int J Pharm Pharm Sci. 2014;6:282–286.
- Charoenputtakun P, Pamornpathomkul B, Opanasopit P, et al. Terpene composited lipid nanoparticles for enhanced dermal delivery of all-trans-retinoic acids. Biol Pharm Bull. 2014;37:1139–1148.
- Dhiman A, Singh D. Development, characterization & in vitro skin permeation of rutinethosomes as a novel vesicular carrier. Int Jour of Biomed Res. 2013;4:559–566.
- Rasaie S, Ghanbarzadeh S, Mohammadi M, et al. Nano phytosomes of quercetin: a promising formulation for fortification of food products with antioxidants. Pharma Sci. 2014;20:96–101.
- Bajaj S, Singla D, Sakhuja N. Stability testing of pharmaceutical products. J Appl Pharm Sci. 2012;2:129–138.
- Ansari KA, Vavia PR, Trotta F, et al. Cyclodextrin-based nanosponges for delivery of resveratrol: in vitro characterisation, stability, cytotoxicity and permeation study. AAPS PharmSciTech. 2011;12:279–286.
- Chandrashekar NS, Shobha Rani RH. Physicochemical and pharmacokinetic parameters in drug selection and loading for transdermal drug delivery. Indian J Pharm Sci. 2008;70:94–96.
- Panchagnula R. Transdermal delivery of drugs. Ind J Pharmacol. 1997;29:140–156.
- Schneider M, Stracke F, Hansen S, et al. Nanoparticles and their interactions with the dermal barrier. Dermatoendocrinol. 2009;1:197–206.
- Hung CF, Lin YK, Zhang LW, et al. Topical delivery of silymarin constituents via the skin route. Acta Pharmacol Sin. 2010;31:118–126.
- Mamatha T, Venkateswara RJ, Mukkanti K, et al. Development of matrix type transdermal patches of lercanidipine hydrochloride: physicochemical and in vitro characterization. DARU. 2010;18:9–16.
- Verma PRP, Murthy TEGK. Transdermal flubiprofen delivery using HPMC matrices: design, in vitro and in vivo evaluation. Drug Dev Ind Pharm. 1997;23:633–638.
- Sezer AD, Hatipoğlu F, Cevher E, et al. Chitosan film containing fucoidan as a wound dressing for dermal burn healing: preparation and in vitro/in vivo evaluation. AAPS PharmSciTech. 2007;8:1–8.
- Gantner DC, Schalau IIGK, Thomas X. (2015). Soft skin adhesive gels and liners: new formulating options for tailored solutions. In: DOW CORNING. Available from: http://www.dowcorning.com/content/publishedlit/52-1113.pdf
- Mazumder A, Dwivedi A, Fox LT, et al. In vitro skin permeation of sinigrin from its phytosome complex. J Pharm Pharmacol. 2016;68:1577–1583.
- Avachat AM, Patel VG. Self nanoemulsifying drug delivery system of stabilized ellagic acid-phospholipid complex with improved dissolution and permeability. Saudi Pharm J. 2015;23:276–289.
- Zaveri M, Gajjar H, Kanaki N, et al. Preparation and evaluation of drug phospholipid complex for increasing transdermal penetration of phytoconstituents. Int J Institutional Pharm Life Sci. 2011;1:80–93.
- Yun-shu M, Hao-ru Z, Yi-ning L. Studies on permeation of Puerarin and its phospholipid complex through rat skin in vitro. Chin J Chin Mat Med. 2000;25:274–276.
- Cao FH, OuYang WQ, Wang YP, et al. A combination of a microemulsion and a phospholipid complex for topical delivery of oxymatrine. Arch Pharm Res. 2011;34:551–562.
- Singh RP, Narke R. Preparation and evaluation of phytosomes of Lawsone. Int J Pharm Sci Res. 2015;6:5217–5226.
- Li L, Yanhong L, Yan X, et al. Preparation of a ferulic acid–phospholipid complex to improve solubility, dissolution, and B16F10 cellular melanogenesis inhibition activity. Chem Cent J. 2017;11:26.
- Yu J, Wan K, Sun X. Improved transdermal delivery of morin efficiently inhibits allergic contact dermatitis. Int J Pharm. 2017;530:145–154.
- Ittadwar PA, Puranik PK. Novel umbelliferone phytosomes: development and optimization using experimental design approach and evaluation of photo-protective and antioxidant activity. Int J Pharm Pharm Sci. 2017;9:218–228.
- Jun Y, Pingping W, Xiaojin C, et al. Study on transdermal permeation and skin accumulation of diammonium glycyrrhizinate vesicular carriers. Chin J Modern Appl Pharm. 2013;30:977–980.
- Pereira A, Mallya R. Formulation and evaluation of a photoprotectant cream containing Phyllanthus emblica extract phospholipid complex. J Pharmacog Phytochem. 2015;4:232–240.
- Godin B, Touitou E. Transdermal skin delivery: predictions for humans from in vivo, ex vivo and animal models. Adv Drug Deliv Rev. 2007;59:1152–1161.
- Lin CF, Leu YL, Al-Suwayeh SA, et al. Anti-inflammatory activity and percutaneous absorption of quercetin and its polymethoxylated compound and glycosides: the relationships to chemical structures. Eur J Pharm Sci. 2012;47:857–864.
- Arora P, Mukherjee B. Design, development, physicochemical, and in vitro and in vivo evaluation of transdermal patches containing diclofenac diethylammonium salt. J Pharm Sci. 2002;91:2076–2089.
- Khan J, Alexander A, Ajazuddin, et al. Luteolin-phospholipid complex: preparation, characterization and biological evaluation. J Pharm Pharmacol. 2014;66:1451–1462.
- Tripathy S, Das MK. Curcumin-phospholipid supramolecular complex for transdermal application. Der Pharm Lett. 2013;5:224–233.
- Kirjavainen M, Urtti A, Valjakka-Koskela R, et al. Liposome-skin interactions and their effects on the skin permeation of drugs. Eur J Pharm Sci. 1999;7:279–286.
- Marttin E, Verhoef JC, Cullander C, et al. Confocal laser scanning microscopic visualization of the transport of dextrans after nasal administration to rats: effects of absorption enhancers. Pharm Res. 1997;14:631–637.
- Lombry C, Dujardin N, Preat V. Transdermal delivery of macromolecules using skin electroporation. Pharm Res. 2000; 17:32–37.
- Pereira GR, Collett JH, Garcia SB, et al. Glycerol monooleate/solvents systems for progesterone transdermal delivery: in vitro permeation and microscopic studies. Rev Bras Cienc Farm. 2002;38:55–62.
- Rajesh K, Murugesan SK. Development of protransferrosomal system for effective transdermal delivery of nifedipine. World J Pharm Pharmaceut Sci. 2014;3:604–623.
- Naz Z, Ahmad FJ. Curcumin-loaded colloidal carrier system: formulation optimization, mechanistic insight, ex vivo and in vivo evaluation. Int J Nanomed. 2015;10:4293–4307.
- Meng S, Chen Z, Yang L, et al. Enhanced transdermal bioavailability of testosterone propionate via surfactant-modified ethosomes. Int J Nanomed. 2013;8:3051–3060.