
Abstract
Background
Neurotoxicity induced by the local anaesthetics has aroused concern. A previous study has shown that an overload of intracellular calcium was involved in the neurotoxic effect. Cav3.1 is one of the low-voltage-activated (LVA) calcium channels which play a key point to regulate the intracellular calcium ion level. This study aimed to investigate the changes of the Cav3.1 expression in the SH-SY5Y cells treated with lidocaine hydrochloride.
Methods
The SH-SY5Y cells were treated with different concentrations of lidocaine hydrochloride(1 mM, 5 mM and 10 mM, namely L1 group, L5 group and L10 group) and different exposure times (1 h,12 h and 24 h), respectively. Cell viability, Cav3.1 protein and mRNA expression were detected.
Results
The results showed that cell viability decreased and Cav3.1 mRNA and protein expression increased with the concentration (from 1 mM to 10 mM) of the lidocaine hydrochloride and exposure time (from 1 h to 24 h) to the SH-SY5Y cell line increased.
Conclusion
Those data showed that lidocaine hydrochloride induced SH-SY5Y cell toxicity and up-regulated Cav3.1mRNA and protein expression.
Introduction
With the widely used of the local anaesthetics in the clinical, the potential neurotoxicity of the local anaesthetics is also concerned by people [Citation1–3]. Previously studies show that intracellular calcium overload closely relate with the neurotoxicity of local anaesthetics [Citation4,Citation5]. Although low-concentration local anaesthetics cause little changes of the cytoplasmic calcium of the ND7 cell line, local anaesthetics induced a sharp increase in cytoplasmic calcium with the concentration dependent and exposure-period dependent. The mechanism of the cytoplasmic calcium was related with influx of Ca2 + through the plasma membrane and the failure of endoplasmic reticulum to take up the elevated cytoplastic calcium [Citation6,Citation7].
One important role of the voltage-gated Ca2 + channel (VGCC) is the regulation of the electrical excitability of the neurons. They regulate the intracellular Ca2 + concentration and play a key role in neuronal physiology. According with the activation voltage, VGCCs are divided into high-voltage-activated (HVA) Ca2 + channel and low-voltage-activated (LVA) calcium channel. T-type calcium channel, belonging to the low-voltage-activated calcium channel, is divided into Cav3.1, Cav3.2 and Cav3.3 [Citation8]. T-type calcium channels can be activated at resting membrane potentials and calcium ion enters into intracellular by the T-type calcium channel. As well as, there is a window current (overlap between the activated and inactivated membrane potentials) for the T-type calcium channel which resulted in the calcium ion influx through the open T-type calcium channel at the resting membrane potential [Citation9]. T-type calcium channel plays an important role in the regulation of the neurons excitability [Citation10]. The neurotoxicity of the local anaesthetics causes neurons injury resulting in the changes of the excitability. Consequently, we deduce that the neurons excitability changes induced by local anaesthetics may be involved with the T-type calcium channel.
In our previous study, we found that all three subtypes of the T-type calcium channel (Cav3.1, Cav3.2 and Cav3.3) can be detected in the SH-SY5Y cells [Citation11], but the Cav3.1 is the main subunit of the T-type calcium channel in SH-SY5Y cells. In this study, we tested the hypothesis that lidocaine hydrochloride induced neurotoxicity of the SH-SY5Y cells and upregulated the expression of the Cav3.1 in SH-SY5Y cell lines. We detected the Cav3.1 expression of the SH-SY5Ycells treated with different concentrations of lidocaine hydrochlorides by western blotting and RT-PCR
Materials and methods
Materials
The SH-SY5Y cell lines were supplied by Shanghai Institutes for Biological Sciences and subcultured in the experiment. Goat polyclonal anti-Cav3.1 antibody was obtained from Santa Cruz Biotechnology (Santa Cruz, CA), lidocaine hydrochloride was obtained from Sigma (Chicago, IL). Primers of the β-actin and Cav3.1 were supplied by Shanghai Shenggong Company of China (). DMEM/F12 medium and foetal bovine serum (Gibco, Carlsbad, CA), and 3-(4,5-dimethyl-2-thiazolyl)-2,5-diphenyl-2-tetrazolium bromide (MTT, Beyotime, Beijing, China). All reagents were from commercial suppliers and standard biochemical quality.
Table 1. The primer sequences of Cav3.1 and β-actin for qRT-PCR.
Cell culture and experimental classification
SH-SY5Y cells were cultured in the DMEM/F12 medium with 15% foetal bovine serum, 100 units/ml penicillin and 100 μg/ml streptomycin in a humidified 5% CO2 incubator at 37 °C. The medium was renewed every 2 d. Lidocaine hydrochloride in the form of pulveres was dissolved in the medium with serum and the final concentrations of lidocaine hydrochloride were 1 mM, 5 mM and 10 mM. The cells were treated, respectively, with 1 mM, 5 mM and 10 mM lidocaine hydrochloride or an equivalent amount of medium for 1, 12 or 24 h. The experimental classification consisted of C group (control group without treatment with lidocaine hydrochloride) and L1, L5 and L10 groups (treated with 1 mM, 5 mM and 10 mM lidocaine hydrochloride).
Microscopic observation of cell morphology during lidocaine treatment
Cells after treated with lidocaine hydrochloride in multiwell plates were placed on the stage of a microscope (Nikon ECLIPSE TE 2000,Tokyo, Japan) and images were recorded with the digital camera with amplification (100×).
MTT assay
According with the previously method, cell viability was detected with MTT assay [Citation12]. The SH-SY5Y cell lines were seeded into 96-well plates with 5 × 10³ cells/well density. When the plates were coved at 80%, the cells were treated with different concentrations of lidocaine hydrochloride (1 mM, 5 mM and 10 mM) for 1 h, 12 h and 24 h. After treated with different concentrations and exposure time of lidocaine hydrochloride, MTT (20 μl) was added to each well and incubated at 37 °C for 4 h. The optic density of the homogenous purple solutions was measured using a spectrophotometer (Bio-Tek, Winooski, VT). The control group without lidocaine hydrochloride treatment was set as 100% and other groups were normalized to the corresponding control values.
Detection of cell deaths with Hoechst/PI
The cultured SH-SY5Y cells were seeded into one 12-well plate with 2 × 10⁶ density. After touched, the cultured cells were treated with 1 mM, 5 mM and 10 mM lidocaine hydrochloride for 24 h. Discarded the media, added 1 ml PBS with 5 µg (1 µg/µl concentration) Hoechst 33342 and propidium iodide (PI) each well. After incubated for 15 min in 5% CO2 incubator at 37 °C, the cells were observed under the fluorescence microscope (Leica, Hamburg, Germany) and photographed. The red fluorescence-positive cells were calculated as a percentage of the total cells.
Detection of Cav3.1 protein with immunofluorescence
After treatment with lidocaine for 24 h, the Cav3.1 expression in the cultured cells was measured by immunofluorescence. Before the immunofluorescence experiment, the cultured cells were fixed to glass slides with 4% paraformaldehyde for 30 min and washed three times for 5 min with potassium phosphate buffer solution. Then, the samples were disposed with 0.2% Triton X-100 for 5 min and washed with potassium phosphate buffer solution three times for 5 min. Normal goat serum was equilibrated for 30 min. The Cav3.1 antibody (1:100) was added to the sample and incubated overnight. Then, the cells were incubated with the secondary antibody with fluorescence labelling for one hour and with DAPI (Beyotime, Beijing, China) for 5 min. After equilibration by anti-fluorescence quenching, the glass slides were observed under the fluorescence microscope (Leica, Hamburg, German) and photographed. The fluorescence positive cells were calculated as a percentage of the total cells.
Western blot assay
After treated as described above, total proteins of the SH-SY5Y cells were extracted to detect the Cav3.1 expression. In brief, cells were lysed in the lysis buffer and centrifugated at 13,000g for 5 min. The protein was collected and 20 μg protein each sample was used to run sodium dodecyl sulphate-polyacrylamide gel electrophoresis. After electrotransferred, the PVDF membranes were blocked with 5% non-fat dry milk in Tris-buffered saline and incubated with anti-Cav3.1 or anti-β-actin antibody diluted (1:500) in blocking solution containing 5% non-fat dry milk and 0.1% Tween-20 in Tris-HCl-buffered saline for overnight at 4 °C. Next day, after incubated with horseradish peroxidase-conjugated anti-rabbit immunoglobulin at a dilution of 1:1000 for 1 h, the membranes were then exposed to X-ray film. Quantification of bands was carried out by scanning the films. The expression level of Cav3.1 protein was normalized to that of corresponding β-actin product.
qRT-PCR assay
The SH-SY5Y cells were collected with Trizol reagent (Life Technologies, Gaithersburg, MD) following a standard protocol. According to the protocol from the manufacturer (Promega, Madison, WI), total RNA(2 μg) was reverse transcribed for 60 min at 42 °C and quality real-time PCR was performed by monitoring SYBR Green fluorescent dye (SYBR Green PCR master mix; Applied Biosystems, Foster City, CA) with a continuous fluorescence detector (DNA Engine Opticon 2 System; MJ Research Incorporated, Waltham, MA). All samples were analyzed in duplicate over 40 cycles of degeneration at 95 °C for 30 s and annealing at 60 °C for 35 s for each cycle. Cav3.1 mRNA expression was normalized by calculating the ratio between the cell untreated with and without lidocaine hydrochloride. Cav3.1 mRNA expression untreated with lidocaine hydrochloride was regarded as 1. The data from the real-time PCR were converted to 2−CT, where CT represented the threshold cycle.
Statistical analysis
Data are expressed as means ± standard deviation. The comparisons of cell viability, cell death rate, Cav3.1 mRNA and protein expression of the SH-SY5Y cell after treated with lidocaine hydrochloride were performed using one-way analysis of variance. p < .05 was considered to indicate a statistically significant difference.
Results
Morphological changes of SH-SY5Y cells
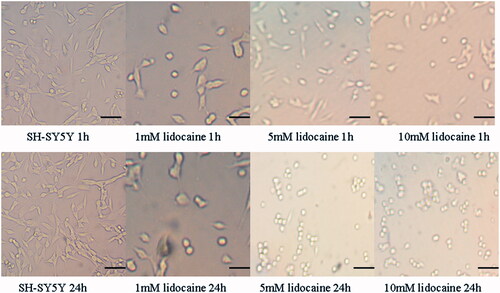
displays the representative morphological changes of the SH-SY5Y cells treated with different concentrations of lidocaine hydrochloride. Although the SH-SY5Y cells had no obvious morphological changes after treated with 1 mM lidocaine hydrochloride for 1 h, the cell extensions become shorter after treated with lidocaine hydrochloride for 24 h. Moreover, with the raise of the lidocaine hydrochloride concentration (5 mM and 10 mM) and the duration (24 h) of the exposure to the lidocaine hydrochloride, all cell looked rounded and the cell extensions completely disappeared. The shape of the SH-SY5Y cells after treated with lidocaine hydrochloride showed time-dependent and concentration-dependent changes.
Figure 1. The morphological changes of SH-SY5Y cells treated with different concentrations and exposure time of lidocaine hydrochloride. Attached cells grown in multiwall culture plates were observed at room temperature. Images were taken using an inverted microscope. All images have the same magnification of ×100, bar = 25um.
Cell viability of the SH-SY5Y cells after treated with lidocaine hydrochloride
The cell viability of the cell untreated with lidocaine hydrochloride was regarded as 100%. Cell viability descended to 82.1%, 67.8% and 54.3%, respectively, after treated with 1 mM, 5 mM and 10 mM lidocaine hydrochloride for 1 h, and to 60.3%, 50.8% and 37.3%, respectively, after treated with 1 mM, 5 mM and 10 mM lidocaine hydrochloride for 12 h, 47.2%, 36.7% and 27.3%, respectively, after treated with 1 mM, 5 mM and 10 mM lidocaine hydrochloride for 24 h. The changes of cell viability of the SH-SY5Y cells after treated with lidocaine hydrochloride were time dependent and concentration dependent ().
Cell death rate detected with Hoechst33342/PI
To observe the cell death rate induced by the different concentrations of lidocaine hydrochloride, we detected the PI-positive cells’ rate with the Hoechst33342/PI. As shown in , with an increase of the concentration, the cell death increased. Compared with the normal cell, 1 mM, 5 mM and 10 mM lidocaine hydrochloride resulted the cell death. Compared with the cells in the 1 mM group, the death cell increased in the 5 mM and the 10 mM group. Compared with the cells in the 5 mM group, the death cell increased in the 10 mM group.
The Cav3.1 expression measured by immunofluorescence
shows that the Cav3.1 protein expression increased after treatment with lidocaine hydrochloride. The untreated cultured cells had a small amount of Cav3.1 expression; however, Cav3.1 protein expression increased drastically in the cultured cells treated with 1 mM lidocaine hydrochloride for 24 h. Furthermore, with increased concentrations of lidocaine hydrochloride, the Cav3.1 protein expression also increased.
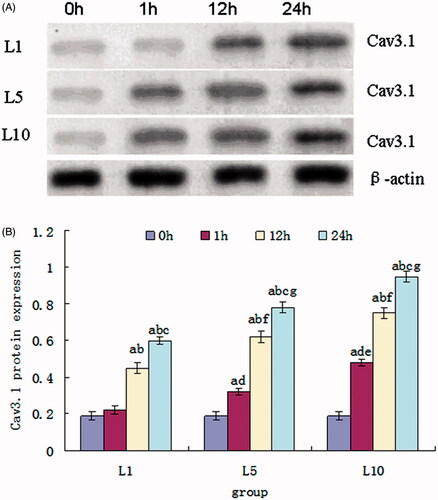
Changes of Cav3.1 protein expression caused by lidocaine hydrochloride
Cav3.1 protein can be detected in SH-SY5Y cells without lidocaine hydrochloride treatment, and expression increases after treated with different concentrations of lidocaine hydrochloride. From , we can find that the Cav3.1 expression of the cells in the L1, L5 and L10 groups gradually increased with the time extension of the exposure to the lidocaine hydrochloride from 1 h to 24 h. On comparison among the groups, there was a significant difference in different exposure times to the lidocaine hydrochloride. On comparison in the intergroup, the increases of the Cav3.1 expression were related with the concentration of the lidocaine hydrochloride, but there was no significant difference of the cells in the L5 and L10 groups after treated with lidocaine hydrochloride for 12 h and 24 h.
Figure 2. Cell viability of the SH-SY5Y cells treated with 1, 5 and 10 mM lidocaine hydrochloride (mean ± sd, n = 6). Comparison among the groups, ap < .05 versus 0 h, bp < .05 versus 1 h, cp < .05 versus 12 h; Comparison in intergroups, dp < .05 versus 1 h of the L1 group, ep < .05 verssu 1 h of the L5 group, fp < .05 versus 12 h of the L1 group, gp < .05 versus 12 h of the L5 group, hp < .05 versus 24 h of the L1 group, Ip < .05 versus 24 h of the group L10.
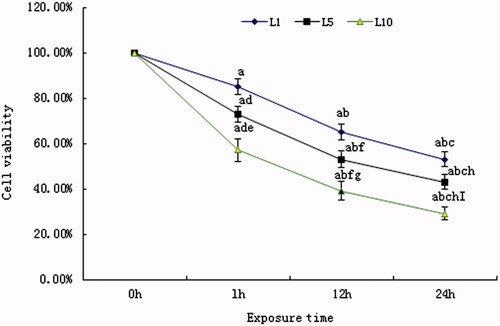
Figure 3. The cell death rate detected with Hoechst33342/PI. (A) The death cells untreated or treated with lidocaine hydrochloride (Hoechst33342/PI, 20×, bar = 50 µm). PI indicated the death cells, Hoechst33342 staining indicated the nucleus and the merged image was the combination of those two pictures (normal cells: untreated with lidocaine hydrochloride; L1: cells treated with 1 mM lidocaine hydrochloride for 24 h; L5: cells treated with 5 mM lidocaine hydrochloride for 24 h; L10: cells treated with 10 mM lidocaine hydrochloride for 24 h). (B) The death cells rate analysis (mean ± sd, n = 6), ap < .05 versus normal cells, bp < .05 versus cells in L1 group L1; cp < .05 versus cells in group L5.
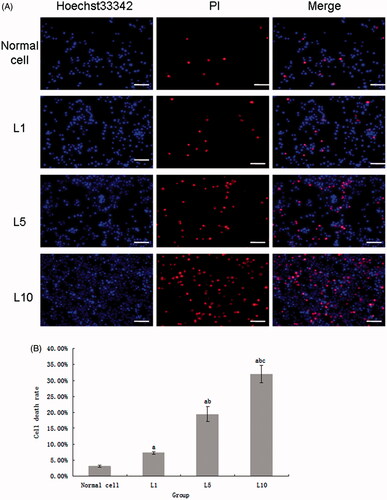
Figure 4. (A) The Cav3.1 expression of the cultured cells untreated or treated with lidocaine hydrochloride (Cy3-DAPI, 200×, bar = 20μm). Cy3 indicated the Cav3.1 protein expression, DAPI staining indicated the nucleus, and the merged image was the combination of those two pictures (normal cells: untreated with lidocaine hydrochloride; L1: cells treated with 1 mM lidocaine hydrochloride for 24 h; L5: cells treated with 5 mM lidocaine hydrochloride for 24 h; L10: cells treated with 10 mM lidocaine hydrochloride for 24 h). (B) The Cav3.1 positive cells analysis (mean ± sd, n = 6), ap < .05 versus normal cells, bp < .05 versus cells in the L1 group L1; cp < .05 versus cells in L5 group.
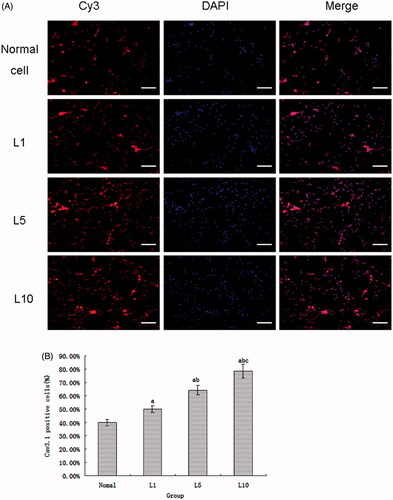
Figure 5. Cav3.1 protein expression of the SH-SY5Y cells treated with 1, 5 and 10 mM lidocaine hydrochloride (mean ± sd, n = 6). (A) Represents band of the Cav3.1 protein and β-actin. (B) Comparison among the groups, ap < .05 versus 0 h, bp < .05 versus 1 h, cp < .05 versus 12 h; comparison in intergroups, dp < .05 versus 1 h of the L1 group, ep < .05 versus 1 h of the L5 group, fp < .05 versus 12 h of the L1 group, gp < .05 versus 12 h of the L5 group.
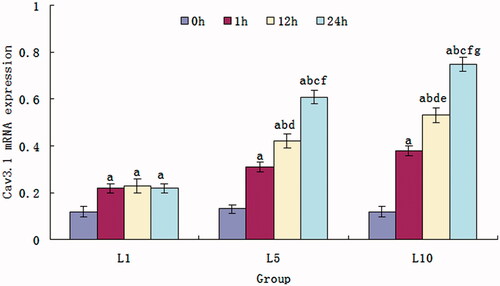
Changes of Cav3.1 mRNA expression caused by lidocaine hydrochloride
shows the expression of the Cav3.1 mRNA of the cells treated with lidocaine hydrochloride. About 1 mM lidocaine hydrochloride induced the increases of the Cav3.1 mRNA expression, but there was no significant difference among the exposure time for 1 h, 12 h and 24 h. The expression of the Cav3.1 mRNA of the cells in the L5 and L10 group gradually increased with the time extension of the exposure to the lidocaine hydrochloride from 1 h to 24 h and raise of the lidocaine hydrochloride concentration from 1 mM to 10 mM.
Figure 6. Cav3.1 mRNA expression of the SH-SY5Y cells treated with 1, 5 and 10 mM lidocaine hydrochloride (mean ± sd, n = 6). Comparison among the groups, ap < .05 versus 0 h, bp < .05 versus 1 h, cp < .05 versus 12 h; Comparison in intergroups, dp < .05 versus 1 h of the L1 group, ep < .05 versus 1 h of the L5 group, fp < .05 versus 12 h of the L1 group, gp < .05 versus 12 h of the L5 group.
Discussions
In this study, we selected the highest concentration of lidocaine hydrochloride is 10 mM, this is because of the LD50 of lidocaine on SH-SY5Y cells for 14 mM, the equivalent of 0.4% clinical concentration of lidocaine. The point of 10 mM lidocaine hydrochloride in SH-SY5Y cell viability–concentration curve is located on the steep-straight parts. Just a minor change of the lidocaine hydrochloride concentration resulted an obvious change of the cell viability.
In this study, we employed the SH-SY5Y cells to observe the neurotoxicity of the lidocaine. SH-SY5Y cell is one tumour cell with poor differentiation and fast breeding. It possesses a similar cell morphology and physiology function with the normal neurons. Therefore, SH-SY5Y cells are often applied as a vehicle to investigate the function of the neuron [Citation13–15]. The current study indicated that lidocaine hydrochloride caused neurotoxicity to the SH-SY5Y manifested morphological changes and viability decreases of the cells. Neurotoxicity induced by lidocaine hydrochloride was involved with the concentration and exposure time. High concentration (10 mM) and prolonged exposure (24 h) resulted irreversible changes in the cells, even cell death. Those results are concordant with the previous studies [Citation14]. Perez-Castro et al. found that SH-SY5Y cells become round and extension disappears after treated with 10 mM lidocaine for 20 min. In this study, we observed the effects of different concentrations of lidocaine hydrochloride on the SH-SY5Y cells. The EC50 (concentration that exerts 50% of the maximal cell killing capacity of a LA) and the LD50 (LA-concentrations at which about 50% of the cells were dead) of the lidocaine hydrochloride to SH-SY5Y cells were 15.7 mM and 14 mM, respectively, We chose the highest concentration of the lidocaine hydrochloride (10 mM) which was lower than the EC50 and LD50, because the drug concentration in clinic is impossible more than the EC50 and LD50.
Cav3.1 has been detected in SH-SY5Y cells and it was the main subtype T-type calcium channel in SH-SY5Y cells [Citation11]. In this study, we detected the Cav3.1 protein and mRNA expression in SH-SY5Y cells after treated with different concentrations of lidocaine hydrochloride. The results indicated that lidocaine hydrochloride up regulated the Cav3.1 protein and mRNA expression. From those data, we deduced that the neurotoxicity of the SH-SY5Y cells induced by lidocaine hydrochloride was involved with Cav3.1 channel expression upregulation. It is well known that the neurotoxicity of the local anaesthetics was related with the overload of the cellular calcium ion [Citation16–20]. Cav3.1 expression upregulation resulted in SH-SY5Y cells injury by induced cellular Ca2 + overload. First, Ca2+ entering through T-type calcium channels nearby resting potential resulted in cell depolarization and activated HVA to further increase the cellular calcium ion [Citation21]. Second, elevation of the intracellular Ca2 + concentration by the T-type calcium channel will initiate the Ca2+-induced Ca2 + release (CICR) from endoplasmic reticulum [Citation22]. Finally, T-type calcium couples with Ca2+-dependent ion channel to modulate the function status of the T-type calcium channel. For example, T-type Ca2 + channels are selectively coupled to Ca2+-activated small conductance-type K + (SK) channel, which promoted the T-type Ca2 + channel transition from deactivation to activation and elevated the cellular Ca2 + concentration [Citation23,Citation24].
Some limitations of this study should be noted. First, the current study adopted SH-SY5Y cells, which was one cell model in vitro, so the results cannot be simply deduced in clinic. There were many differences between in vitro and in vivo. Second, we have not examined the changes of Cav3.1 currents density in SH-SY5Y cells. Although the upregulation of the Cav3.1 protein and mRNA in SH-SY5Y cells induced by lidocaine hydrochloride had been detected, we could not test the increases of the Cav3.1 currents density. There were some further works to do to test the role of the T-type calcium in the neurotoxicity induced by lidocaine hydrochloride.
Conclusion
In summary, the current study suggests that the neurotoxicity of the lidocaine hydrochloride was involved with the concentration and exposure time. As well as, lidocaine hydrochloride up regulates Cav3.1 protein and mRNA expression in SH-SY5Y cells. These results provide a novel insight into the mechanisms underlying the neurotoxicity of lidocaine hydrochloride and a new target for development of medicine.
Disclosure statement
No potential conflict of interest was reported by the authors.
Additional information
Funding
References
- Auroy Y, Benhamou D, Bargues L, et al. Major complications of regional anesthesia in France: the SOS Regional Anesthesia Hotline Service. Anesthesiology. 2002;97:1274–1280.
- Yamashita A, Matsumoto M, Matsumoto S, et al. A comparison of the neurotoxic effects on the spinal cord of tetracaine, lidocaine, bupivacaine, and ropivacaine administered intrathecally in rabbits. Anesth Analg. 2003;97:512–519.
- Umbrain VJ, Lauwers MH, Shi L, et al. Comparison of the effects of intrathecal administration of levobupivacaine and lidocaine on the prostaglandin E2 and glutamate increases in cerebrospinal fluid: a microdialysis study in freely moving rats. Br J Anaesth. 2009;102:540–545.
- Kasaba T. Neurotoxicity of local anesthetics shown by morphological changes and changes in intracellular Ca2+ concentration in cultured neurons of Lymnaea stagnalis. J Anesth. 2007;21:538–539.
- Kasaba T, Onizuka S, Kashiwada M, et al. Increase in intracellular Ca2+ concentration is not the only cause of lidocaine-induced cell damage in the cultured neurons of Lymnaea stagnalis. J Anesth. 2006;20:196–201.
- Johnson ME, Saenz JA, DaSilva AD, et al. Effect of local anesthetic on neuronal cytoplasmic calcium and plasma membrane lysis (necrosis) in a cell culture model. Anesthesiology. 2002;97:1466–1476.
- Saito S, Radwan IA, Nishikawa K, et al. Intracellular calcium increases in growth cones exposed to tetracaine. Anesth Analg. 2004;98:841–845.
- McRory JE, Santi CM, Hamming KS, et al. Molecular and functional characterization of a family of rat brain T-type calcium channels. J Biol Chem. 2001;276:3999–4011.
- Feltz A. Low-threshold-activated Ca channels: from molecules to functions: over 25 years of progress. Crit Rev Neurobiol. 2006;18:169–178.
- Cueni L, Canepari M, Adelman JP, et al. Ca(2+) signaling by T-type Ca(2+) channels in neurons. Pflugers Arch. 2009;457:1161–1172.
- Wen X, Xu S, Wang L, et al. T-type calcium channel expression in cultured human neuroblastoma cells. Neural Regen Res. 2011;6:2405–2409.
- Wen X, Xu S, Zhang Q, et al. Inhibitory gene expression of the Cav3.1 T-type calcium channel to improve neuronal injury induced by lidocaine hydrochloride. Eur J Pharmacol. 2016;775:43–49.
- Wen X, Xu S, Liu H, et al. Neurotoxicity induced by bupivacaine via T-type calcium channels in SH-SY5Y cells. PLoS One. 2013;8:e62942.
- Perez-Castro R, Patel S, Garavito-Aguilar ZV, et al. Cytotoxicity of local anesthetics in human neuronal cells. Anesth Analg. 2009;108:997–1007.
- Dajas‐Bailador FA, Mogg AJ, Wonnacott S. Intracellular Ca2+ signals evoked by stimulation of nicotinic acetylcholine receptors in SH-SY5Y cells: contribution of voltage-operated Ca2+ channels and Ca2+ stores. J Neurochem. 2002;81:606–614.
- Hartley D, Kurth M, Bjerkness L, et al. Glutamate receptor-induced 45Ca2+ accumulation in cortical cell culture correlates with subsequent neuronal degeneration. J Neurosci. 1993;13:1993–2000.
- Johnson ME, Gores GJ, Uhl CB, et al. Cytosolic free calcium and cell death during metabolic inhibition in a neuronal cell line. J Neurosci. 1994;14:4040–4049.
- Wen XJ, Li XH, Liang H, et al. One cell model establishment to inhibit CaMKIIγ mRNA expression in the dorsal root ganglion neuron by RNA interfere. Artif Cells Nanomed Biotechnol. 2017;45:1227–1233.
- Wen XJ, Liang H, Li H, et al. In vitro neurotoxicity by ropivacaine is reduced by silencing Cav3.3 T-type calcium subunits in neonatal rat sensory neurons. Artificial Cells Nanomed Biotechnol. 2017 [cited 2017 Oct 3]; [8 p.]. DOI:https://doi.org/10.1080/21691401.2017.1384386
- Wen XJ, Li XH, Li H, et al. CaMK II γ down regulation protects dorsal root ganglion neurons from ropivacaine hydrochloride neurotoxicity. Sci Rep. 2017;7:5262.
- Cain SM, Snutch TP. Contributions of T-type calcium channel isoforms to neuronal firing. Channels (Austin, Tex). 2010;4:475–482.
- Richter TA, Kolaj M, Renaud LP. Low voltage-activated Ca2+ channels are coupled to Ca2+-induced Ca2+ release in rat thalamic midline neurons. J Neurosci: Off J Soc Neurosci. 2005;25:8267–8271.
- Yun J, Park H, Ko JH, et al. Expression of Ca2+ -activated K + channels in human dermal fibroblasts and their roles in apoptosis. Skin Pharmacol Physiol. 2010;23:91–104.
- Stocker M. Ca(2+)-activated K + channels: molecular determinants and function of the SK family. Nat Rev Neurosci. 2004;5:758–770.