
Abstract
Migration of fibroblasts into wound area is a critical phenomenon in wound healing process. We used an appropriate system to fabricate an electrospun bioactive scaffold with controlled release of PDGF-BB in order to induce migration of primary skin fibroblast cells. First of all, protein-loaded chitosan nanoparticles based on ionic gelation interaction between chitosan and sodium tripolyphosphate were prepared. Then polycaprolactone electrospun fibers containing chitosan nanoparticles or PDGF-BB-loaded chitosan nanoparticles were prepared. Cellular attachment and morphology of cells seeded on scaffolds with or without PDGF-BB were evaluated by using a fluorescence microscope and scanning electron microscopy. Cells were well-oriented 72 h after seeding on the scaffolds containing PDGF-BB. The mean aspect ratio of populations on scaffold containing PDGF-BB-loaded chitosan nanoparticles was significantly greater than those on the scaffold containing chitosan nanoparticles but no PDGF-BB. Furthermore, the Arp2 gene, which is involved in cell protrusion formation, showed about three times more expression at mRNA level, in cells seeding on PDGF-BB-containing scaffold compared to cells seeding on scaffold containing only chitosan nanoparticles, using Real Time PCR test. Finally, under agarose migration assay results demonstrated that cells’ chemotaxic behavior was more toward scaffold containing PDGF-BB compared to the PDGF-BB alone or FBS group. In addition, in terms of distance, the cell mass could grow faster, in response to scaffold containing PDGF-BB compared to FBS or PDGF-BB alone; however, the number of migrating cells might be the same or significantly higher in the latter groups.
Introduction
Migration of fibroblasts into wound area is an important phenomenon in progression of wound repair [Citation1–3]. PDGFs are a family of dimeric disulfide-bound growth factors, which are important for growth, survival and function in several types of connective tissue cells. Among different isoforms of PDGF ligands and their receptors, PDGF-BB and PDGFRβ are generally accepted [Citation1,Citation4–7]. Many investigations have been focused on the usage of PDGF-BB and wound healing acceleration [Citation8–12] as well as the usage of PDGF-BB and the number of fibroblasts at wound site [Citation13,Citation14]. Electrospinning is a user-friendly technique to produce smooth fibers with a wide range of diameter from tens of nanometers to a few micrometers [Citation15]. Due to large surface to volume ratio of fibers, these scaffolds allow better delivery of biomolecules and better attachment and proliferation of cells [Citation16–19]. One of the most challenging issues in loading of proteins within nanofibrous scaffolds is maintaining the bioactivity of the protein. Many investigations have focused on efficient delivery of rhPDGF-BB for wound healing and tissue regeneration, e.g. PLGA microspheres containing PDGF-BB were incorporated into PLLA nanofibers showed controlled release of PDGF-BB [Citation20]. PDGF-BB in combination with PLA-PEG block copolymer and PLGA were spinned and used for studying the effect of released PDGF-BB on migration of fibroblast cells [Citation21]. Since chitosan has an antibacterial anti-inflammatory effects that could be useful for wound healing process [Citation22], and our team has also previously applied an electrospinning methodology, which was inspired by the work of Wang et al. [Citation23] using chitosan nanoparticles as protein vehicle for loading into polycaprolactone (PCL) [Citation23,Citation24], we fabricated an electrospun PCL scaffold, which was incorporated with PDGF-BB–loaded chitosan nanoparticles and studied the effects of topography and drug release of these scaffolds on proliferation and migration of fibroblast cells. We also designed a modified under agarose migration assay for monitoring and measuring the proliferation and migration rate of fibroblast cells in response to PDGF-BB alone or PDGF-BB incorporated in the scaffold as well as FBS. We used Hoechst 33342 for labeling the cells, as this nucleic fluorescent dye is used for DNA labeling of viable cells [Citation25,Citation26]. The migration of cells studied through two aspects: number of migrating cells and the distance of migrated cells from the border of central well at days 3 and 6.
Materials and methods
Materials
Polycaprolactone was purchased from Sigma (Sigma Aldrich, St. Louis, MO). Chitosan was purchased from Sigma (Sigma Aldrich, St. Louis, MO). Recombinant human PDGF-BB was obtained from Peprotech (PeproTech, Rocky Hill, NJ). Human PDGF-BB quantikine ELISA kit was bought from R&D systems (R&D Systems, Abingdon, UK). Cloning cylinders were obtained from Sigma. Ultrapure agarose were obtained from Invitrogen (Carlsbad, CA).
Electrospun scaffolds fabrication
The general scaffold fabrication methodology was followed as previously described by our laboratory [Citation23,Citation24,Citation27]. Briefly PDGF-loaded chitosan nanoparticles were prepared according to ionic gelation process using sodium tri-poly-phosphate TPP cross-linker. After collecting nanoparticles by ultracentrifuge, they were added to the PCL solution in chloroform (in the presence of 2% v/v Tween-80). Random orientation of nanofibers was obtained using the electrospinning device (Nano model) with a flow rate of .5 ml/h, high voltage of 24 kV, operating at a distance of 20 cm and also drum speed of 500 rpm. It is worth mentioning that 600 ng of PDGF was loaded into nanoparticles.
Morphological and mechanical characterizations
Plasma surface modification and scanning electronic microscopy (SEM) were done according to a previous report [Citation19]. The mean diameter was determined using SEM images in combination with Image J. For more clarification of the PDGF-NPs containing PCL electrospun nanofibers, transmission electron microscopy (TEM) was used. Images were obtained by high-resolution transmission electron microscopy (HRTEM; JEM-3010, JEOL, Japan) (Oxford apparatus) operated at 300 kV using samples deposited on TEM-copper-grid. Mechanical characteristics of the scaffolds were determined using Galdabini testing equipment (Sun 2500, Galdabini, Italy) according to the previously reported method [Citation16].
In vitro release kinetic of PDGF-BB from chitosan NPs
To measure the PDGF-BB release from nanofibrous scaffolds, about 100 mg of nanofibrous mesh was placed in a dish containing 10 ml PBS incubated at 37 ± 1 °C. During the periodic time points, three 100 µl samples were taken and replaced with 100 µl fresh PBS. Finally, collected samples were stored for ELISA kit analysis. Cumulative release percentage was calculated based on accumulated release mass in comparison with initial loaded mass.
Cell culture for SEM and DAPI
Fibroblast cells were obtained from National Cell Bank of Iran (NCBI, Pasteur Institute, Tehran, Iran) and grown in basal media containing Dulbecco’s-modified Eagle’s Medium-Low Glucose (DMEM-LG, GIBCO Invitrogen; Carlsbad, CA) containing 10% fetal bovine serum (FBS, Sigma Aldrich, St Louis, MO, USA) and 1% penicillin/streptomycin (Invitrogen; Carlsbad, CA). The cells were passaged when they were confluence. The cells were used between passages 12–15 and when they reach the confluence they were serum starved for 24 h before using for the proliferation and migration experiments. For scaffolds’ biocompatibility and cell attachment evaluation, samples were fixed by glutaraldehyde for scanning electron microscopy and by paraformaldehyde for nucleic staining with DAPI (4′,6-diamidino-2-phenylindole). Briefly, cells were seeded with high density in the final volume of 500 µl DMEM supplemented with 10% FBS on PCL nanofibers, PCL nanofibers with incorporated chitosan nanoparticles (PCL/NP) or incorporated chitosan nanoparticles loaded with PDGF-BB (PCL/NP/PDGF-BB) in a 24–wells tissue culture plate and incubated for 72 h. For nucleic staining, cells were fixed in paraformaldehyde 4% for 20 min at 4 °C, after that samples were washed with PBS and placed in DAPI solution with concentration of 2 µg/ml for 30 s. Then samples were washed three times with PBS. For SEM, samples were fixed in glutaraldehyde solution (2.5%) for 2 h, and then dehydrated in graded concentration of ethanol (50, 60, 70, 80, 90 and 100%) incubated for 10 min intervals. Finally, dehydrated scaffolds were sputter coated with platinum, and visualized with a SEM (S-4500; Hitachi, Japan) at an accelerating voltage of 20 kV.
Proliferation assay
Punched scaffolds (1 cm2) were put on sterilized filtered ethanol for 2 h then washed with PBS and DMEM and transferred to 24-well plate. Cloning glass cylinders of volume 150 µl (Sigma Aldrich, St. Louis, MO) were placed at the center of the scaffolds and cells were seeded with concentration of 6000 in 30 μl DMEM supplemented with 3% FBS inside the cylinders. For samples without scaffolds (TCPS), 6000 of cells in a droplet of 30 μl media containing 3% FBS were seeded at the center of the wells. Samples were incubated for more than 1 h at 37 °C and 5% CO2 and 95% humidity. Then, 470 μl of serum–free DMEM supplemented with 1 ng PDGF-BB was added to one group as positive TCPS (TCPS/PDGF-BB), but for the negative TCPS, PCL/NP and PCL/NP/PDGF-BB groups, only 470 μl of serum–free DMEM was gently added. MTT assay were performed at days 0, 1, 3, 5. Briefly MTT (3–(4,5-dimethylthiazol-2-yl)-2,5-diphenyl tetrazolium bromide; Sigma catalog no. M2128) was dissolved in PBS at 5 mg/ml and filtered to sterilize and was added in final concentration of 10% to each sample. The samples were incubated for 3 h at 37 °C and 5% CO2 and then gently aspirated. Finally, the medium was removed and the developed formazan crystal was rinsed by DMSO, then pipetted out in 96–well plates; the absorbance was recorded at 570 nm using an Eppendorf BioPhotometer (Eppendorf, Hamburg, Germany).
Gene expression
The gene expression analysis by real time RT-PCR was used for evaluation of the two important genes related to the migration such as actin-related protein 2 (Arp2, ACTR2) and platelet-derived growth factor receptor-beta (PDGFRB) in PCL/NP, PCL/NP/PDGF-BB and TCPS as control group. Briefly, 15,000 cells in the volume of 30 µl DMEM supplemented with 4% FBS were seeded inside the cylinders in each group and after 2 h incubation at 37 °C and 5% CO2, 470 µl of serum-free DMEM was gently added to the samples and cylinders were removed to RNA extraction, cDNA synthesis and real time RT-PCR according to the previously reported method [Citation27]. The primers sequences are shown in .
Under agarose migration assay
The chemotactic characteristics of PDGF-BB incorporated in the scaffold or alone was evaluated through an under agarose migration assay with the three well pattern. The system was set up according to Nelson et al.’s method [Citation28], but with some modifications (see Supplementary file 1).
Statistics
Gene expression results were analyzed by REST 2009 software (Qiagen, Hilden, Germany) for each sample. Experiments were repeated three times and all of the data were reported as means ± standard deviation (SD). Comparison of data was done through one-way analysis of variance (ANOVA). All analyses were performed by SPSS 17.0 software (SPSS Inc., Chicago, IL, USA). The p-values of less than .05 were considered as statistically significant.
Results
Physical characterization of nanoparticles and nanofibers
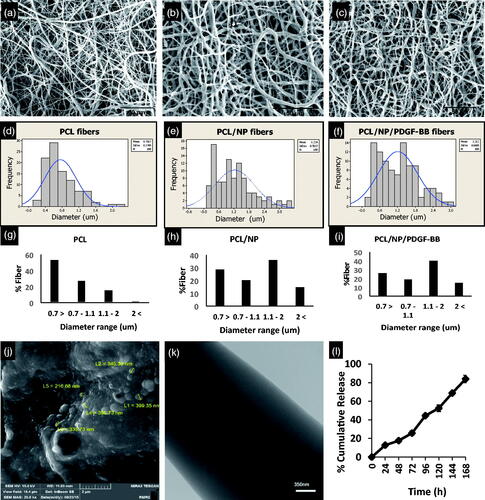
Scanning electron microscope images represent random orientation of fibers with enough porosity in all three groups of PCL, PCL/NP and PCL/NP(PDGF) (). Using histogram of diameter distribution, it could be simply concluded that mean diameter of nanofibers in PCL/NP and PCL/NP/PDGF-BB scaffolds was significantly more than PCL nanofibers (p ≤ .05). As well as, there is no noticeable difference between PCL/NP and PCL/NP(PDGF) fibers’ mean diameter. The mean diameter of fibers in PCL scaffold was .76 ± .37 (), while in PCL/NP and PCL/NP(PDGF) groups it was 1.22 ± .78 and 1.21 ± .66 µm, respectively (). In addition, standard division of diameter distribution in both types of scaffold containing chitosan NPs, was more than PCL group (). Moreover, in the PCL group, 58% of fibers are less than 700 nm and 18% of fibers are above 1.1 µm in diameter (). However, in PCl/NP 29% and in PCL/NP/PDGF-BB 26% of fibers are with diameter less than 700 nm and 50% and 52% of fibers are with diameter above 1.1 µm, respectively (). PDGF-loaded chitosan nanoparticles have exhibited spherical morphology with an average diameter of 306.30 nm (). TEM images roughly demonstrated the distribution of PDGF-loaded chitosan nanoparticles within core phase of nanofibers. On the other hand, PCL is consisted of shell phase of fibers ().
Figure 1. Morphology and diameter of fibers in three types of scaffolds. SEM images of PCL nanofiber without (a), with Chitosan nanoparticles (b) and Chitosan nanoparticles loading with PDGF-BB (c). Incorporation of Chitosan NPs increased the mean diameter and diameter distribution of fibers in groups PCL/NP (e) and PCL/NP/PDGF-BB (f) compared to the group PCL (d). Fiber diameter percentage at different ranges is shown for PCL (g), PCL/NP (h) and PCL/NP/PDGF-BB (i) using images a, b and c in conjunction with ImageJ. SEM photograph of chitosan nanoparticles (j), TEM images of PCL nanofiber containing chitosan nanoparticles (k) and in vitro release profile of PDGF-BB encapsulated in chitosan nanoparticles incubated in dH2O at room temperature on a rotary shaker at 70 rpm (l).
Sustained release profile of PDGF-BB
As shown in , around 12% of PDGF-BB released from scaffold during first 24 h (cumulative amounts), which obtained using a dynamic dialysis method. Over the 72 h course, the cumulative amounts of released PDGF-BB were almost 25%. Encapsulated PDGF-BB was released only 7% between 48 and 72 h, but PDGF-BB released between 72 and 96 h was increased to 20%. Overall, a sustained release of PDGF-BB was achieved and slowly released to around 83% after one week.
Mechanical properties
By obtaining stress–strain curve of PCL, PCL/NP and PCL/NP(PDGF), we could simply investigate the effect of nanoparticles and PDGF on different mechanical parameters such as ultimate tensile strength, strain at break and elastic modulus. All these data were summarized in . As seen, loading of chitosan nanoparticles meaningfully decrease the ultimate tensile strength and elastic modulus of the scaffold while there is no significant difference in these properties by adding PDGF. Albeit, there is no significant difference in strain at break of PCL/NP(PDGF) and PCL/NP, that of PCL/NP is dramatically more than PCL.
Table 2. Different mechanical parameters such as ultimate tensile strength, strain at break and elastic modulus of PCL, PCL/NP and PCL/NP(PDGF).
Table 1. Primers used in real-time RT-PCR.
Cell attachment and growth on different substrate
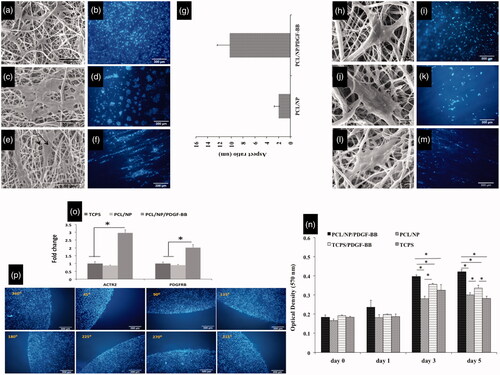
Comparing SEM and fluorescence images revealed that cells seeded on the PCL scaffold are well connected to each other () but they distributed uniformly on PCL nanofibers (). By comparing the direction of long axis of cells, the result achieved was that the orientation of each cell is different from other cells, so they exhibited random orientation on PCL scaffold (). In fluorescent images, this is differentiable by the orientation of cells’ nucleuses (). Cells seeded on PCL/NP showed completely different attachment and growth behavior compared to those seeded on PCL group. Comparing SEM and fluorescent images revealed that these cells were firmly connected to each other () and it is not possible to distinguish cells from each other () compared to PCL group in which cells were to some extent distinguishable (). Moreover, cells on PCL/NP nanofibers did not distributed uniformly and there are cell-free spaces between dense population of cells (). By an insight, looking at the general conclusion achieved is the cell growth occurred in the form of several masses of cells growth and the ratio between long axis and short axis of these masses is not big, so it seems that these masses were growing and getting bigger in all directions. Based on this notion and the orientation of cells’ nucleuses, we can conclude that cells exhibited random orientation on PCL/NP nanofibers. shows the aspect ratio of cell masses in groups PCL/NP and PCL/NP/PDGF-BB. The aspect ratio of masses created by cells on PCL/NP/PDGF-BB nanofibers is much bigger than those on PCL/NP reflecting the fact that in PCL/NP/PDGF-BB group these masses were growing in one direction much faster than other directions. Moreover, in PCL/NP/PDGF-BB masses of cells were completely aligned with each other () and most of the cells’ nucleuses had almost the same directions () so that cells were completely oriented 72 h after seeding on PCL/NP/PDGF-BB group. In addition, SEM and fluorescent data revealed that when cells were seeded with low density, single cells appeared on the scaffolds particularly on scaffolds with chitosan NPs. Unlike on PCL nanofibers (), these cells were not connected well to each other on PCL/NP nanofibers and could not spread well and distribute uniformly on these fibers to show a good proliferation (). Also, single cells were well oriented 72 h after seeding on PCL/NP/PDGF-BB nanofibers () but were not connected well to each other and could not protrude well enough, which is suitable for a good proliferation () to form a uniform population of cells on the substrate compared to the PCL group (). Hence, it seems that they proliferate easier on PCL group compared to both types of scaffolds incorporated with chitosan nanoparticles.
Figure 2. Growth morphology of cells on three types of scaffold. Cells prefer to growth in the form of several dens populations of cells on PCL/NP nanofibers (c,d) and PCL/NP/PDGF-BB nanofibers (e,f) compared to cells growth on PCL nanofibers (a,b) which distributed uniform with random orientation on the substrate. Cell masses on PCL/NP/PDGF-BB (e,f) are aligned and well oriented compared to cell masses on PCL/NP (c,d). The mean aspect ratio of cell masses in two types of scaffolds containing chitosan nanoparticles (g). Morphology of cells when they are seeded with low density on three types of scaffolds. Single cells on PCL/NP (j,k) and PCL/NP/PDGF-BB (l,m) nanofibers cannot protrude and spread well enough compared to single cells on the PCL nanofibers (h,i). They are also well oriented on PDGF-BB-containing nanofibers (m) compared to single cells on PCL/NP (k) and PCL (i) nanofibers. Quantitative measurements of cell proliferation in four different serum starved conditions (n). Arp 2 and PDGFRβ gene expression at mRNA level of cells seeding on PCL/NP/PDGF-BB and PCL/NP compared to TCPS as control (o). Cells were seeded with same confluences in different positions of the central well (p).
Cell proliferation-MTT assay
Based on MTT results as shown in , cells on PCL/NP/PDGF-BB have higher rate of proliferation till days 3 and 5 compared to the cells on TCPS/PDGF-BB and other two groups (p ≤ .05). At day 3, this rate in TCPS/PDGF-BB was more than PCL/NP (p ≤ .05) but almost the same as TCPS. PCL/NP and TCPS also did not show a significant difference on this day. At day 5, the number of active cells in TCPS/PDGF-BB was more than TCPS and PCL/NP (p ≤ .05).
Gene expression-real time PCR
Based on the CTs obtained from our real time PCR test (), cells which were seeded on scaffolds containing chitosan NP/PDGF-BB, showed about two times greater gene expression of PDGFβ receptor at mRNA level compared to the other groups (p ≤ .05). In this group, the expression rate of Arp 2 gene at mRNA level was about three times higher than other groups (p ≤ .05). In addition, cells seeded on the scaffolds, which contained only chitosan NP, did not show significant differences in expression of both genes compared to cells seeded on TCPS.
Under agarose migration assay
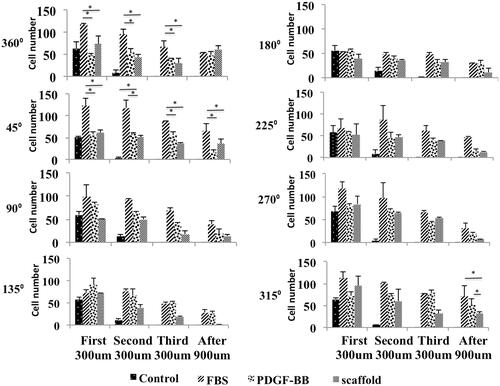
Photos of day 0 showed that cells were distributed uniformly inside the central well so all positions had the same confluences of cells at this day (). Days after cells could diffuse under the agarose gel and proliferate and migrate under the gel (). In control group, cell migration rate at all positions was the same but in other groups particularly in scaffold group at day 6, cell migration rate at positions facing the chemo-attractant was almost more than other positions ()). Based on the number of migrating cells at day 3, at positions 315° and 45° in PDGF-BB group was significantly more than scaffold group but at position 360° they had almost the same number of migrating cells. Moreover, at this position the scaffold group had more number of migrating cells compared to FBS group (p ≤ .05) but at positions 315° and 45° the scaffold group and FBS group did not show a significant difference (). At position 180°, PDGF-BB group had the most number of migrating cells (p ≤ .05) (). shows the cell confluences in different zones with different distances from the border of central well in each position at day 3. Based on this figure, the only group that had a few number of cells at zone 4 of positions 315°, 360° and 45° was scaffold group reflecting the fact that at these positions the cell mass has moved more distance in scaffold group compared to other groups. FBS group did not have any cells even at zone 3 of these positions ( 315°, 360°, 45°). Hence, the cell mass has moved less distance in FBS group compared to groups PDGF-BB and scaffold at day 3. Based on , the number of migrating cells at positions 360° and 45° at day 6 in FBS group was more than other groups (p ≤ .05) and at position 315° the three groups, which contained chemo-attractant, had almost the same number of migrating cells. At position 180°, FBS group had also the most number of migrating cells (p ≤ .05). The number of cells at zone 4 of different positions at day 6 is shown in . At position 360°, the three groups, which contained chemo-attractant, had same number of cells at zone 4 ( 360°) ut at position 45° FBS had the most number (p ≤ .05) ( 45°). At zone 4 of position 315°, the number of cells in FBS group and PDGF-BB group was more than scaffold group (p ≤ .05) (: 315°). shows the average distance of 10 cells, which had the farthest distance vertically from the border of central well in each position. At position 360°, the scaffold group had the most average distance (p ≤ .05) at days 3 and 6 (). At positions 315° and 45° at day 3, scaffold and PDGF-BB groups showed more average distance compared to FBS group (p ≤ .05) () but at day 6 the scaffold group and FBS group had more average distance than PDGF-BB group at these positions (p ≤ .05) (). At position 180°, these three groups did not show significant differences in average distance at day 3 () but at day 6 the average distance in PDGF-BB group was more than other groups at this position (p ≤ .05) (). Total number of migrating cells in each group was also measured at days 3 and 6 and is shown in . At day 3, PDGF-BB group had the most number of migrating cells (p ≤ .05) and the scaffold and FBS groups did not show a significant difference with each other. At day 6, FBS group had the most number of migrating cells (p ≤ .05) and scaffold group had the least number of migrating cells when compared with the three groups which contained the chemo-attractant (p ≤ .05) ().
Figure 3. Migration of cells from the border of central well toward under gel. Cells can diffuse from part A to part B. The border of the well is shown with black arrows (a). Schematic picture of cell distribution at day 6 when a chemo-attractant, particularly a punch of bioactive scaffold, was put inside one of the lateral wells (b). The cell mass grows till near the scaffold punch containing PDGF-BB at position 360° (c).
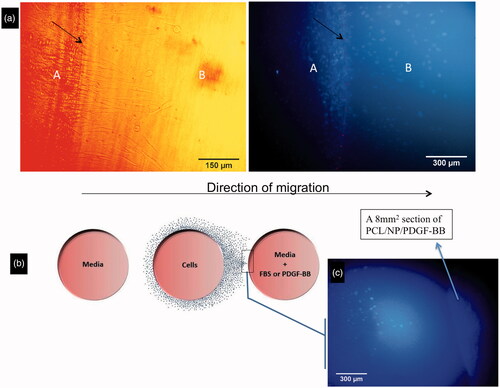
Figure 4. The average of 10 cells’ distances which were vertically farthest from the border of central well at 8 different positions, day 3 (a) and day 6 (b). Total number of migrating cells in different groups at days 3 and 6 (c).
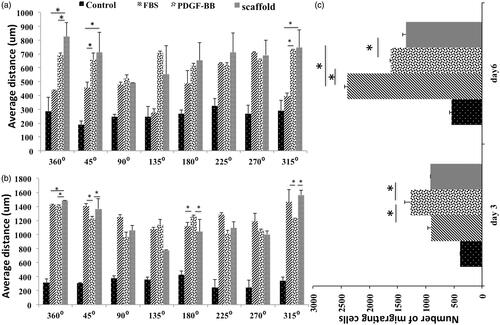
Figure 5. Total number of migrating cells at each position of central well circumference, day 3 (a) and day 6 (b). Cell counting in different zones of 8 positions at day 3 (c).
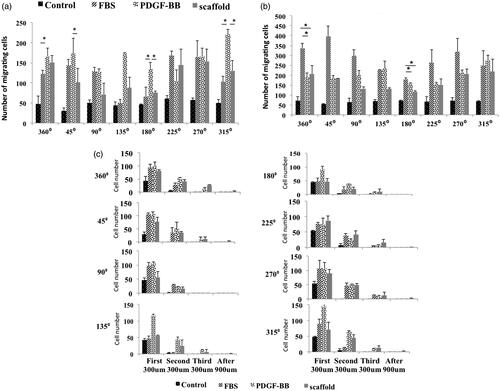
Figure 6. Cell counting in different zones of 8 positions at day 6.
Discussion
During the wound healing process, fibroblasts produce and deposit large quantities of matrix proteins, which contribute to the resolution of granulation tissue and provide an appropriate substrate for inflammatory cells to migrate to the injury site [Citation2,Citation29]. In the current work, an electrospun bioactive scaffold was synthesized with optimized mechanical and morphological properties as a wound dresser with capability of PDGF-BB delivery into wound area to induce migration and proliferation in primary fibroblast cells. In comparison with previous studies, which were done by our group [Citation24,Citation30,Citation31], larger chitosan nanoparticles were obtained which help to obtain more sustained release of protein. Also, due to this larger size of particles, a linear viscosity gradient was not formed in their suspension within PCL solution, so they cannot linearly aligned along the axes of fabricated fibers. Normally, topographical cues define cells morphology, for instance, the cells exhibit random orientation particularly on random fibers with diameter above 1 µm [Citation32,Citation33]. We suggested that the alignment of the cells on scaffold containing PDGF-BB is induced by released PDGF-BB. Moreover, on fibrous scaffold containing chitosan nanoparticles, single cells could not show a good migratory behavior and they would prefer to grow in the form of dense populations. Hence, we predicted that well elongated cells with extended long axis as shown in with black arrows, are a population of cells which were growing toward one direction in response to released PDGF-BB. In our pervious study, poly-L-lactic acid (PLLA) nanofibers with 651 ± 176 nm in diameter was used in combination with aloevera gel for wound dressing applications in mice full-thickness animal model and results showed that the rate of wound healing in the animals were treated by scaffold-gel was around 97.33% [Citation34]. MTT results also demonstrated that the number of active cells reduced after day 3 in TCPS group but this number at day 5 in group TCPS/PDGF was as same as day 3, so although PDGF-BB with constant concentration of 1 ng/ml did not affect the proliferation rate significantly in TCPS/PDGF-BB group till day 3 compared to TCPS group, but it showed a positive effect on the number of active cells after day 3 in the serum starved condition of group TCPS/PDGF-BB compared to TCPS group. So because the proliferation rate on PCL/NP group at days 1, 3 and 5 was almost the same with negative TCPS and at days 3 and 5 it was less than positive TCPS (p ≤ .05), significant highness in proliferation rate at days 3 and 5 in PCL/NP/PDGF-BB group compared to other three groups (p ≤ .05), reflects the robust effect of steady release of PDGF-BB on cell proliferation in serum starved condition of the experiment (less than .2% FBS) (). We got the same result in expression of Arp 2 gene at mRNA level. The activity of all subunits of the complex Arp2/3 is necessary for an efficient cell migration as given by the study showing that silencing of Arp2/3 complex subunits by siRNA reduced the capacity of migration in pancreatic cancer cells [Citation35]. In our gene expression results, cells seeding on PCL/NP/PDGF-BB have more expression level of PDGFRβ gene at mRNA level compared to the groups TCPS and PCL/NP (p ≤ .05), reflecting the bioactivity of released PDGF-BB and its effect on expression of Arp 2 gene which was more in PCL/NP/PDGF-BB compared to other two groups (p ≤ .05) ().
For better understanding of fibroblast cells migration to the injury site in response to PDGF-BB, we tried to simulate inflammatory conditions in terms of fibroblast migration by under agarose migration assay. Heit et al. [Citation36] used the under agarose assay for studying the effect of different chemo-attractants and inhibitors on migration of neutrophils and proposed a hierarchical model of two signaling pathways mediating the decision-making process of the neutrophils . Foxman et al. [Citation37] studied neutrophil orientation in the under agarose assay evaluating the effects of directional persistence versus chemotaxis on cell behavior in the presence of opposing gradients of two attractants. They demonstrated that a cell’s chemotactic bias in a given chemo-attractant array depends not only on the gradients present, but also on the cell’s memory of its recent chemo-attractant environment. They believed that cells migrating away from a local chemo-attractant source actually chemotaxic towards distant attractants. In the present study, we compared fibroblast cells’ behavior in response to PDGF-BB when it is incorporated or not incorporated in electrospun PCL/chitosan nanoparticles scaffolds as well as FBS. This comparison was conducted from two aspects: number of migrating cells and the distance of the cell mass from the edges of the central well. Based on our data, when the PDGF-BB was incorporated in the scaffold, the chemotactic effect of the agent on cells is much more obvious. By comparing the we can see that despite the number of migrating cells at position 360° in FBS group was significantly higher than other groups at day 6, but the average distance of 10 recorded cells in scaffold group was significantly more than other groups. In addition, the number of cells at zone 4 of this position at day 6 was the same in three groups, which contained chemo-attractants, so we can conclude that at day 6 the cell mass has moved more distance in scaffold group at position 360° compared to other groups. Although, the number of migrating cells in scaffold group and PDGF-BB group was the same at this position at days 3 and 6 (), but the average distance of 10-recorded cells in scaffold group was significantly more than PDGF-BB group at this position (p ≤ .05) (). Based on above-mentioned notions, we can conclude that the scaffold with steady and controlled release of PDGF-BB had more potential effect for induction of migration on fibroblast cells compared to the PDGF-BB alone, because while their effect on cell number was the same but chemotaxic effect of the scaffold in terms of cell mass growth and cell movement was more than PDGF-BB alone. This study indicates that despite single cells cannot show a good migratory behavior on electrospun PCL scaffolds containing chitosan nanoparticles, when they are seeded with high density on these scaffolds, they can proliferate in the form of dense population of cells and when PDGF-BB is incorporated in the scaffold, these populations grow and migrate faster towards one direction. We also demonstrate that releasing PDGF-BB from electrospun scaffold have more potential to induce proliferation and migration of fibroblast cells compared to PDGF-BB with a primary constant concentration.
Supplementary_file_1-_Under_Agarose_migration_assay.docx
Download MS Word (13.3 KB)Disclosure statement
The authors declare no competing financial and non-financial interests.
Additional information
Funding
Related Research Data
References
- Seppa H, Grotendorst G, Seppa S, et al. Platelet-derived growth factor in chemotactic for fibroblasts. J Cell Biol. 1982;92:584–588.
- Li J, Chen J, Kirsner R. Pathophysiology of acute wound healing. Clin Dermatol. 2007;25:9–18.
- Gurtner GC, Werner S, Barrandon Y, et al. Wound repair and regeneration. Nature. 2008;453:314–321.
- Yu J, Moon A, Kim H-RC. Both platelet-derived growth factor receptor (PDGFR)-α and PDGFR-β promote murine fibroblast cell migration. Biochem Biophys Res Commun. 2001;282:697–700.
- Fiedler J, Röderer G, Günther KP, et al. BMP‐2, BMP‐4, and PDGF‐bb stimulate chemotactic migration of primary human mesenchymal progenitor cells. J Cell Biochem. 2002;87:305–312.
- Jones A, Cross N. Oncogenic derivatives of platelet-derived growth factor receptors. Cell Mol Life Sci. 2004;61:2912–2923.
- Tokunaga A, Oya T, Ishii Y, et al. PDGF receptor beta is a potent regulator of mesenchymal stromal cell function. J Bone Miner Res. 2008;23:1519–1528.
- Mustoe TA, Cutler NR, Allman RM, et al. A phase II study to evaluate recombinant platelet-derived growth factor-BB in the treatment of stage 3 and 4 pressure ulcers. Arch Surg. 1994;129:213–219.
- Pierce GF, Tarpley JE, Allman RM, et al. Tissue repair processes in healing chronic pressure ulcers treated with recombinant platelet-derived growth factor BB. Am J Pathol. 1994;145:1399.
- Pierce GF, Tarpley JE, Tseng J, et al. Detection of platelet-derived growth factor (PDGF)-AA in actively healing human wounds treated with recombinant PDGF-BB and absence of PDGF in chronic nonhealing wounds. J Clin Invest. 1995;96:1336.
- Robson MC, Mustoe TA, Hunt TK. The future of recombinant growth factors in wound healing. Am J Surg. 1998;176:80S–82S.
- Margolis DJ, Crombleholme T, Herlyn M. Clinical protocol: hase I trial to evaluate the safety of H5. 020CMV. PDGF‐B for the treatment of a diabetic insensate foot ulcer. Wound Repair Regen. 2000;8:480–493.
- Greenhalgh DG, Sprugel KH, Murray MJ, et al. PDGF and FGF stimulate wound healing in the genetically diabetic mouse. Am J Pathol. 1990;136:1235.
- Vasquez R, Marien BJ, Gram C, et al. Proliferative capacity of venous ulcer wound fibroblasts in the presence of platelet-derived growth factor. Vasc Endovascular Surg. 2004;38:355–360.
- Eatemadi A, Daraee H, Zarghami N, et al. Nanofiber: synthesis and biomedical applications. Artif Cells Nanomed Biotechnol. 2016;44:111–121.
- Safaeijavan R, Soleimani M, Divsalar A, et al. Biological behavior study of gelatin coated PCL nanofiberous electrospun scaffolds using fibroblasts. J Paramed Sci. 2013;5:67–73.
- Ghiaee A, Farahmand M, Ardeshirylajimi A. Incorporated dexamethasone influence in the PEO nanofibers on the proliferation of mesenchymal stem cells. J Paramed Sci. 2016;7:39–44.
- Jafari-Aghdam N, Adibkia K, Payab S, et al. Methylprednisolone acetate–Eudragit® RS100 electrospuns: preparation and physicochemical characterization. Artif Cells Nanomed Biotechnol. 2016;44:497–503.
- Pournaqi F, Ghiaee A, Vakilian S, et al. Improved proliferation and osteogenic differentiation of mesenchymal stem cells on polyaniline composited by polyethersulfone nanofibers. Biologicals. 2017;45:78–84.
- Jin Q, Wei G, Lin Z, et al. Nanofibrous scaffolds incorporating PDGF-BB microspheres induce chemokine expression and tissue neogenesis in vivo. PLoS One. 2008;3:e1729.
- Zhao X, Hadjiargyrou M. Induction of cell migration in vitro by an electrospun PDGF-BB/PLGA/PEG-PLA nanofibrous scaffold. J Biomed Nanotechnol. 2011;7:823–829.
- Karahaliloglu Z, Kilicay E, Denkbas EB. Antibacterial chitosan/silk sericin 3D porous scaffolds as a wound dressing material. Artif Cells Nanomed Biotechnol. 2017;45:1172–1185.
- Wang Y, Qiao W, Yin T. A novel controlled release drug delivery system for multiple drugs based on electrospun nanofibers containing nanoparticles. J Pharmaceut Sci. 2010;99:4805–4811.
- Vakilian S, Mashayekhan S, Shabani I, et al. Structural stability and sustained release of protein from a multilayer nanofiber/nanoparticle composite. Int J Biol Macromol. 2015;75:248–257.
- Brenan Mt, Parish C. Intracellular fluorescent labelling of cells for analysis of lymphocyte migration. J Immunol Meth. 1984;74:31–38.
- Parish CR. Fluorescent dyes for lymphocyte migration and proliferation studies. Immunol Cell Biol. 1999;77:499–508.
- Ghiaee A, Pournaqi F, Vakilian S, et al. Adapted dexamethasone delivery polyethylene oxide and poly (ɛ-caprolactone) construct promote mesenchymal stem cells chondrogenesis. Artif Cells Nanomed Biotechnol. 2017;45:1640–1648.
- Nelson RD, Quie PG, Simmons RL. Chemotaxis under agarose: a new and simple method for measuring chemotaxis and spontaneous migration of human polymorphonuclear leukocytes and monocytes. J Immunol. 1975;115:1650–1656.
- Frazier K, Williams S, Kothapalli D, et al. Stimulation of fibroblast cell growth, matrix production, and granulation tissue formation by connective tissue growth factor. J Invest Dermatol. 1996;107:404–411.
- Moghadasi Boroujeni S, Mashayekhan S, Vakilian S, et al. The synergistic effect of surface topography and sustained release of TGF-β1 on myogenic differentiation of human mesenchymal stem cells. J Biomed Mater Res A. 2016;104:1610–1621.
- Tanha S, Rafiee‐Tehrani M, Abdollahi M, et al. G‐CSF loaded nanofiber/nanoparticle composite coated with collagen promotes wound healing in vivo. J Biomed Mater Res A. 2017;105:2830–2842.
- Bashur CA, Dahlgren LA, Goldstein AS. Effect of fiber diameter and orientation on fibroblast morphology and proliferation on electrospun poly (D,L-lactic-co-glycolic acid) meshes. Biomaterials. 2006;27:5681–5688.
- Liu Y, Franco A, Huang L, et al. Control of cell migration in two and three dimensions using substrate morphology. Experiment Cell Res. 2009;315:2544–2557.
- Jouybar A, Seyedjafari E, Ardeshirylajimi A, et al. Enhanced skin regeneration by herbal extract‐coated poly‐L‐lactic acid nanofibrous scaffold. Artif Organs. 2017;41:E296–E307.
- Rauhala HE, Teppo S, Niemelä S, et al. Silencing of the ARP2/3 complex disturbs pancreatic cancer cell migration. Anticancer Res. 2013;33:45–52.
- Heit B, Tavener S, Raharjo E, et al. An intracellular signaling hierarchy determines direction of migration in opposing chemotactic gradients. J Cell Biol. 2002;159:91–102.
- Foxman EF, Kunkel EJ, Butcher EC. Integrating conflicting chemotactic signals. J Cell Biol. 1999;147:577–588.