
 ?Mathematical formulae have been encoded as MathML and are displayed in this HTML version using MathJax in order to improve their display. Uncheck the box to turn MathJax off. This feature requires Javascript. Click on a formula to zoom.
Abstract
With the aim of dedicating toxicity of cadmium nanoparticles (CdNPs) against invasive breast cancer, with minimum damage to surrounding healthy cells, CdNPs were coated with albumin nanocarrier by nanoprecipitation method and named CdNPs@BSA. The characterization was done by TEM image, DLS and UV–Vis, fluorescence, circular dichroism spectroscopy. The cytotoxic efficacy of the CdNPs@BSA against human breast cancer cells (MDA-MB 231 cells) was examined by MTT assay. Apoptosis, as the mechanism of cell death, was verified by inverted microscopy, fluorescent microscopy, gel electrophoresis and flow cytometry. The role of ROS generation in apoptosis was also studied. It was found that the resulted CdNPs@BSA (diameter of 88 nm and zeta potential of about −18.85 mV) was suitable for penetration in tumour micro vessels. In the form of CdNPs@BSA, the 77% of the secondary structure and almost all of the tertiary structure remain intact. Comparing to CdNPs, CdNPs@BSA could significantly suppress the MDA-MB 231 while they were less toxic on WBCs. Therefore, they could be a brilliant candidate to be used as a chemotherapeutic agent against invasive breast cancer cells.
Introduction
Breast cancer is the second leading cause of death from cancer in women [Citation1]. Clinically, treatment of advanced breast cancer faces the serious challenges such as dormant micrometastases, resistance to all systemic therapies, triple-negative breast cancer, genomic chaos and transformed ER- and HER2-positive breast cancer. Furthermore, in most cases, patients initially respond to chemotherapy but later develop resistance [Citation2]. Currently, available anticancer drugs are expensive and also exert several side effects such as myelosuppression, anemia and generation of cellular resistance [Citation3,Citation4]. As such, developing a biocompatible and economic method for cancer treatment is important. Among the therapeutic approaches, metallic nanoparticles including silver, cadmium and copper have recently gained attention but shown toxic effects in vitro [Citation5]. In this regard, cadmium nanoparticles (CdNPs) has been shown to induction of apoptosis in cancer cells by inhibiting DNA repair and causing free radical-induced DNA damage, mitochondrial damage and disruption of intracellular calcium signaling [Citation6,Citation7].
Nowadays, for targeting particles to the intended tissue, drugs can be incorporated into suitable carriers. The main advantages of such carriers are high uptake rate against target cells than normal cells, low cytotoxicity, availability and affordability [Citation8]. One of the carriers that fulfill these requirements is albumin, the most abundant protein in plasma, which its potential for drugs delivery into cancer cells has been demonstrated by a number of studies [Citation9–14]. Cancer cells use a large quantity of albumin as a source of nitrogen and energy [Citation15]. Albumin can also be accumulating in tumors due to their distorted physiology and metabolism [Citation12,Citation16–19]. Moreover, the lack of a functional lymphatic system results in the accumulation of albumin in the tumor tissue [Citation20]. Albumin nanoparticles with the size of larger than 30 kDa, can be shown preferentially distribution in the tumor interstitium and remain there for prolonged periods of time (up to 144 h) [Citation21]. In addition, the successful endocytic cellular uptake along with successful tumor retention of albumin nanoparticles leads to a successful passive targeting of drugs to tumors with this delivery system [Citation22]. As a result, albumin coupled drugs can liberate within the tumor cells more efficiently than normal cells [Citation16].
Herein, we developed a novel nanocomposite in which CdNPs covered by albumin as a nanocarrier (CdNPs@BSA). In this nanocomposite, CdNPs are confined within non-toxic BSA nanospheres, demonstrating efficient apoptosis in human MDA-MB 231 breast cancer cells. To appreciate the multiplex origin of apoptosis, the effect of CdNPs@BSA on the cellular oxidative stress is also investigated.
Materials and methods
Synthesis of nanoparticles (CdNPs, CdNPs@BSA and NAs)
The CdNPs were synthesized by using chemical reduction method [Citation23]. 50 ml of 1 mM Cd(NO3)2 (Merck) was heated to boil. To this solution, 5 ml of 1% Tri-sodium 2-hydroxypropane-1,2,3-tricarboxylate (Merck) was added drop-wise. The appearance of yellowish color in the reaction vial and lowering the pH from 7 to 5, suggested the formation of CdNPs. The reaction could be described as EquationEquation (1)(1)
(1) :
(1)
(1)
In order to synthesize CdNPs@BSA and NAs, two solutions (A and B) were prepared separately. The solution A was obtained by dissolving 20 μl absolute ethanol in 230 μl dichloromethane. This organic media was capable of suspending or dissolving the bovine serum albumin (BSA; fraction V, minimum 98%; Sigma) but does not chemically react with either the polymer employed to produce the shell (BSA), or CdNPs itself. This combination of organic media includes dichloromethane as a volatile liquid helps to drive the solubility of BSA and CdNPs into the organic medium. And the solution B was prepared by dissolving BSA and CdNPs in 1000 μl of PBS/dichloromethane (99/1, v/v). The final concentration of BSA and CdNPs was 5% and 1 mM, respectively.
The blank nanoparticle of albumin, which was exactly the same as CdNPs@BSA, except that it was free from CdNPs, was synthesized and named NAs. For synthesizing NAs, a solution, the same as B but without CdNPs, was added to solution A while the mixture was agitating gently for 5 min. After formation of a crude emulsion it was transferred into a high-pressure homogenizer (Bandelin Sonopuls ultrasonic homogenizer, Germany). The emulsification was performed at 20 kHz at room temperature till a milky suspension was obtained. The resultant was transferred into a rotary evaporator and dichloromethane was rapidly removed at 40 °C and at reduced pressure of 30 mm Hg, for 20–30 min [Citation24] and lyophilized.
Characterization of CdNPs@BSA
Dynamic light scattering measurements
Dynamic light scattering (DLS; the ALV/CGS-8 F platform based goniometer systems) was used to estimate apparent hydrodynamic radius Rh of nanoparticles based on first-order electric field correlation functions versus time at eight scattering angles in the range from 22 to 141 degree. By assuming the spherical shape of the CdNPs@BSA, the apparent hydrodynamic radius Rh can be calculated through the Stokes–Einstein relationship from the relaxation time (EquationEquation (2))(2)
(2) , when the relaxation mode is diffusive.
(2)
(2)
where kB is the Boltzmann constant, T is the absolute temperature, η is the viscosity of the medium and D = 1/τf q2, is the mutual diffusion coefficient
Spectroscopy
The 40 mM (in PBS, pH 7.4) samples was used. The zeta potential was determined using a Zetaplus zeta potential analyzer (Brookhaven Instruments) at room temperature [Citation25]. The circular dichroism (CD) spectroscopy was done with the Aviv spectropolarimeter, model 215 (Lakewood, NJ). Intrinsic fluorescence spectra of BSA were measured at 25 °C using a Varian Cary Eclipse fluorescence spectrophotometer [Citation25,Citation26].
Cell culture
The MDA-MB 231 human breast cancer cell line was supplied from the National Cell Bank of Iran (Pasteur Institute of Iran, Tehran, Iran). They were cultured in Dulbecco's modified eagle's medium (DMEM; Gibco) supplemented with 10% fetal bovine serum (FBS; Gibco), penicillin and streptomycin (both from Sigma) in a 5% carbon dioxide (CO2) cell incubator at 37 °C to reach 70–80% confluence [Citation25]. Human white blood cells (WBCs) were extracted from a blood sample of a healthy donor by RBC lysis buffer. WBCs were then washed with FBS-free DMEM and adjusted to 1 × 10⁴ cells/well for analysis [Citation27,Citation28].
Cytotoxicity assay
3–(4,5-dimethyl-thiazol-2-yl)-2,5-diphenyl tetrazolium bromide (MTT; Sigma) was used to assay cytotoxicity effects. 1 × 10⁴ cells (MDA-MB 231, MCF10-A and WBC) were seeded in a 100 μl growth medium in 96-well plate. MDA-MB 231 cells were treated by increasing concentrations of either CdNPs or CdNPs@BSA (0, 0.1, 0.5, 1, 5, 10, 50 and 100 μM). MCF10-A and WBCs were also treated by either CdNPs or CdNPs@BSA at the concentrations of 0, 1, 5, 10, 50, 100 and 200 μM. Subsequent incubation of treated cells was performed at 37 °C in 5% CO2 for 24 h. The blank related to each nanoparticle concentration were made by incubation of MTT and nanoparticle in DMEM without cells. The concentration of drug (CdNPs or CdNPs@BSA) that causes 50% cell death (LD50) in comparing to the untreated cells was calculated [Citation25,Citation29].
Assaying cell death mechanism in MDA-MB 231
MDA-MB 231 cells were treated with the LD50 concentration of CdNPs and CdNPs@BSA. They were incubated at 37 °C in 5% CO2 for 24 h. (1) The treated cells were observed directly by an inverted microscope (Zeiss, Germany) to study cellular morphological changes [Citation30]. (2) The acridine orange/ethidium bromide double staining was used as a primary test in order to distinguish cells undergoing apoptosis from the viable cells [Citation31,Citation32]. (3) DNA extraction was done using the salting-out method. Extracted DNA was run on a 2% agarose gel for 20 min by applying 100 V, which was then stained with ethidium bromide. The bands were detected using an ultraviolet transilluminator [Citation33]. (4) Flow cytometry based on PE Annexin-V/7-AAD was done to quantify percent of cell apoptosis. Flow cytometric data analyses were performed using the Flowjo version 7.6.1 software [Citation25]. (5) In vitro cellular uptake of CdNPs@BSA was studied by TEM (Philips transmission electron microscope CM100 (Philips, Eindhoven, Netherlands) [Citation34]. (6) cell cycle determination was done by Flow cytometry based on propidium iodide (PI) staining of DNA [Citation35]. 7- The net intracellular levels of ROS generated by synthesized compounds were measured by a non-fluorescence dye, 2′,7′-dichlorofluorescein diacetate (DCFH-DA; Merck) which interacts with intracellular ROS, to generate fluorescent 2,7-dichlorofluorescein (DCF) [Citation36]. The fluorescent intensity was recorded by fluorescence spectrophotometer (Varian Cary Eclipse fluorescence spectrophotometer).
Results and discussion
Characterization of CdNPs and CdNPs@BSA
Transmission electron microscopic images (TEM; JEOL JEM 1400Plus equipped with Ruby camera at 120 kV) of nanoparticles (, left) revealed CdNPs were formed uniformly with very small size around 5 nm and near spherical shape. (right) shows TEM image of CdNPs@BSA with an approximate diameter of 100 nm, that shows CdNPs embedded in BSA nanocarrier. Statistically, analyses of TEM images showed that p values was less than 0.03 with a standard deviation of 0.005. Based on , the size of CdNPs@BSA and NAs were 90 and 43 nm, respectively. Since the structure of BSA in CdNPs@BSA is not crystalline; therefore, these nanoparticles are not rigid and have no well-defined border. It seems that the BSA molecules coat around CdNPs are transparent, therefore they observed as gray dots; while, CdNPs inside the nanoparticles are observed as black dots since they are metallic and condense. The drying process for TEM sample preparation may also induce aggregation and cluster formation in CdNPs, and irregular shapes formation in CdNPs@BSA. Schematic model of CdNPs@BSA is represented in .
Figure 1. (A) TEM image of CdNPs (right) and negatively stained CdNPs@BSA (left). (B) Schematic representation for synthesis of CdNPs@BSA. (C) Particle-size distribution histogram of CdNPs, mean diameter = 2 nm (P.D.I = 0.44) and (D) Schematic representation for synthesis of CdNPs@BSA. (E) Particle-size distribution histogram of free BSA, mean diameter = 7.5 nm (P.D.I = 0.38).
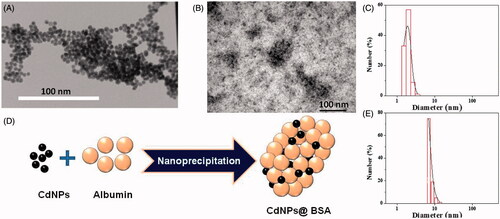
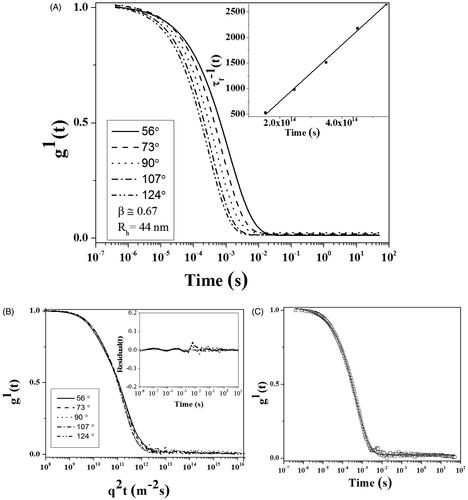
The size of CdNPs@BSA was studied by DLS. The decay of the correlation functions was fitted by a single stretched exponential function. The normalized correlation functions are represented in . As a general theorem, the decay of the correlation functions for larger particles takes longer time than that of small particles. In this case, only one relaxation mode was observed for the CdNPs@BSA. The short time decay behavior (fast relaxation time) is frequently q2 dependence and related to the mutual diffusion coefficient, D. This means that the system is diffusive (D = 1/τf q2). The slope of inset plot (τf-1 versus q2) in as apparent diffusion coefficient (D) was used in Stokes–Einstein relation for calculating the hydrodynamic radii (Rh). In , the curves g1(t) versus q2t are plotted at different angels for CdNPs@BSA. The curves collapse onto each other and show the diffusive character of the system. The value of β is around 0.67 (less than 0.8) indicating that there is a spectrum of size distribution in CdNPs@BSA (PDI = 0.5). The inset plot represented the unsystematic distribution and small values of the residuals. Moreover, in , the decays of the correlation functions for the angle 90° is shown together with its single stretched exponential fit, indicating that the quality of the fitting was fine. One albumin molecule has an effective diameter of 7.5 nm [Citation37] and CdNPs () were around 2 nm; therefore, every CdNPs@BSA with diameter around 88 nm contains several CdNPs, which are embedded in every cluster of BSA.
Figure 2. DLS plot of CdNPs@BSA, (A) First-order electric field correlation functions versus time at the indicated scattering angles. Inset plot: τ−1 as a function of q2. (B) First-order electric field correlation functions versus q2t at the indicated scattering angles. The inset plot shows random distribution and small values of the residuals. (C) First-order electric field correlation functions and their corresponding fits at 90°.
Surface opsonization and subsequent entrapment by the mononuclear phagocytic system and reticuloendothelial system (RES) together with rapid renal clearance are common barriers for CdNPs (size <10 nm diameter) delivery to cancer cells and solid tumors [Citation38]. The pore size of tumor microvessels varies from 100 to 1200 nm in diameter, so particles smaller than 100 to 1200 nm have the potential of leaving the tumor microvessels through EPR effect [Citation39,Citation40]. Therefore, 88 nm CdNPs@BSA are small enough for extravasation into tumor tissue but not into normal tissue, and big enough for evading from opsonization.
After synthesizing CdNPs@BSA, the yield percent of the synthesized CdNPs@BSA (y) was calculated using EquationEquation (3)(3)
(3) , to be 84%.
(3)
(3)
Zeta potential
The zeta potential as a significant indicator of the synthesized nanoparticles stability was measured. The magnitude of the zeta potential indicates the degree of electrostatic repulsion between adjacent with similarly charged particles in the dispersion. For molecules and particles that are small enough, a high zeta potential will confer stability, i.e., the solution or dispersion will resist aggregation [Citation41]. CdNPs possessed the negative zeta potential of −19 mV, which is probably due to citrate anions at their surface that prevent them from aggregation. Moreover, encapsulation within BSA nanocarriers still keeps the negative charges that are probably due to BSA anions (BSA itself has the negative charge of −5 mV). CdNPs@BSA with −18.85 ± 0.65 mV appears to have incipient stability. Incipient stability is for the particle with ±10 to ±30 mV [Citation32,Citation42].
UV–vis spectroscopy
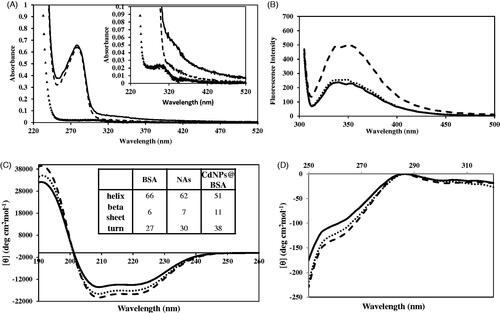
Conformational changes of BSA in two different states of CdNPs@BSA and native form were compared by UV–Vis spectroscopy. As seen in , the absorption spectrum of native BSA consists of two electronic bands, at 280 (due to the phenyl group of tryptophan and tyrosine residues) [Citation43] and 210 (characteristic peak for polypeptide chains) [Citation44,Citation45]. The absorption peak position and shape for CdNPs@BSA ( solid line) were very similar to that of native BSA in solution ( dashed line), suggesting that the native structure of BSA was preserved while they were transformed to nanoparticle under the high-pressure homogenizer. The suspension of CdNPs in PBS (1 mM) illustrated a λmax at 300 nm (, inset), which originates from surface plasmon resonance. Comparison between the absorption spectra of naked CdNPs and encapsulated CdNPs revealed that surface plasmon resonance of CdNPs is conceivably reduced as a result of: 1) Increasing the size of CdNPs by embedding them in BSA cluster. 2) CdNPs at naked form are surrounded by citrate ions while in CdNPs@BSA form are surrounded by protein; therefore, this change in microenvironment alters the dielectric constant which reduces the surface plasmon of CdNPs [Citation46]. 3) Enlargement of the average refractive index in CdNPs environment [Citation46]. 4) Increasing the molecule compactness on CdNPs.
Figure 3. (A) UV–Vis spectra of CdNPs (▲▲▲▲), CdNPs@BSA (______) and BSA (- - -). (B) Emission fluorescence spectra of CdNPs@BSA (______), NAs (….), BSA (- - -). Far CD-UV (C) and near CD-UV (D) spectra of CdNPs@BSA (______), NAs (….) and BSA (- - -). Insert table: Secondary structural changes of BSA, NAs and CdNPs@BSA.
Fluorescence studies
Fluorescence spectrum resulted by excitation at 295 nm is informative for the molecular environment in a vicinity of the tryptophan residue [Citation47]. shows the emission spectra of BSA, CdNPs@BSA and NAs upon excitation at 295 nm. The overall shape of the emission spectra showed minor differences between them in which the intensity of CdNPs@BSA and NAs is lower than BSA which probably indicates a small unfolding in surrounding tryptophan residues of BSA.
Circular dichroism spectroscopy
Evaluation of the extent of the conformational changes of BSA during the nanoparticle synthesize procedure was done by CD spectroscopy. The far-UV CD (190–260 nm) was used for determination of secondary structural changes in the protein. The results are reported in units of molar ellipticity. As shown in , the native BSA, CdNPs@BSA and NAs all exhibited the overall spectrum of α-helix structure in protein [Citation48], emphasizing that CdNPs@BSA and NAs are almost similar to native state. Such a descriptive interpretation was verified by spectral deconvolution using CDNN program version 2. The results were found to be consistent with 3% rise in β-strand and 9.7% reduction in α-helix when the protein is incorporated into nanoparticle assemblies ( Inset table). Comparison between the percentage of α-helix, as the stability structural component, in native BSA, CdNPs@BSA and NAs shows 23% and 6% instability in CdNPs@BSA and NAs, respectively. Therefore, BSA structure will be intact up to 77% during the process for CdNPs@BSA.
In addition, tertiary structure changes were evaluated in the near-UV CD (250–320 nm). represents the typical CD spectrum of BSA [Citation49]. As seen in , this spectrum is found to be almost conserved in CdNPs@BSA and NAs, too. There is a protrusion in 255–265 nm of CD spectrum which is the fingerprint of BSA tertiary structure. As seen, this fingerprint is visible in all cases of native BSA, CdNPs@BSA and NAs, suggesting no drastic change in the tertiary interactions surrounding tyrosine and tryptophan residues. On the other hand, molar ellipticity magnitude of CdNPs@BSA and NA encountered slight increase during the high-pressure homogenization which indicates a small unfolding occurred in BSA tertiary structure.
Cytotoxicity assay
As observed in ), both CdNPs and CdNPs@BSA induced a dose-dependent cytotoxic effect on MDA-MB 231 and MCF-10 A breast cancer cell lines and WBCs. LD50 of CdNPs and CdNPs@BSA against MDA-MB 231 were 5 and 1 µM, and it was 8 and 57 µM against WBC, respectively. This means that the toxicity of CdNPs@BSA against cancer cells was 57 times higher than that of normal cells (p values = .003).
Figure 4. Cell viability of (A) MDA-MB 231, (B) WBC, (C) MCF-10A treated with CdNPs ▪ and CdNPs@BSA □. (D) Comparing cell viability of different kinds of cells treated with CdNPs and CdNPs@BSA.
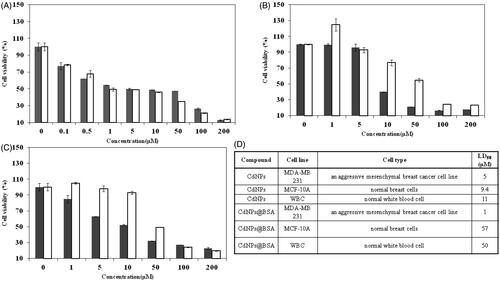
It may sound like that 1 µM CdNPs@BSA is a high concentration to be applicable for in vivo studies; but it should be considering that this concentration is less than toxic concentration of CdNPs (5 µM). On the other hand, this concentration is much less than toxic concentration of CdNPs@BSA against normal cells (57 µM). Therefore, this concentration is less enough to be safe for injections for in vivo test. Also this concentration is much less than IC50 of albumin coated copper nanoparticle against MDA-MB 231 (70 µM) [Citation19] and albumin coated silver nanoparticles against MDA-MB 231 (5 µM) [Citation14] which have had successfully in vivo tests.
Based on the calculation of data in , LD50 of CdNPs against cancer and normal cells is 5 ( dotted line) and 9.4 µM ( dashed line), respectively. Therefore, the main limitation of CdNPs to use in cancer therapy is its severe toxicity against normal cells. But, through replacement of CdNPs by CdNPs@BSA, the toxicity against cancer cells raises (p values = .1) with lowering the LD50 from 5 ( dotted line) to 1 µM ( solid line); however, the LD50 against normal cells increases (p values = .009) from 9.4 ( dashed line) to 57 µM ( dotted-dashed line). In fact, the presence of BSA as a carrier of CdNPs makes such a big difference between toxicity effect in cancer and normal cells due to enhancing the uptake of CdNPs via albumin specific receptors (albondin) into endothelial cancer cells [Citation50]. Also, due to the higher rate of metabolism in cancer cells, the albumin uptake is also increased [Citation13]. As such, the albumin-carried CdNPs appear to be absorbed by cancer cells more than normal cells. It seems CdNPs@BSA make the specific targeting of CdNPs to tumor cells possible which lead to less toxic effects on non-cancerous cells. On the other hand, the proposed dose of CdNPs@BSA (1 µM) were not toxic for normal cells.
To confirm CdNPs@BSA safety to normal cells, the cytotoxicity assay was done against human normal MCF-10 A breast cells. It was showed that CdNPs@BSA did not show remarkable effect towards human normal MCF-10 A breast cells (LD50 = 50 µM)
Apoptosis induction
To point out whether the mechanism of cell death is by apoptosis or not, MDA-MB 231cells were treated with the LD50 concentration of CdNPs and CdNPs@BSA. After 24 h treatment, the cells were studied by 1) inverted confocal microscopic images of cells, 2) acridine orange/ethidium bromide staining methods and 3) DNA fragmentation assay. Inverted microscopic images () showed a morphological alteration between treated MDA-MB 231cells by CdNPs or CdNPs@BSA and untreated cells. Variations such as inhibition of cell growth, cytoplasmic condensation, creating curved forms, loss of membrane integrity, and apoptosis bodies were observed in the treated cells. These observations indicated that CdNPs and CdNPs@BSA induce cell death whereas the non-treated cells remained active.
Figure 5. (UP) Inverted microscopic images of MDA-MB-231 Cells. (A) control, (B) and (C) treated with LD50 concentrations of CdNPs and CdNPs@BSA for 24 h, respectively. Middle) Fluorescent microscopy of cells stained with acridine orange/ethidium bromide. (D) control, (E) and (F) treated with CdNPs and CdNPs@BSA, respectively. (Down) DNA ladder on agarose gel electrophoresis. MDA-MB-231 Cells were treated with LD50 concentrations of CdNPs and CdNPs@BSA for 24 h and DNA fragmentation was analyzed. Lane M: 1 kB ladder, lane 1: control, lane 2: CdNPs, lane 3: CdNPs@BSA.
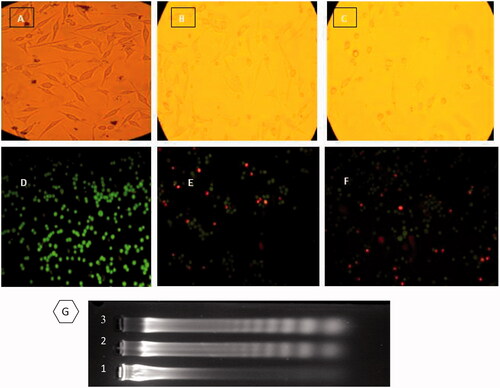
In ), the acridine orange/ethidium bromide stained treated cells were compared with the control cells under a fluorescence microscope. The orange spots are related to nuclei of apoptotic cells () whereas the viable cells were seen as green spots. The cells treated with CdNPs@BSA and CdNPs showed the extended apoptosis compared with the control cells.
The last verification step of apoptosis induction was the observation of DNA ladder fragmentation pattern with the products of endonuclease cleavage in apoptosis in the electrophoresis gel [Citation51]. The DNA of MDA-MB-231 cells treated with LD50 concentrations of CdNPs and CdNPs@BSA was extracted and loaded on the 2% agarose gel. The results of DNA “laddering” pattern extracted from MDA-MB-231 cells treated with CdNPs@BSA and CdNPs were shown in .
To quantification of apoptosis data, we performed apoptosis analysis using flow cytometry after 12 and 24 h treatment by CdNPs and CdNPs@BSA. shows that CdNPs@BSA induced apoptosis in MDA-MB 231 cells as well as CdNPs, after 24 h treatment by LD50 values. Besides, as shown in , cell viability after treatment with both CdNPs and CdNPs@BSA decreased with time increasing during 24 h. These data clearly confirm that CdNPs@BSA has a time-dependent manner to apoptosis induction similar to CdNPs.
Figure 6. (A–C) Two-dimensional contour density plots of MDA-MB-231 cells obtained by flow cytometry based assays. A: Control, B-C: Treated cells with CdNPs and CdNPs@BSA, respectively. Cell necrosis and apoptosis were measured by using 7-AAD and Annexin-V dyes. (D–F) Flow cytometry based assay of cell cycle. D: Control, E–F: Treated cells with CdNPs and CdNPs@BSA, respectively.
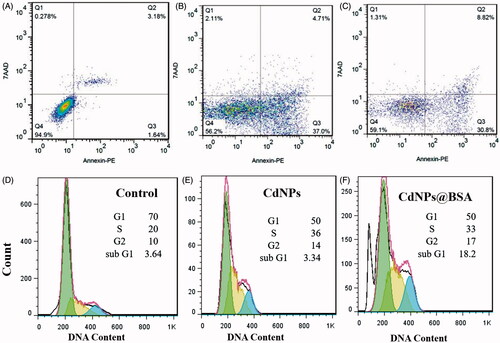
Table 1. Quantified flow cytometry analysis of PE annexin V and 7-AAD stained MDA-MB-231 cells after 24 h treatment with CdNPs and CdNPs@BSA.
The data obtained by these three techniques verify that the mechanism of cell death after treatment by CdNPs@BSA and CdNPs is apoptosis.
Effect of CdNPs@BSA on cell cycle
The cell cycle analysis study indicated that CdNPs@BSA the same as CdNPs drastically alter MDA-MB 231 cell cycle distributions (). The CdNPs and CdNPs@BSA treatment result in 50% of the MDA-MB 231 cells were in G1 phase, 36–37% were in S phase, and 13–14% were in G2 phase compared to the untreated control cells consisting of 70% of the cells in G1 phase, 20% in S phase, and 10% in G2 phase.
) illustrated that the proportions of S-phase cells, and thereby S-phase arrest, were clearly higher in the both CdNPs and CdNPs@BSA-treated cells compared with the untreated cells. The defect of cell cycle checkpoints can direct to growth abnormality or apoptosis. The G1/S checkpoint is the most critical for control of cell proliferation via intracellular and extracellular signals related to transportation and integration of molecules into the nucleus [Citation52]. Furthermore, Zhang et al. has shown that DNA damage can induce S phase arrest in human breast cancer cell line [Citation53]. Therefore, it can be concluded that S-phase arrest followed by cadmium nanoparticle treatment could be due to their penetration into nucleus and DNA damage. Especially our previous data based on visualization of DNA ladder on electrophoresis gel also verified that both type of cadmium nanoparticle result to DNA fragmentation. Data of this project showed that there were not significantly different between CdNPs and CdNPs@BSA in the alternation of cell cycle distributions. This phenomenon is probably due to the mechanism of CdNPs and CdNPs@BSA inside the cells was similar.
Flow cytometry based apoptosis on normal cell
Flow cytometry as a quantitative data was done to prove that CdNPs@BSA is taken up specifically by cancer cells than normal cells (). shows that CdNPs@BSA negligibly increased apoptosis in WBCs cells, after 24 h treatment by 1 µM concentration of CdNPs@BSA.
Figure 7. Two-dimensional contour density plots of WBCs cells obtained by flow cytometry-based assays. (A) Control, (B) Treated cells with CdNPs@BSA. Cell necrosis and apoptosis were measured by using 7-AAD and Annexin-V dyes.
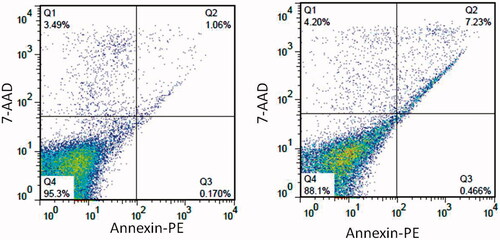
Table 2. Quantified flow cytometric analysis of PE annexin V and 7-AAD stained WBCs cells after 24 h treatment with CdNPs@BSA.
In vitro cellular uptake of CdNPs@BSA
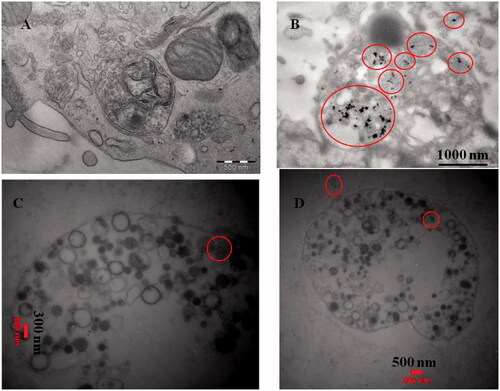
To confirm if the CdNPs@BSA were internalized into the cells or just bounded to the cell surface, the nanoparticle-treated cells were first immobilized by glutaraldehyde and osmium tetroxide, cross-sectioned and studied by TEM.
CdNPs@BSA were internalized and scattered throughout the cell especially inside lysosomes () as the endpoint of endocytosis probably via albumin receptor-mediated endocytic pathway. As lysosomes only play a minor role in apoptosis [Citation54], one may conclude that the CdNPs@BSA accumulation in the lysosomes could be due to the breakdown of BSA from CdNPs and release of CdNPs without albumin coat inside the cell as the condensed black spots. Furthermore, the amounts of nanoparticles inside normal cells (WBCs) are so less than cancer cells (MDA-MB 231) (). Although, lysosomes are the main organelles for cadmium entrance in both normal and cancer cells.
Figure 8. TEM images of internalization of CdNPs@BSA across the cell membrane, (A) lysosome of untreated cell, (B) nucleus of untreated cell, (C) lysosome of treated cells and (D) cytoplasm of treated cell.
Cellular reactive oxygen species
Oxidative stress has been revealed to play an important role in apoptosis induced by treatment with heavy metal nanoparticle [Citation55]. To know the influence of CdNPs@BSA in oxidative stress, ROS generation was measured using the H2DCF-DA assay by evaluation of intracellular peroxide-dependent oxidation of DCFHDA to form fluorescent DCF. Cells were also treated with a characteristic ROS-generating agent, H2O2 (1 mM), as a positive control. The ROS levels generated in response to CdNPs were significantly higher in CdNPs@BSA treated cells than the control cells (p values = .04) (). Taken together, all these results indicate that cell death is mediated by ROS production, which might alter the cellular redox status, and can be a potential reason for cell death.
Figure 9. ROS generation in MDA-MB-231 cells treated with CdNPs ▪ and CdNPs@BSA □. Relative fluorescence of DCF was measured by excitation at 485 and emission at 530 nm.
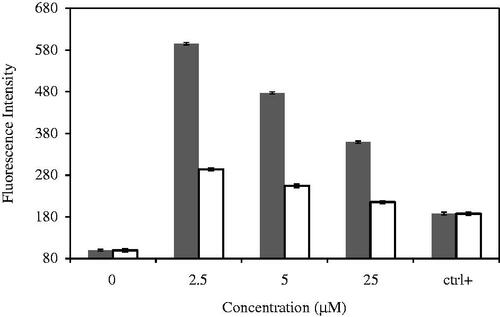
demonstrated that CdNPs@BSA similar to CdNPs could significantly decrease the production of ROS to a very low level in MDA-MB 231 cells and that the imbalance of ROS may promote mitochondrial dysfunction and trigger mitochondria-mediated apoptosis. The intracellular levels of ROS in cells treated with CdNPs@BSA and CdNPs decreased in a concentration-dependent manner compared with the levels in untreated cells. Therefore, CdNPs@BSA and CdNPs sharply reduced the production of ROS in MDA-MB 231 cells, which might have disrupted the balance of redox reactions. This disruption occurred in a concentration-dependent manner. CdNPs@BSA and CdNPs thus disturbed the cells' internal balance and induce tumor cell apoptosis. Also the bare CdNPs induce higher ROS generation than CdNPs@BSA (), which can be inspired that antioxidants effect of BSA could reduce this effect of cadmium nanoparticle.
Conclusion
In general, the experimental results obtained through this study clearly indicate that CdNPs@BSA can be considered as a potential chemotherapeutic agent for invasive breast cancer due to the following reasons: Firstly, CdNPs@BSA exhibited 57 times higher toxicity towards MDA-MB-231 cancer cells than normal cells, indicating more specificity of this nanocomposite to cancer cells. Secondly, the parameters such as (i) cytomorphological changes under an inverted phase-contrast microscopy, (ii) Permeability of treated cell toward acridine orange and ethidium bromide and (iii) creating ladder pattern in DNA gel electrophoresis, revealed that in the treatment of MDA-MB-231 by CdNPs@BSA the route of cell death is apoptosis. In addition, the assay of cellular oxidative stress revealed that the apoptotic pathway could be triggered by the ROS generation. Thirdly, CdNPs@BSA has an acceptable charge to be stable in physiological condition.
Acknowledgements
Material and spiritual supports provided by the Research Council of the University of Tehran are gratefully appreciated.
Disclosure statement
The authors report no conflicts of interest.
Related Research Data
References
- Ramkumar R, Balasubramani G, Raja RK, et al. Lantana camara Linn root extract-mediated gold nanoparticles and their in vitro antioxidant and cytotoxic potentials. Artif Cells Nanomed Biotechnol. 2017;45:748–757.
- Lupu R, Cardillo M, Cho C, et al. The significance of heregulin in breast cancer tumor progression and drug resistance. Breast Cancer Res Treat. 1996;38:57–66.
- Kim D-W, Hong G-H, Lee H-H, et al. Effect of colloidal silver against the cytotoxicity of hydrogen peroxide and naphthazarin on primary cultured cortical astrocytes. Int J Neurosci. 2007;117:387–400.
- Brown K. Breast cancer chemoprevention: risk-benefit effects of the antioestrogen tamoxifen. Expert Opin Drug Saf. 2002;1:253–267.
- Duffin R, Tran L, Brown D, et al. Proinflammogenic effects of low-toxicity and metal nanoparticles in vivo and in vitro: highlighting the role of particle surface area and surface reactivity. Inhal Toxicol. 2007;19:849–856.
- Nguyen KC, Willmore WG, Tayabali AF. Cadmium telluride quantum dots cause oxidative stress leading to extrinsic and intrinsic apoptosis in hepatocellular carcinoma HepG2 cells. Toxicology. 2013;306:114–123.
- Rzigalinski BA, Strobl JS. Cadmium-containing nanoparticles: perspectives on pharmacology and toxicology of quantum dots. Toxicol Appl Pharmacol. 2009;238:280–288.
- Singh M, Ferdous AJ, Branham M, et al. Trends in drug targeting for cancer treatment. Drug Deliv. 1996;3:289–304.
- Azizi M, Ghourchian H, Yazdian F, et al. Anticancer and antioxidant properties of Ag NPs coated with BSA NPs. Iran J Chem Eng. 2015;12:23.
- Das S, Banerjee R, Bellare J. Aspirin loaded albumin nanoparticles by coacervation: implications in drug delivery. Trends Biomater Artif Organs. 2005;18:203–212.
- Desai N. Challenges in development of nanoparticle-based therapeutics. Aaps J. 2012;14:282–295.
- Elzoghby AO, Samy WM, Elgindy NA. Albumin-based nanoparticles as potential controlled release drug delivery systems. J Control Release. 2012;157:168–182.
- Frei E. Albumin binding ligands and albumin conjugate uptake by cancer cells. Diabetol Metab Syndr. 2011;3:11.
- Azizi M, Ghourchian H, Yazdian F, et al. Anti-cancerous effect of albumin coated silver nanoparticles on MDA-MB 231 human breast cancer cell line. Sci Rep. 2017;7:5178.
- Babson AL, Winnick T. Protein transfer in tumor-bearing rats. Cancer Res. 1954;14:606–611.
- Stehle G, Sinn H, Wunder A, et al. Plasma protein (albumin) catabolism by the tumor itself—implications for tumor metabolism and the genesis of cachexia. Crit Rev Oncol Hematol. 1997;26:77–100.
- Zhang L, Hou S, Mao S, et al. Uptake of folate-conjugated albumin nanoparticles to the SKOV3 cells. Int J Pharm. 2004;287:155–162.
- Tijink BM, Laeremans T, Budde M, et al. Improved tumor targeting of anti-epidermal growth factor receptor nanobodies through albumin binding: taking advantage of modular nanobody technology. Mol Cancer Ther. 2008;7:2288–2297.
- Azizi M, Ghourchian H, Yazdian F, et al. Cytotoxic effect of albumin coated copper nanoparticle on human breast cancer cells of MDA-MB 231. PLoS One. 2017;12:e0188639.
- Hosseini M, Haji-Fatahaliha M, Jadidi-Niaragh F, et al. The use of nanoparticles as a promising therapeutic approach in cancer immunotherapy. Artif Cells Nanomed Biotechnol. 2016;44:1051–1061.
- Kobayashi H, Watanabe R, Choyke PL. Improving conventional enhanced permeability and retention (EPR) effects; what is the appropriate target? Theranostics. 2014;4:81–89.
- Mirtsching B, Cosgriff T, Harker G, et al. A phase II study of weekly nanoparticle albumin-bound paclitaxel with or without trastuzumab in metastatic breast cancer. Clin Breast Cancer. 2011;11:121–128.
- Rashid MU, Bhuiyan MKH, Quayum ME. Synthesis of silver nano particles (Ag-NPs) and their uses for quantitative analysis of vitamin C tablets. Dhaka Univ J Pharm Sci. 2013;12:29–33.
- Desai NP, Tao C, Yang A, et al. Protein stabilized pharmacologically active agents, methods for the preparation thereof and methods for the use thereof. Google Patents; 2004.
- Zeinabad HA, Zarrabian A, Saboury AA, et al. Interaction of single and multi wall carbon nanotubes with the biological systems: tau protein and PC12 cells as targets. Sci Rep. 2016;6:26508.
- Jafari AV, Kasravi S, Alizadeh ZH, et al. Probing the conformational changes and peroxidase-like activity of cytochrome c upon interaction with iron nanoparticles. J Biomol Struct Dyn. 2017;35:2565–2577.
- Bian Y, Rong Z, Chang TMS. Polyhemoglobin-superoxide dismutase-catalase-carbonic anhydrase: a novel biotechnology-based blood substitute that transports both oxygen and carbon dioxide and also acts as an antioxidant. Artif Cells Blood Subst Biotechnol. 2011;39:127–136.
- Wollocko H, Anvery S, Wollocko J, et al. Zero-link polymerized hemoglobin (OxyVita®Hb) stabilizes the heme environment: potential for lowering vascular oxidative stress. Artif Cells Nanomed Biotechnol. 2017;45:701–709.
- Fisher GA, Sikic BI. Clinical studies with modulators of multidrug resistance. Hematol Oncol Clin North Am. 1995;9:363–382.
- Jeyaraj M, Sathishkumar G, Sivanandhan G, et al. Biogenic silver nanoparticles for cancer treatment: an experimental report. Colloids Surf B Biointerfaces. 2013;106:86–92.
- Cohen JJ. Apoptosis. Immunol Today. 1993;14:126–130.
- Kheirollahi A, Pordeli M, Safavi M, et al. Cytotoxic and apoptotic effects of synthetic benzochromene derivatives on human cancer cell lines. Naunyn Schmiedebergs Arch Pharmacol. 2014;387:1199–1208.
- Kasibhatla S, Amarante-Mendes GP, Finucane D, et al. Analysis of DNA fragmentation using agarose gel electrophoresis. Cold Spring Harb Protoc. 2006;2006:pdb. prot4429.
- Momtazi L, Bagherifam S, Singh G, et al. Synthesis, characterization, and cellular uptake of magnetic nanocarriers for cancer drug delivery. J Colloid Interface Sci. 2014;433:76–85.
- Shapiro HM. Practical flow cytometry. Hoboken, NJ, USA: John Wiley & Sons; 2005.
- LeBel CP, Ischiropoulos H, Bondy SC. Evaluation of the probe 2', 7'-dichlorofluorescin as an indicator of reactive oxygen species formation and oxidative stress. Chem Res Toxicol. 1992;5:227–231.
- Kratz F. Albumin as a drug carrier: design of prodrugs, drug conjugates and nanoparticles. J Control Release. 2008;132:171–183.
- Wang J, Lu Z, Gao Y, et al. Improving delivery and efficacy of nanomedicines in solid tumors: role of tumor priming. Nanomedicine (London, England). 2011;6:1605–1620.
- Hobbs SK, Monsky WL, Yuan F, et al. Regulation of transport pathways in tumor vessels: role of tumor type and microenvironment. Proc Natl Acad Sci USA. 1998;95:4607–4612.
- Yuan F, Dellian M, Fukumura D, et al. Vascular permeability in a human tumor xenograft: molecular size dependence and cutoff size. Cancer Res. 1995;55:3752–3756.
- Hanaor D, Michelazzi M, Leonelli C, et al. The effects of carboxylic acids on the aqueous dispersion and electrophoretic deposition of ZrO2. J Eur Ceram Soc. 2012;32:235–244.
- O'Brien RW. Electroacoustic studies of moderately concentrated colloidal suspensions. Faraday Discuss Chem Soc. 1990;90:301–312.
- Zhao X, Liu R, Chi Z, et al. New insights into the behavior of bovine serum albumin adsorbed onto carbon nanotubes: comprehensive spectroscopic studies. J Phys Chem B. 2010;114:5625–5631.
- Kristinsson HG. Acid-induced unfolding of flounder hemoglobin: evidence for a molten globular state with enhanced pro-oxidative activity. J Agric Food Chem. 2002;50:7669–7676.
- Bahadır EB, Sezgintürk MK. A review on impedimetric biosensors. Artif Cells Nanomed Biotechnol. 2016;44:248–262.
- Willets KA, Van Duyne RP. Localized surface plasmon resonance spectroscopy and sensing. Annu Rev Phys Chem. 2007;58:267–297.
- Hospes M, Hendriks J, Hellingwerf KJ. Tryptophan fluorescence as a reporter for structural changes in photoactive yellow protein elicited by photo-activation. Photochem Photobiol Sci. 2013;12:479–488.
- Vigneshwaran N, Kathe AA, Varadarajan PV, et al. Silver-protein (core-shell) nanoparticle production using spent mushroom substrate. Langmuir. 2007;23:7113–7117.
- Pabbathi A, Patra S, Samanta A. Structural transformation of bovine serum albumin induced by dimethyl sulfoxide and probed by fluorescence correlation spectroscopy and additional methods. ChemPhysChem. 2013;14:2441–2449.
- Tiruppathi C, Song W, Bergenfeldt M, et al. Gp60 activation mediates albumin transcytosis in endothelial cells by tyrosine kinase-dependent pathway. J Biol Chem. 1997;272:25968–25975.
- Wyllie AH. Glucocorticoid-induced thymocyte apoptosis is associated with endogenous endonuclease activation; 1980.
- Zhu Q, Hu J, Meng H, et al. S-Phase cell cycle arrest, apoptosis, and molecular mechanisms of aplasia ras homolog member I–induced human ovarian cancer SKOV3 cell lines. Int J Gynecol Cancer. 2014;24:629–634.
- Zhang W-H, Poh A, Fanous AA, et al. DNA damage-induced S phase arrest in human breast cancer depends on Chk1, but G2 arrest can occur independently of Chk1, Chk2 or MAPKAPK2. Cell Cycle. 2008;7:1668–1677.
- Turk B, Turk V. Lysosomes as “suicide bags” in cell death: myth or reality? J Biol Chem. 2009;284:21783–21787.
- Morcillo P, Esteban MÁ, Cuesta A. Heavy metals produce toxicity, oxidative stress and apoptosis in the marine teleost fish SAF-1 cell line. Chemosphere. 2016;144:225–233.