
Abstract
Acquired resistance to 5-fluorouracil (5-FU) frequently occurs in patients with hepatocellular carcinoma (HCC), the underlying molecular mechanisms of which are poorly understood. The aim of this study was to identify candidate genes and associated signalling pathways that may play a role in developing drug resistance following repeated 5-FU treatments. In this work, we established 5-FU-resistant cells (HepG2/5-FU) using stepwise increasing concentrations of 5-FU in parental HepG2 cells. Using transcriptome sequencing, we found that the expressions of the Wnt signalling genes, including negative regulators (DKK1, DKK3, ZNRF3, RNF43 and APC2) and positive regulators (FZD10 and DVL1), were significantly downregulated and upregulated in HepG2/5-FU cells, respectively, resulting in increased Wnt signalling. Dishevelled-1 (DVL1) is an essential Wnt signalling pathway component that stabilizes β-catenin and mediates the Wnt pathway. Silencing DVL1 using siDVL1 or other small molecular inhibitors in HepG2/5-FU cells could restore 5-FU responsiveness via reduced cell proliferation and migration, and increased apoptosis. Moreover, DVL1 was found to be upregulated in BEL-7402/5-FU cells when compared to the parental BEL-7402 cells. Collectively, our results provide the first clue towards understanding the contribution of DVL1-mediated acquired resistance to 5-FU in HepG2/5-FU cells, suggesting a promising therapeutic strategy for liver cancer resistant to 5-FU.
Introduction
Chemotherapy is the most common treatment for late-stage tumours [Citation1–3] and is the most effective option for treating advanced cancers, including hepatocellular carcinoma (HCC). In contrast to radiation and surgical treatments, chemotherapy exhibits a therapeutic effect even if the cancer has metastasized [Citation4,Citation5].
Currently, there are over 100 drugs used for chemotherapeutic treatments, either as individual or combined agents. A first-line chemotherapeutic drug, 5-fluorouracil (5-FU), is used to treat a variety of cancers, including lung, breast, liver, colorectal and gastric cancer [Citation6–9]. It is the drug of choice for the chemotherapeutic treatment of HCC [Citation10]. It inhibits DNA synthesis and replication to induce apoptosis in cancer cells by inhibiting thymidylate synthase (TYMS) and incorporating its metabolites into the DNA and RNA [Citation11]. However, acquired resistance to 5-FU severely limits successful treatment outcomes in many human cancers, like HCC [Citation12]. Furthermore, the mechanism of 5-FU chemoresistance in HCC remains controversial.
It has been proposed that 5-FU sensitivity and resistance is controlled by four intracellular enzymes: TYMS, dihydropyrimidine dehydrogenase (DPYD), methylenetetrahydrofolate reductase (MTHFR) and thymidine phosphorylase (TYMP) [Citation13]. Most studies focused on examining the polymorphisms of these genes and their effects on drug metabolism. Furthermore, members of the ATP binding cassette (ABC) transporter superfamily are known to facilitate drug resistance via their role as efflux pumps. The ABC subfamily B member 1 (ABCB1) gene, which is also known as P-glycoprotein (P-gp) or multidrug resistance protein 1 (MDR1), is the most commonly investigated ABC transporter for drug resistance, but does not have a role in 5-FU resistance [Citation14]. Recent studies found that the activation of the Wnt signalling pathway in humans contributed to oncogenesis in the liver, ovary, colon, rectum, cervix and other tissues [Citation15–18]. Interestingly, it has been demonstrated that the Wnt signalling pathway has a key role in cancer drug resistance [Citation19], and that the inhibition of the regulator of the pathway, induced by exposure to 5-FU or cisplatin (DDP) alone, can significantly increase the extent of sensitivity in colon cancer and HCC cell lines [Citation20,Citation21]. Like Dishevelled 1 (DVL1), an important regulator of the Wnt signalling pathway, together with the Wnt co-receptor low-density lipoprotein (LDL) receptor-related protein 6 (LRP6), the FZD–DVL complex triggers the Wnt/β-catenin pathway by inhibiting the Axin-GSK3-APC-containing β-catenin destruction complex, thereby inhibiting the degradation of β-catenin; however, silencing it could sensitize paclitaxel-resistant human ovarian cancer cells [Citation22–24]. Unfortunately, it is largely unknown if DVL1 contributes to 5-FU resistance in liver cancer cells.
To systematically investigate the mechanism of acquired resistance to 5-FU in HCC, we used resistance cell models from two human hepatocellular liver carcinoma cell lines (HepG2 and BEL-7402) and transcriptome sequencing (RNA-Seq) to screen and identify the differences in gene expression between the 5-FU-sensitive cell line (HepG2) and the 5-FU-resistant cell line (HepG2/5-FU). We found that DVL1 and FZD10 (positive regulators of Wnt signalling) were upregulated and the negative regulators (DKK1, DKK3, ZNRF3, RNF43 and APC2) were downregulated in HepG2/5-FU, leading to increased Wnt signalling. And DVL1 was found to be upregulated in BEL-7402/5-FU cells when compared to the parental BEL-7402 cells. Moreover, DVL1 inhibition was also observed to restore responsiveness to 5-FU, which was demonstrated by the reduced cell proliferation and migration, and increased apoptosis in HepG2/5-FU cells. Thus, we suggest that our findings may provide novel biomarkers for the mechanism of cell resistance, and more importantly, lead to novel, alternative, and effective therapeutic strategies in overcoming acquired resistance to 5-FU in liver cancer.
Materials and methods
Cell culture and single-cell isolation
The human HCC cell lines HepG2, BEL-7402 and BEL-7402/5-FU were obtained from the Chinese Academy of Sciences Committee on Type Culture Collection Cell Bank (Shanghai, China) and iCell Bioscience (Shanghai, China). The cells were cultured in DMEM or RPMI-1640 (Gibco, Carlsbad, CA) supplemented with 10% FBS (Gibco, Carlsbad, CA), 100 U/mL of penicillin and 100 μg/mL of streptomycin (Gibco, Carlsbad, CA) at 37 °C in a humidified atmosphere containing 5% CO2. The 5-FU-resistant cell line (HepG2/5-FU) was established via culture in medium with stepwise increasing concentrations of 5-FU (Sigma-Aldrich, St. Louis, MO), and maintained in a medium containing 0.1 μg/mL of 5-FU. Next, HepG2 and HepG2/5-FU cells were seeded into 96-well plates at a density of 1 cell/well with 100 μL of culture medium containing a final 5-FU concentration of 0 μg/mL and 1 μg/mL, respectively.
Sixteen clones were established from the HepG2 cells and 20 clones were established from the HepG2/5-FU cells. We used a previously described method to establish these clones [Citation25]. The cells were screened using a cell viability assay to obtain the single cell-derived clones from the HepG2 and HepG2/5-FU cell lines.
Drug sensitivity assay
We used the Cell Counting Kit-8 (CCK-8; Dojindo, Kumamoto, Japan) to measure the effect of 5-FU on cell viability according to a previously described method [Citation24]. The cells in 100 μL of culture medium were seeded into 96-well plates (Thermo Fisher Scientific, Wilmington, DE). After 24 h of incubation, they were either transfected with siDVL1 or control siRNA (siNC), or treated with 120 μg/mL of the DVL inhibitor, 322338 (Merck, Darmstadt, Germany), or serum-free medium (blank) for 24 h, followed by treatments with a range of concentrations of 5-FU for an additional 72 h. The cells were then incubated with 10 μL of CCK-8 solution per well for 3 h. Optical density (OD) was measured at 450 nm using a microplate reader (Thermo Fisher Scientific, Wilmington, DE). The experiments were performed in duplicate on at least three independent occasions, and at least three replicates were used per treatment point.
Transcriptome sequencing and analysis
We used a total of 4 ng of RNA per sample as input materials for the RNA sample preparations. Sequencing libraries were generated using NEB NextUltra™ RNA Library Prep Kit for Illumina (New England BioLabs, Ipswich, MA) according to the manufacturer’s instructions. The library preparations were sequenced on an Illumina sequencing platform (HiSeq X Ten). The raw sequence data of the two samples were uploaded to the Sequence Read Archive (SRA) database of the National Center for Biotechnology Information (NCBI) (http://trace.ncbi.nlm.nih.gov/Traces/sra_sub/sub.cgi) with the accession numbers SRR4473672 for HepG2/5-FU single cells and SRR4473671 for HepG2 single cells. Differential expression analysis of the two samples was performed using DESeq2 R package v1.18.1 and gfold v1.1.4. To take false discovery rate (FDR) into account, the p values were adjusted using the Benjamini and Hochberg approach [Citation26]. Differential expression was determined based on fold-change (FC) and FDR with |log2(FC)|>1 and FDR <0.01.
Quantitative reverse transcription PCR (qRT-PCR)
To validate the RNA-Seq analysis results, we measured the mRNA expression levels of eight randomly selected differentially expressed genes (DEGs) using qRT-PCR. Total RNA from the two cell samples was extracted using TRIzol reagent (Invitrogen, Carlsbad, CA) and qRT-PCR was performed using SYBR® Premix Ex Tap™ II (TaKaRa, Shiga, Japan) according to the manufacturer’s instructions. We performed qRT-PCR using an ABI ViiA™ 7 Real-Time PCR system (Applied Biosystems, Foster City, CA) as follows: 42 °C for 5 min, 95 °C for 10 s, followed by 40 cycles of 95 °C for 5 s, and 58 °C for 34 s. Primers for qRT-PCR are listed in . GAPDH was used as an endogenous control gene. The fold change (2–ΔΔCt) with respect to expression for selected genes was determined in relation to GAPDH expression for each analysed sample.
Table 1. Primers used for quantitative reverse transcription-polymerase chain reaction (qRT-PCR).
siRNAs and transfection
DVL1 knockdown was performed using specific siRNAs purchased from GenePharma (Shanghai, China). The siRNA sequences are as follows: siDVL1-a, 5′-GUGCACGCCUACAAAUUCUTT-3′ and siDVL1-b, 5′-AGAAUUUGUAGGCGUGCACTT-3′. Scrambled siRNA sequences (5′-UUCUCCGAACGUGUCACGUTT-3′, 5′-ACGUGACACGUUCGGAGAATT-3′) were also used in parallel experiments as negative controls. Cells were seeded into 6- or 96-well plates such that they reached 40–50% confluency after 12 h. They were then transiently transfected with siDVL1 or siNC using Lipofectamine 2000 transfection reagent (Invitrogen, Carlsbad, CA) following the manufacturer’s instructions. After 24 h of transfection, the cells were collected and analysed using western blotting or CCK-8 assays.
Western blotting
Western blotting was carried out as described earlier [Citation27]. Whole-cell lysates were prepared using RIPA buffer supplemented with protease inhibitor cocktail (Sigma-Aldrich, St. Louis, MO). The protein concentration was determined using the BCA Protein Assay Kit (Thermo Fisher Scientific, Wilmington, DE). The primary antibodies used were against DVL1 (sc-8025, 1:200; Santa Cruz Biotechnology, Dallas, TX) and GAPDH (Ab8245, 1:1000; Abcam, Shanghai, China). The protein bands were visualized using a chemiluminescence reagent (ECL) kit (Thermo Fisher Scientific, Wilmington, DE). Immunoreactivity was detected, and the signals were analysed under non-saturating conditions using an image densitometer (Tanon, Shanghai, China) and the Image Lab software (Tanon, Shanghai, China). All immunoblot analyses were performed at least thrice.
Apoptosis assay
Cells were detached and labelled using an Annexin V-FITC/propidium iodide (PI) apoptosis detection kit (KeyGen Biotech, Jiangsu, China) according to the manufacturer’s instructions. Flow cytometric analysis was carried out as described earlier [Citation28]. Apoptotic and necrotic cells were quantified using a flow cytometer (BD FACSCalibur, San Jose, CA) and the CellQuest™ software. At least 10,000 cells were analysed for each sample. Cells that were Annexin V–/PI– were considered to be viable. Furthermore, cells that were Annexin V+/PI– were indicative of early apoptosis, whereas cells that were Annexin V+/PI + were considered to be in the late apoptotic and necrotic stages.
In vitro migration assay
Cells (5 × 10⁴) were treated with siDVL1 or the DVL inhibitor, 322338, and seeded into the upper chambers of the transwell reservoir (8-μm pore size; Corning® Costar®, Corning, NY) as previously described [Citation29]. DMEM medium supplemented with 10% FBS was added into the lower chamber as the chemo-attractant. After 24 h, the cells remaining on the upper membrane were removed with cotton wool, whereas the cells that migrated through the membrane were stained with 0.1% crystal violet, imaged, and counted. The cells in three random microscopic fields were counted and photographed using an inverted phase-contrast microscope.
Statistical analysis
All the data are presented as mean ± SD. Statistical significance was set at p < .05. The statistical differences were calculated using a two-tailed test. All the experiments were performed in triplicate on at least three separate occasions. All analyses were performed using GraphPad Prism Software Version 5.0 (GraphPad Software Inc., La Jolla, CA) and SPSS 16.0 (SPSS, Inc., Chicago, IL).
Results
HepG2-resistant cell line establishment and cell toxicity characterization
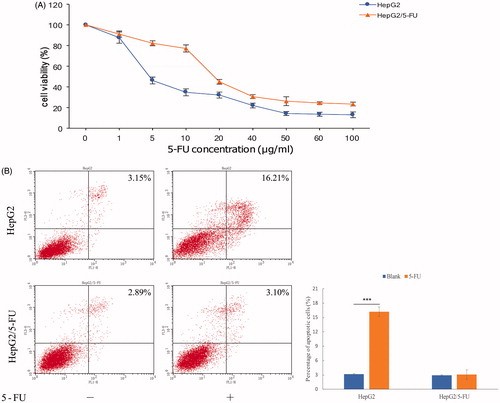
To investigate the molecular mechanism of 5-FU resistance, an in vitro cell model was established using stepwise increasing concentrations of 5-FU on HepG2 cells. Single cell-derived clones of both HepG2 and HepG2/5-FU cell lines were obtained via a limiting dilution method and were used for further study. The 50% inhibitory concentration values (IC50) of 5-Fu (mean ± SD) in the HepG2 and HepG2/5-FU cell lines were determined to be 4.88 ± 0.37 μg/mL and 18.72 ± 0.41 μg/mL, respectively. Moreover, the resistant index was calculated to be 3.8 (p < .05), and the dose–response growth curve was plotted and is shown in . Apoptosis is an important factor for chemotherapeutic resistance in cancer cells. The percentage of apoptotic cells was also measured using flow cytometry, which showed that the percentage of early and late apoptotic cells was prominently lower in the HepG2/5-FU cells when compared to its parental cell HepG2 (). These findings suggest that HepG2/5-FU cells exhibit decreased drug sensitivity following repeated 5-FU treatments.
Figure 1. (A) Determining the effects of 5-FU on HepG2 and HepG2/5-FU cell viability using the Cell Counting Kit-8 (CCK-8) assay. All the data were normalized to the untreated control that was set as 100%. Data represent the mean ± SEM pooled from at least three experiments, each performed with three replicates. (B) Flow cytometry analysis showing that treatment of liver cancer cells with 1 μg/mL of 5-FU for 24 h causes more apoptotic death in HepG2 cells than in HepG2/5-FU cells. The lower right quadrant in the image represents early apoptosis, while the upper right quadrant signifies late apoptosis. The percentage of apoptotic cells was calculated by including cells in both, early and late apoptosis. The apoptotic rate is presented as mean ± SEM of three independent experiments. ***p < .001 (two-tailed test).
Upregulation of DVL1 in 5-FU-resistant cells
Using transcriptome sequencing () and the selection criteria (FDR <0.01 and |log2 FC|>1), 641 DEGs were identified, of which 350 were upregulated and 291 were downregulated in HepG2/5-FU cells (). KEGG pathway enrichment analysis was performed to classify the biological functions of the identified DEGs in HepG2/5-FU cells. To find the pivotal signalling pathways and genes involved in the 5-FU resistance process, we focused our study on those pathways in which the DEGs were significantly enriched. The Wnt signalling pathway was found to be among the top three DEG-enriched pathways and thus, piqued our great interest ().
Figure 2. (A) Volcano plot of differentially expressed genes (DEGs), where each dot represents a gene. Upregulated and downregulated DEGs are shown as red and green dots respectively, while the black dots represent those genes whose expressions are not significantly different between HepG2 and HepG2/5-FU cells. The x-axis indicates the difference of the identified gene level, while the y-axis shows the significance of the gene level. Fold change (FC) is a ratio of the expression of two samples and false discovery rate (FDR) is the adjusted p values using the Benjamini and Hochberg approach. DEGs were identified by an FC greater than twofold and an FDR less than 0.01. (B) Kyoto Encyclopedia of Genes and Genomes (KEGG) pathway enrichment of differentially expressed genes (DEGs). The y-axis shows the top 20 enriched KEGG pathways and the x-axis shows the enrichment factors of these pathways. The q value represents the p values after correcting for multiple comparisons and indicates the significance of DEG enrichment. The colour and size of these dots represent the q value and the number of DEGs related to the corresponding pathway, respectively.
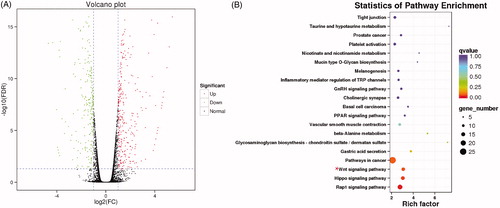
Table 2. Summary statistics of genes from both HepG2 and HepG2/5-FU cells based on transcriptome sequencing (RNA-Seq) data.
Seven DEGs (DVL1, FZD10, ZNRF3, RNF43, DKK1, DKK3 and APC2) from the Wnt signalling pathway were selected to validate their differential expression between the HepG2 and HepG2/5-FU cells using qRT-PCR. The results showed that all the selected DEGs exhibited comparable and identical expression trends between the RNA-Seq and qRT-PCR analyses (), indicating that the DEG data from the RNA-Seq were accurate and credible. Notably, the DVL1 expression levels were further validated using western blotting and found to be significantly upregulated in the HepG2/5-FU cells ( and ). Moreover, we found that the expression of DVL1 was upregulated in the BEL-7402/5-FU cells when compared to the parental BEL-7402 cells ().
Figure 3. Transcriptome sequencing (RNA-Seq) data and quantitative reverse transcription-PCR (qRT-PCR) validation of selected differentially expressed genes (DEGs). The expression levels of the seven Wnt signalling pathway genes demonstrating two upregulated DEGs (FZD10 and DVL1) and five downregulated DEGs (DKK1, DKK3, ZNRF3, RNF43 and APC2). The signal intensity of each transcript was normalized to GAPDH. The x-axis shows the selected DEGs and the y-axis shows the normalized expression levels of the corresponding DEGs. Log2FC/RQ is the logarithm of the fold change or relative quantity to base 2. Error bars represent the standard deviation (STDEV) of the qRT-PCR analysis (n = 3).
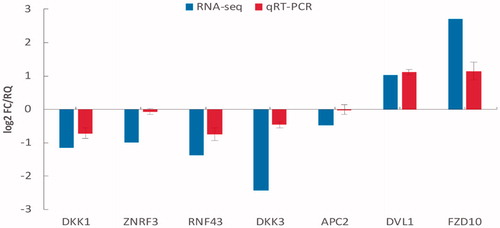
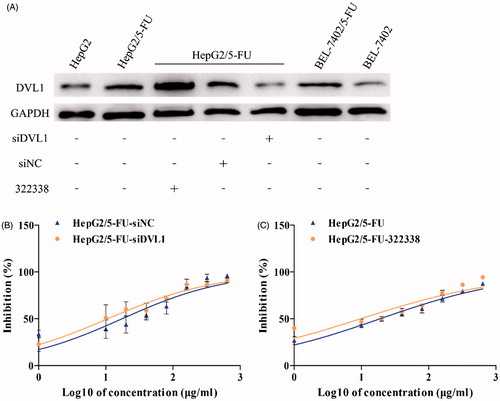
Figure 4. Silencing DVL1 enhanced the sensitivity of HepG2/5-FU liver cancer cells to 5-FU. (A) The DVL1 protein levels, after treatments with or without siDVL1 or 322338 (DVL small molecule inhibitor), were determined using western blot in HepG2, HepG2/5-FU, BEL-7402 and BEL-7402/5-FU cells. GAPDH was used as the internal control. (B) The drug sensitivity of the HepG2/5-FU cells transfected with siDVL1 or siNC. The IC50 of 5-FU in transfected HepG2/5-FU cells. (C) The IC50 of 5-FU in 322338-treated HepG2/5-FU cells. The IC50 of 5-FU was calculated from the inhibition curves generated in (B and C) using the log (inhibitor) vs. response-variable slope method. Each experiment was performed in triplicate.
Silencing DVL1 attenuates 5-FU resistance in HepG2/5-FU cells
Dishevelled-1 has been identified in many tumours and has been suggested to be responsible for tumour growth, progression and metastasis [Citation30]. To determine if DVL1 was involved in the 5-FU-induced resistance of liver cancer, its effects on 5-FU cytotoxicity were determined in HepG2/5-FU cells treated with or without siDVL1 or the DVL small molecule inhibitor, 322338, a cell-permeable amidobenzanilide compound that disrupts the frizzled-dishevelled interaction by targeting the Dvl-PDZ domain, thereby blocking the DVL signalling pathway [Citation31]. As shown in , the expression of DVL1 significantly decreased when HepG2/5-FU cells were treated with siDVL1, but not when they were treated with 322338. Furthermore, the drug cytotoxicity was also assessed in siDVL1- and 322338-treated HepG2/5-FU cells using CCK-8 assays. The results showed that the IC50 of the siDVL1-treated HepG2/5-FU cells significantly decreased when compared to that of the siNC-treated HepG2/5-FU cells (17.43 ± 0.552 vs. 10.71 ± 0.527 μg/mL, p < .05; ). Similarly, the presence of 322338 also sensitized HepG2/5-FU cells to 5-FU (18.89 ± 0.4298 vs. 9.674 ± 0.3944 μg/mL, p < .05; ), which suggested that silencing DVL1 attenuated the 5-FU resistance of HepG2/5-FU cells.
Knockdown and inhibition of DVL1 restored 5-FU responsiveness by increasing cell apoptosis and reducing migration
To determine if the DVL1-mediated 5-FU cytotoxicity of HepG2/5-FU cells was related to cell apoptosis, flow cytometry assays were used to evaluate the percentage of early and late apoptotic cells. As shown in , pre-treatment with siDVL1 or 322338 (120 μg/mL) for 24 h followed by treatment with 5-FU (1 μg/mL) significantly increased the proportion of apoptotic HepG2/5-FU cells when compared to pre-treatments with siNC or blank. These results indicated that downregulation of DVL1 expression or signalling pathway inhibition restored 5-FU responsiveness via increased apoptosis.
Figure 5. Knockdown and inhibition of DVL1 restored 5-FU responsiveness by increasing apoptosis and reducing cell migration. (A) Flow cytometry analysis showing that DVL1 knockdown increases apoptotic cell counts in HepG2/5-FU cells. (B) Flow cytometry analysis showing that DVL1 inhibition increases apoptotic cell counts in HepG2/5-FU cells. (C and D) In vitro migration assay showing that knockdown or inhibition of DVL1 weakens HepG2/5-FU cell motility. The statistical differences were calculated using a two-tailed test.
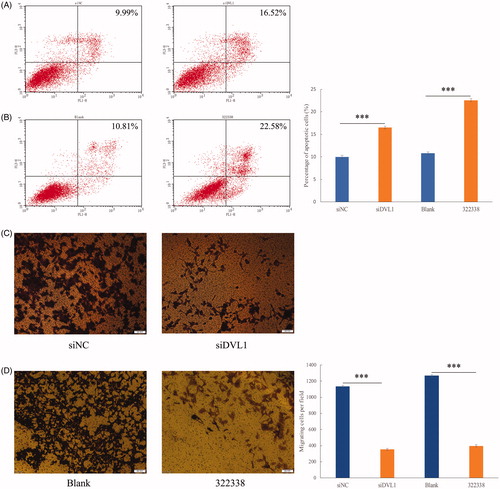
The Wnt signalling pathway plays key roles in multiple aspects of development, including cell proliferation, fate specification, polarity and cell migration [Citation32]. Given that a major role of DVL1 is to positively regulate the Wnt signalling pathway, we further wondered whether 5-FU resistance is mediated by DVL1 overexpression, thereby increasing cell migration. To this end, transwell assays were used to evaluate the cell migration. The HepG2/5-FU cells were again pre-treated with siDVL1 or 322338 (120 μg/mL) for 24 h, followed by treatment with 5-FU (1 μg/mL). Interestingly, we observed that inhibition of DVL1 expression obviously reduced HepG2/5-FU cell migration (). Collectively, these findings suggest that overexpression of DVL1 promotes HepG2/5-FU cell proliferation and migration, thereby mediating 5-FU resistance.
Discussion
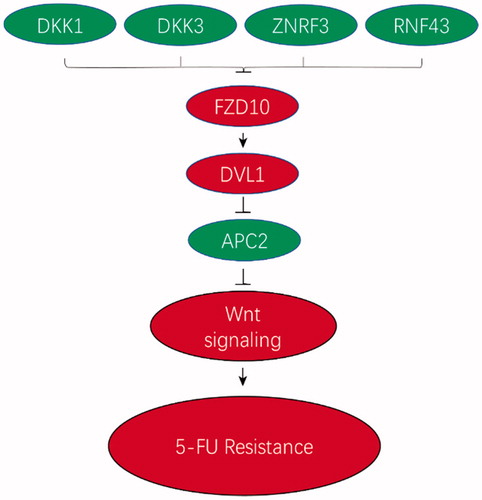
In this work, we primarily reported an association between the Wnt signalling pathway and 5-FU resistance in HCC. We found that the expression of seven key genes in the Wnt signalling pathway was significantly altered in the 5-FU-resistant cells, of which FZD10 and DVL1 were upregulated and DKK1, DKK3, ZNRF3, RNF43 and APC2 were downregulated. We also found that the expression of β-catenin was upregulated in the 5-FU-resistant cells. Interestingly, the proteins of these genes are intrinsically associated with each other in the Wnt signalling process. DKK1, DKK3, ZNRF3 and RNF43 are upstream inhibitors of the Wnt signalling pathway and prevent the formation of active Wnt-Frizzled-LRP5/6 receptor complexes [Citation22,Citation33]. Recently, a complex interaction between these negative regulators and miRNAs was discovered where some miRNAs repressed target mRNAs in the Wnt signalling pathway. Lu et al. [Citation27] found that miR-100 and miR-125b co-ordinately downregulated five negative regulators (DKK1, DKK3, ZNRF3, RNF43 and APC2) of the canonical Wnt/β-catenin signalling pathway, leading to increased Wnt signalling during de novo synthesis and acquired cetuximab resistance in CRC and head and neck squamous cell cancer (HNSCC) cell lines. In turn, activation of these receptor complexes, including FZD10, resulted in the activation of dishevelled proteins such as DVL1, inhibition of glycogen synthase kinase 3 beta, nuclear accumulation of β-catenin, and activation of the Wnt target genes. According to our current understanding of the Wnt signalling pathway, we posited a regulation model in 5-FU-resistant cancer cells where DKK1, DKK3, ZNRF3, RNF43 and APC2 expressions were downregulated, resulting in the overexpression of downstream FZD10 (also known as frizzled homologue 10 (Drosophila)) and DVL1, thereby mediating 5-FU resistance via the Wnt signalling pathway in HepG2/5-FU cells (). In the current study, our transcriptome sequencing results support this model exactly, indicating that regulation of the Wnt signalling pathway is a key factor in acquiring 5-FU resistance in HCC. However, we need to employ more strategies to verify if these regulatory mechanisms exist in HepG2/5-FU cells.
Figure 6. Model of a new mode of acquired 5-FU resistance. Based on experimental findings in this and other studies, we propose a mechanism through which some miRNAs confer 5-FU resistance by targeting and decreasing the expression of five negative regulators (DKK1, DKK3, ZNRF3, RNF43 and APC2) and overexpressing some positive regulators of Wnt signalling, which results in increased Wnt signalling and 5-FU resistance. However, further investigations are needed to verify this model.
The dishevelled family of proteins, including DVL1, are important scaffold proteins in Wnt-Frizzled signalling [Citation34]. DVL1 has been identified in many tumours and has been suggested to be associated with tumour growth, progression and metastasis [Citation30,Citation35,Citation36]. Silencing DVL1 was reported to sensitize A2780/Taxol cells to paclitaxel by downregulating AKT/GSK3B/beta-catenin signalling [Citation24]. When we analysed the RNA-Seq data of human LIHC tissues from the TCGA database, we found that the DVL1 expression in these tissues did not change significantly when compared to the non-tumour tissues. However, in our RNA-Seq results, DVL1 was overexpressed in the HepG2/5-FU cells. Therefore, we posited that targeting DVL1 may lead to the development of a valid novel therapeutic strategy in preventing or ameliorating 5-FU resistance in HCC. In our findings, we observed that DVL1 inhibition could significantly restore 5-FU responsiveness by reducing proliferation, increasing apoptosis and reducing migration induced by 5-FU in HepG2/5-FU cells. Our study demonstrates a novel link between acquired resistance to 5-FU and DVL1 of the Wnt signalling pathway, and provides a rational underlying basis in overcoming 5-FU resistance by inhibiting DVL1.
Upon analysing our RNA-Seq data, we surprisingly found that the key genes involved in 5-FU metabolism (e.g. TYMS, DPYD, MTHFR, TYMP and MDR1) and those associated with 5-FU resistance [Citation12–14] exhibited less than a twofold change in gene expression, and that none of these differences were statistically significant (p > .05). This finding indicates that the mechanism of 5-FU resistance might not be caused by drug metabolism.
In conclusion, we performed a comprehensive evaluation of the transcriptome-related changes in HepG2 cells exhibiting 5-FU resistance. Our study identified seven new promising biomarkers (FZD10, DVL1, DKK1, DKK3, ZNRF3, RNF43 and APC2) in the Wnt signalling pathway that changed in response to 5-FU exposure. Furthermore, DVL1 inhibition may lead to the development of novel therapeutic strategies that overcome 5-FU resistance in liver cancer.
Acknowledgements
We would like to acknowledge all those who contributed to the development of this research and provided input during the study.
Disclosure statement
The authors declare no conflict of interest.
Additional information
Funding
Related Research Data
References
- Cascinu S, Graziano F, Catalano G. Chemotherapy for advanced pancreatic cancer: it may no longer be ignored. Ann Oncol. 1999;10:105–109.
- Jassem J. Chemotherapy of advanced non-small cell lung cancer. Ann Oncol. 1999;10 (Suppl.6):77–82.
- Afreen U, Anuradha M, Mohd A. Nanomedicines: a theranostic approach for hepatocellular carcinoma. Artif Cells Nanomed Biotechnol. 2018;46:680–690.
- Ramalingam S, Belani C. Systemic chemotherapy for advanced non-small cell lung cancer: recent advances and future directions. Oncologist. 2008;13 (Suppl.1):5–13.
- Amir M, Mohammad HS, Masoud D, et al. Liposome-mediated RNA interference delivery against Erk1 and Erk2 does not equally promote chemosensitivity in human hepatocellular carcinoma cell line HepG2. Artif Cells Nanomed Biotechnol. 2017;45:1612–1619.
- Moertel CG. Chemotherapy of gastrointestinal cancer. N Engl J Med. 1978;299:1049–1052.
- Mukai M, Sato S, Tajima T, et al. Recurrence and 5-FU sensitivity of stage I/II node-negative breast, lung, or gastric cancer with occult neoplastic cells in lymph node sinuses. Oncol Rep. 2006;15:815–820.
- Wen SJ, Wang X, Wang YM, et al. Nucleoside diphosphate kinase 2 confers acquired 5fluorouracil resistance in colorectal cancer cells. Artif Cells Nanomed Biotechnol. 2018 [cited 2018 Feb 23]; [10 p.]. DOI:10.1080/21691401.2018.1439835
- Pinedo HM, Peters GF. Fluorouracil: biochemistry and pharmacology. JCO. 1988;6:1653–1664.
- Lin DY, Lin SM, Liaw YF. Non-surgical treatment of hepatocellular carcinoma. J Gastroenterol Hepatol. 1997;12:S319–S328.
- Longley DB, Harkin DP, Johnston PG. 5-Fluorouracil: mechanisms of action and clinical strategies. Nat Rev Cancer. 2003;3:330–338.
- Jin J, Huang M, Wei HL, et al. Mechanism of 5-fluorouracil required resistance in human hepatocellular carcinoma cell line Bel(7402). World J Gastroenterol. 2002;8:1029–1034.
- Scartozzi M, Maccaroni E, Giampieri R, et al. 5-Fluorouracil pharmacogenomics: still rocking after all these years? Pharmacogenomics. 2011;12:251–265.
- Guo JC, Zhao YP, Liao Q, et al. Significance and reversal of MDR1/P-gp in pancreatic cancer chemotherapy. Zhonghua Wai Ke Za Zhi. 2007;45:1488–1490.
- Cui J, Zhou X, Liu Y, et al. Alterations of beta-catenin and Tcf-4 instead of GSK-3beta contribute to activation of Wnt pathway in hepatocellular carcinoma. Chin Med J (Engl). 2003;116:1885–1892.
- Cui J, Zhou X, Liu Y, et al. Wnt signaling in hepatocellular carcinoma: analysis of mutation and expression of beta-catenin, T-cell factor-4 and glycogen synthase kinase 3-beta genes. J Gastroenterol Hepatol. 2003;18:280–287.
- Karbova E, Davidson B, Metodiev K, et al. Adenomatous polyposis coli (APC) protein expression in primary and metastatic serous ovarian carcinoma. Int J Surg Pathol. 2002;10:175–180.
- Lee AY, He B, You L, et al. Expression of the secreted frizzled-related protein gene family is downregulated in human mesothelioma. Oncogene. 2004;23:6672–6676.
- Aminuddin A, Ng PY. Promising druggable target in head and neck squamous cell carcinoma: Wnt signaling. Front Pharmacol. 2016;7:244.
- Wu X, Luo F, Li J, et al. Tankyrase 1 inhibitor XAV939 increases chemosensitivity in colon cancer cell lines via inhibition of the Wnt signaling pathway. Int J Oncol. 2016;48:1333–1340.
- Noda T, Nagano H, Takemasa I, et al. Activation of Wnt/beta-catenin signalling pathway induces chemoresistance to interferon-alpha/5-fluorouracil combination therapy for hepatocellular carcinoma. Br J Cancer. 2009;100:1647–1658.
- Jiang X, Charlat O, Zamponi R, et al. Dishevelled promotes Wnt receptor degradation through recruitment of ZNRF3/RNF43 E3 ubiquitin ligases. Mol Cell. 2015;58:522–533.
- Gao C, Chen YG. Dishevelled: the hub of Wnt signaling. Cell Signal. 2010;22:717–727.
- Zhang K, Song H, Yang P, et al. Silencing dishevelled-1 sensitizes paclitaxel-resistant human ovarian cancer cells via AKT/GSK-3β/β-catenin signalling. Cell Prolif. 2015;48:249–258.
- Fang YN, Zhang C, Wu T, et al. Transcriptome sequencing reveals key pathways and genes associated with cisplatin resistance in lung adenocarcinoma A549 cells. PLoS One. 2017;12:e0170609.
- Ritchie ME, Phipson B, Wu D, et al. Limma powers differential expression analyses for RNA-sequencing and microarray studies. Nucleic Acids Res. 2015;43:e47.
- Lu YY, Zhao X, Liu Q, et al. lncRNA MIR100HG-derived miR-100 and miR-125b mediate cetuximab resistance via Wnt/β-catenin signaling. Nat Med. 2017;23:1331–1341.
- Hajar S, Mahdi S, Fatemeh P, et al. Co-delivery of insulin-like growth factor 1 receptor specific siRNA and doxorubicin using chitosan-based nanoparticles enhanced anticancer efficacy in A549 lung cancer cell line. Artif Cells Nanomed Biotechnol. 2017;46:293–302.
- Zhou J, Jin B, Jin Y, et al. The antihelminthic drug niclosamide effectively inhibits the malignant phenotypes of uveal melanoma in vitro and in vivo. Theranostics. 2017;7:1447–1462.
- Zhao Y, Yang ZQ, Wang Y, et al. Dishevelled-1 and dishevelled-3 affect cell invasion mainly through canonical and noncanonical Wnt pathway, respectively, and associate with poor prognosis in nonsmall cell lung cancer. Mol Carcinog. 2010;49:760–770.
- Grandy D, Shan J, Zhang X, et al. Discovery and characterization of a small molecule inhibitor of the PDZ domain of dishevelled. J Biol Chem. 2009;284:16256–16263.
- Gatcliffe TA, Monk BJ, Planutis K, et al. Wnt signaling in ovarian tumorigenesis. Int J Gynecol Cancer. 2008;18:954–962.
- Zorn AM. Wnt signalling: antagonistic Dickkopfs. Curr Biol. 2001;11:R592–R595.
- Wharton KA Jr. Runnin' with the Dvl: proteins that associate with Dsh/Dvl and their significance to Wnt signal transduction. Dev Biol. 2003;253:1–17.
- Mizutani K, Miyamoto S, Nagahata T, et al. Upregulation and overexpression of DVL1, the human counterpart of the Drosophila dishevelled gene, in prostate cancer. Tumori. 2005;91:546–551.
- You L, Xu Z, Punchihewa C, et al. Evaluation of a chemical library of small-molecule dishevelled antagonists that suppress tumor growth by down-regulating T-cell factor-mediated transcription. Mol Cancer Ther. 2008;7:1633–1638.