
 ?Mathematical formulae have been encoded as MathML and are displayed in this HTML version using MathJax in order to improve their display. Uncheck the box to turn MathJax off. This feature requires Javascript. Click on a formula to zoom.
Abstract
Non-alcoholic fatty liver disease (NAFLD) is one of the most common chronic liver diseases worldwide, and precision therapeutic will be a benefit for the NAFLD regression. In this study, we observed low microRNA 146 b (miR-146 b) expression in NAFLD mice model induced by methionine–choline-deficient diet (MCD) compared with control group. Furthermore, miR-146b−/− mice induced MCD exhibited severe liver steatosis and hepatitis. A bio-distribution study showed that novel Lactosylated PDMAEMA nanoparticles effectively targeted hepatocytes Lac-PDMAEMA. We coupled miR-146b mimic with Lac-PDMAEMA and then were administrated to NAFLD mice model, which could obviously alleviate the hepatic steatosis. Lac-PDMAEMA effectively delivered miR-146b mimic to hepatocytes with a ∼8-fold upregulation of miR-146b mimic targeting MyD88 and IRAK1, and in turn suppressed the expression of PPARγ. Meanwhile, TNF-α and IL-6 mRNA levels were decreased after administration of Lac-PDMAEMA/miR-146b mimic. So, we made a conclusion that targeted delivering miR-146b mimic to the hepatocytes by, coupling Lac-PDMAEMA nanoparticles could effectively alleviate the hepatic steatosis in NAFLD mice, which maybe bring a new and effective way to intervene and therapy the NAFLD.
Graphical Abstract

Introduction
Currently, non-alcoholic fatty liver disease (NAFLD) is one of the most common chronic liver diseases worldwide, its worldwide prevalence has reached 20–40% [Citation1,Citation2]. Approximately 10–20% of NAFLD cases process to non-alcohol steatohepatitis (NASH), which characterized by hepatocellular lipid accumulation (steatosis) along with inflammation and varying degrees of fibrosis [Citation2,Citation3]; however a partial of patients will progress to more severe and irreversible liver damage, including cirrhosis and hepatocellular carcinoma [Citation4,Citation5]. Furthermore, the development of NAFLD is typically accompanied by a series of metabolic disorders [Citation5,Citation6]. Therefore, controlling the progression of NAFLD may help to prevent the development of severe liver diseases and metabolic disorders. Diet and exercise are regarded as an important way to intervene the development of NAFLD, but not at all can keep the compliance of dietary or/and exercise treatment. So certain drugs were administrated to help and improve the NAFLD development [Citation7]. Unfortunately, there is no well-established pharmacological approach makes it imperative to develop novel therapeutic targets and exploring corresponding strategies.
The pathogenesis of NASH is highly heterogeneous and complex. Toll-like receptor (TLR)-4 has received much attention in the pathogenesis of NASH [Citation8–10]. MicroRNAs (miRNAs) are small ∼22 non-coding RNAs that regulate gene expression at a post-transcriptional level through the RNA-induced silencing complex (RISC) [Citation11]. Recent discoveries have revealed that miRs play a key role in the regulation of metabolic gene expression. Further studies supported their critical roles in NAFLD by their ability to modulate hepatic lipid homeostasis [Citation12,Citation13]. miR-146b mimic was as a negative regulator of the TLR-4 signal pathway in human monocytes, where it was found to target three key adaptor molecules downstream of TLR4: myeloid differentiation factor (MyD88), IL-1 receptor-associated kinase 1 (IRAK1) and tumour necrosis factor receptor-associated factor 6 (TRAF6) [Citation14]. Simultaneously, miR-146b mimic was an IL-10–responsive miR and candidate miR-146b mimic was a molecular effector of the IL-10 anti-inflammatory activity [Citation14]. Our results suggest that IL-10 dependent miR-146b mimic plays an important role in the modulation of M1 macrophage orientation [Citation15]. Interestingly, recent studies demonstrated that miR-146b mimic played inflammation suppressor activity in NASH by targeting IRAK1 and TRAF6 respectively [Citation16,Citation17]. Moreover, miR-146b mimic was downregulated in monocytes in obese patients [Citation18]. In a conditional knockout mouse model, knockout MyD88 attenuated lipid accumulation and inflammation in high-fat diet (HFD)-induced NAFLD [Citation8]. Despite these promising results, delivery of miRNAs into cells has been the major challenge for miRNA-based therapeutics so far.
Nanocarriers were promising carriers and frequently selected for miRNA delivery vehicle due to their low toxicity, clinical potential and the ease of production [Citation19–21]. Moreover, nanocarriers also could accurately target the special cellular type, tissue and organization in combination with special ligand or antibody. Hepatic parenchymal was cells with expression of the asialoglycoprotein receptor (ASGR), it was useful as a cellular marker for targeted delivery to hepatocytes [Citation22,Citation23]. Lactosylated gramicidin-based lipid nanoparticles (Lac-GLN) were used to treat hepatocellular carcinoma, with high drug loading capability were investigated and showed excellent safety and anti-tumour efficacy in mice [Citation24]. Furthermore, basing ROS responsive nanoparticles (mPEG-b-PPS-NPs) coupled with molecule melatonin (Mel) could locate at the disease site, and be more biocompatible and much more efficacious than an equivalent amount of free drug in attenuating oxidative stress in sepsis-induced acute liver injury. These data indicated that limited control of the targeting and drug release profile was in favour of their therapeutic efficacy. Lac- were synthesized by a lipophilic ASGR targeting ligand, composed of lactobionic acid (LA), which beared a galactose moiety and linked to a phospholipid and incorporated into LNs for liver-specific delivery of miRs [Citation24,Citation25]. Some subjects verified that micro-RNAs were involved in the occurrence and development of NAFLD to NSH. It has recently reported that administration of miR-146b mimic obviously attenuated the hepatic lipid accumulation and alleviated the steatohepatitis in NAFLD mice model by targeting IRAK1 and TRAF6 [Citation26]. However, systemically administered miRs based therapies to objective cells have been challenging due to its toxicity. MiRs selectively to the hepatic cells in NAFLD mice model may improve therapeutic outcomes and minimize systemic toxicity [Citation27]. In this paper, we used Lac-PDMAEMA to target miR-146b mimic delivery to hepatic cells in NAFLD mice which there was a high expression of ASGR. We evaluated the inhibitory effects of miR-146b mimic in a NAFLD mouse model. Our results showed that Lac-PDMAEMA co-loaded with miR-146b, Lac-PDMAEMA/miR-146b mimic exhibited significant repression lipid droplets in hepatocytes in vitro and abrogated the progression of NAFLD in a MCD induced-mouse model.
Materials and methods
Chemicals and reagents
2,2′-Azobisisobutyronitrile, 5-bromo-4-chloro-3-indoly1-b-d-galactopyranoside (X-Gal, Gibco, Breda, Netherlands), sodium 3′-[1-(phenylaminocarbonyl)-3,4-tetrazolium]-bis(4-methoxy-6-nirto (benzene sulphonic acid (XTT, Sigma, Bornem, Belgium), N-methyl dibenzopyrazine methylsulphate (NPS, Sigma), glutaraldehyde (Fluka), polyvinylpyrrolidone (PUP, molecular weight 40 KD, sigma). All other chemicals were of analytical grade. 2-(Dimethylamino)ethyl methacrylate (DMAEMA, Fluka), N-viny1-pyrrolidone(NVP, Acros), ethoxytriethylene glycol methacrylate (triEGMA, polysciences, Inc. Warrington) and methyl methacrylate (MMA, Acros) were purified by distillation under reduced pressure just before use. Cell culture flasks and microtiter plates were obtained from Falcon. Dulbecco′s Modified Eagles′s Medium (DMEM) and RPMI 1640 and Fetal bovine serum were from Gibco. Lactobionic acid all other reagents were purchased from Sigma-Aldrich (St. Louis, MO) without further purification. Lipofectamine 3000 were purchased from Invitrogen (Grand Island, NY).
Preparation of Lac-PDMAEMA/miR-146b
Lac-PDMAEMA was prepared according to the literature [Citation24]. The Cy3-labeled miR-146b mimic (Cy3-miR-146b), and FAM-labelled miR-146b mimic (FAM-miR-146b) were purchased in Genepharma (Suzhou, China). The miR-146b mimic sequences for mice were UGAGAACUGAAUUCCAUAGGCU; the sequences in mice and humans were the same. The sequence for negative control CY3: UUCUCCGAACGUGUCACGUTT.
To prepare Lac-PDMAEMA/miR-146b, Lac-PDMAEMA and miR-146b mimic were mixed at w/w (weight Lac-PDMAEMA/weight miR-146b) ratio of more than 10:1 in RNase free H2O by adding a stock solution of Lac-PDMAEMA into a miR-146b mimic solution. The samples were vortexed 5–10 s and then incubated at room temperature for 30 min to ensure the formation of Lac-PDMAEMA/miR-146b mimic nanoparticles.
Animals and treatment
Adult C57BL/6 female mice (6–8 weeks old) were obtained from and housed in the Southern Medical University Animal Experiment Center (Guangzhou, China). miR-146b deficient mice were maintained in the Southern Medical University Animal Experiment Center (gifted by Huabao Xiong, associated professor in Icahn Medicine of School at Mount Sinai [Citation15]). All experimental procedures were approved by the Animal Ethics Committee of First Affiliated Hospital of Guangzhou Medical University. NASH was induced by fed chow or methionine choline-deficient diet (MCD; Harlan-Tecklad, Indianapolis, IN) for 2, 3 or 6 consecutive weeks, time at which liver damage is already established [Citation28]. For 2 and 6 weeks, mice were divided into three group: normal chow diet (NCD) (n = 11); mice that continued receiving MCD for 2 weeks (n = 9); mice that continued receiving MCD for 6 weeks (n = 9). C57BL/6 (WT) and miR-146b−/− mice were fed NCD or MCD for 3 weeks. After MCD 1 week, C57BL/6 mice were divided into different groups (n = 5 per group): mice that continued receiving mice fed MCD, mice that continued with MCD diet with tail vein injection of negative control (Lac-PDMAEMA/NC) and mice fed MCD diet and tail vein injection of Lac-PDMAEMA/miR-146b mimic (once a week, total 2 weeks). Liver tissues were collected at 3 weeks after initiation of MCD. Blood was collected just prior to sacrifice. Portions of liver were either frozen immediately in liquid nitrogen, frozen fixed in OCT mounting media or fixed in neutral-buffered formalin.
Cell culture, in vitro transfection studies and co-culture with fatty acids
HCC cell line HepG2 and normal mouse hepatocyte line AML12 were purchased from the Type Culture Collection of the Chinese Academy of Sciences in Shanghai, China, they were supplemented with 10% fetal bovine serum. At 50% of confluence, cells were growth arrested in serum-free medium for 12 h before the experiments.
For miR-146b mimic transfection, HepG2 and AML12 cells were plated at 2 × 10⁵ cells per well in six-well plates. Overnight cells were transfected with 100 nM miR-146b mimic using Lipofectamine 3000 or Lac-PDMAEMA and after 4 h incubation, the medium was replaced with fresh medium. Cells were then treated with Palmitic acid (PA, Sigma) (250 μM) for another 48 h, after which lipid accumulation and adiposeness related protein expression were determined by Oil-Red Staining (Sigma) and Western blotting, respectively. PA was dissolved in DMEM with 2% fatty-acid-free bovine serum albumin (BSA, Sigma) after the solvent was evaporated, then followed by two rounds of overtaxing and 30 s of sonication [Citation29]. As a positive control, cells transfected with miR-146b mimic using Lipofectamine 3000 were performed following manufacturer’s protocol.
Characterization of Lac-PDMAEMA/miR-146b mimic
The particle size of miR-146b mimic containing Lac-PDMAEMA was determined by dynamic light scattering on ZetaPALS (Brooken Haven company, Upton, NY). Particles were dispersed in cell culture medium. The morphology of Lac-PDMAEMA was examined by a JEM-2010HR transmission electron microscope (JEOL, Japan). NMR spectra for structural analysis and monomer conversions were obtained using a Bruker AVANCE 400 MHz NMR spectrometer (Bruker Co., Switzerland). Briefly, samples were prepared as described above. A drop of the sample was negatively stained with uranyl acetate for 1 min on a perforated carbon grid for analysis. The zeta potential of miR-146b mimic containing Lac-PDMAEMA was examined in 20 mM HEPES buffer using ZetaPALS potential analyzer (Brookhaven Instruments Corp., Holtsville, NY).
Encapsulation efficiency of Lac-PDMAEMA was determined by Quant-iT™ RiboGreen RNA Kit (Invitrogen, Grand Island, NY) following the manufacturer’s protocol, and the fluorescence intensity (FI) was determined using a luminescence spectrometer (KS 54B, Perkin Elmer, UK) at an excitation of 480 nm and an emission of 520 nm. The encapsulation efficiency was calculated by the following equation.
(1)
(1)
Agarose gel electrophoresis
Agarose gel electrophoresis was used to evaluate miRNA loading in Lac-PDMAEMA. The miRNA or Lac-PDMAEMA/miR-146b mimic (the dose of miRNA was 100 pmol) was separated on 2% agarose gels containing ethidium bromide, and images were obtained using a UV transilluminator and a digital imaging system (Life Science Technologies, St. Petersburg, FL). Free miRNA and Lac-PDMAEMA/miR-146b mimic will migrate in the gels, but Lac-PDMAEMA/miR-146b mimic will travel to the opposite direction.
Cytotoxicity study
The cytotoxic effects of Lac-PDMAEMA/miR-146b mimic on HepG2 and AML12 cells were measured using Cell Counting Kit-8 kit (CCK-8 kit, Dojindo Laboratories, Japan). The cells were seeded onto 96-well plates at a density of 1 × 10³ cells/well. After overnight incubation cells were treated with free miR-146b, lipo3000/miR-146b mimic or Lac-PDMAEMA/miR-146b mimic for an additional 4 h, the portions of viable cells were measured using CCK-8 kits according to the user’s manual. Cell viability within each group was expressed as a percentage of the viability of untreated control cells.
Uptake of Lac-PDMAEMA/miR-146b mimic
Analysis of the cellular uptake of Lac-PDMAEMA/miR-146b mimic was performed by delivery of fluorescent FAM-miR-146b mimic or Cy3-miR-146b mimic into HepG2 and AML12 cells, evaluated by fluorescence inverted microscope and by flow cytometry.
For fluorescence inverted microscope, 1 × 10⁵ HepG2 and AML12 cells per well were seeded in six-well plates and allowed to grow overnight. Cells were then treated with 100 nM Lac-PDMAEMA-FAM-miR-146b mimic for 4 h at 37 °C; cells were then replaced with fresh medium and were viewed after 24 h using an Olympus BX-53 fluorescence inverted microscope (Olympus, Tokyo, Japan).
For the flow cytometric analysis, 1 × 10⁵ HepG2 and AML12 cells were treated with 100 nM Lac-PDMAEMA-Cy3-miR-146 b mimic or Lipofectamine/miR-146b mimic for 4 h at 37 °C. Cells were suspended using 0.25% trypsin, washed with PBS twice times. The fluorescent intensity was measured on a FACS (BD Arial III Flow Cytometer, San Jose, CA).
In vivo biodistribution studies by IVIS imaging
For in vivo imaging, the C57/6 mice were injected via tail vein a single dose of PBS or Lac-PDMAEMA/miR-146b mimic (1 mg/kg miRNA). Fluorescent Cy3-miR-146b mimic containing Lac-PDMAEMA was used for measuring in vivo uptake in different tissues by IVIS imaging. Whole tissues were harvested and then whole tissue Cy3 fluorescent signals were measured using Xenogeny IVIS-200 Optical in Vivo Imaging system (Caliper Life Sciences, Hopkinton, MA). Liver was harvested and the Lac-PDMAEMA/miR-146b mimic was examined by a transmission electron microscope (FEI Company, Hillsboro, OR)
Serum biochemistry
Serum levels of alanine aminotransferase (ALT) and aspartate aminotransferase (AST) were measured using standard enzymatic procedures according to the manufacturers’ instruction (Thermos Fisher, Pittsburgh, PA).
Oil red O staining
Liver tissues were embedded in OCT compound and then frozen in −20 °C. Frozen sections (10 µm) were stained with Oil Red O (O0625, Sigma, St. Louis, MO) and counterstained with Mayer’s haematoxylin to visualize intracellular lipid droplets. All digital images were obtained with an Olympus IX73 light microscope (Olympus, Tokyo, Japan).
Immunohistochemistry
Deparaffinized liver sections were immunostained for PPARγ, ACC (Cell Signaling Technology, Danvers, MA), MyD88 (Proteintech, Rosemont, IL) and IRAK-1 (Proteintech). The immunostaining was examined with an Olympus IX73 microscope (Olympus, Tokyo, Japan). Positive staining for MyD88, ACC and IRAK-1 were semi-quantified using 100× magnification fields as a percentage of the total surface area and graded into five categories: grade 1 (<10%), grade 2 (10–29%), grade 3 (30–49%), grade 4 (50–79%) and grade 5 (80%). For the PPARγ stain, the number of positive cells was counted in five 400× objective high-power fields (HPFs; 400× magnification) to determine the average number of positively stained cells.
Sirius-red stain
Formalin-fixed paraffin-embedded sections of liver samples were either stained with haematoxylin and eosin, PicroSirius red. Sirius-red stains were performed on formalin-fixed paraffin-embedded sections as previously described [Citation30]. Computer-aided quantification of fibrotic areas was performed on Sirius red stained liver sections from different groups (n = 5) indicated in respective figure legends. Eight microscopic fields from each animal were randomly chosen and photographed under 100× magnification on an Olympus IX73 light microscope (Olympus). Fibrotic areas were calculated as per cent of the whole image area after subtraction of vessel lumen area.
RNA isolation and quantitative real-time RT-PCR (qPCR)
Total RNA was extracted by using Trizol reagent (Takara, Japan) and then reversely transcribed into cDNA through PrimeScript™ RT reagent Kit (Takara) or an oligo (dT) primer (QIAGEN, Valencia, CA). Real-time PCR analyses were performed with SYBR Green mix (Takara). Primer sequences: mouse miR-146b, F:5′-TGAGAACTGAATTCCATAGGC-3′, R:5′-GCAGGGTCCGAGGTATTC-3′; mouse U6, F: 5′-GCTTCGGCAGCACATATACTAAAAT-3′, R:5′-CGCTTCACGAATTTGCGTGTCAT-3′; mouse IL-6, F:5′-CCCCAATTTCCAATGCTCTCC-3′, R:5′-GGATGGTCTTGGTCCTTAGCC-3′; mouse TNF-a, F:5′-GCCACCACGCTCTTCTGTCT-3′, R: 5′-GGTCTGGGCCATAGAACTGATG-3′; mouse IL-β, F:5′-GACGGCACACCCACCCT-3′, R:5′-AAACCGTTTTTCCATCTTCTTCTTT-3′; mouse β-actin, F:5′-ACGGCCAGGTCATCACTATTG-3′, R: 5′-CACAGGATTCCATACCCAAGAAG-3′.
Western blot analysis
Cell and tissue lysates were prepared using RIPA lysis buffer containing 1 × protease cocktail inhibitor (Sigma). Samples of protein were run on 8–12% SDS-PAGE gels for immunoblotting. The primary antibodies were used as follows: the adipogenesis marker antibody sampler kit was come from CST, anti-MyD88 and anti-IRAK-1 were obtained from Proteintech. GAPDH and Secondary HRP-conjugated antibodies were come from Zhonshanjinqiao (Wuhan, China). The image acquisition of blots was performed using a Gene5 image acquisition system (Syngene, Frederick, MD).
Statistical analysis
Results are reported as mean ± standard deviation (SD). SPSS 21.0 software (SPSS Inc., Chicago, IL) was used for analysis. Differences groups were compared using analysis of variance (Student’s t-test OR one way ANOVA post hocs) when applicable or the non-parametric test. *p < .05, **p < .01, ***p < .001 was considered statistically significant.
Results
Expression of miR-146b mimic was decreased in MCD induced-NAFLD mice model
MCD diets will quickly induce measurable hepatic steatosis by 2–4 weeks and this progress to inflammation and fibrosis shortly thereafter [Citation31,Citation32]. Recently have reported that miR-146b mimic ameliorated HFD-induced NASH [Citation26]. However, the expression level of miR-146b mimic in NAFLD was still unclear.
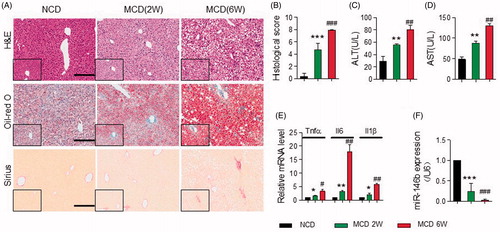
To identify expression of miR-146b mimic in livers, we performed qPCR of hepatic RNA in mice fed an MCD diet for different periods. As shown in , the MCD induced murine model exhibited more severe infiltration of inflammatory cells, steatosis and fibrosis at week 6 than week 2, which were assessed by H&E, oil-red o and Sirius-red staining. The scoring system used to assess the histological damage in MCD-induced NAFLD as previously described [Citation33], and also demonstrated that steatosis and inflammation were severe at 6 weeks (). Serum ALT and AST levels were significantly increased at 2 weeks, and the highest levels at 6 weeks (). Meanwhile, miR-146b level was significantly decreased by qPCR in mice fed with MCD diet for 2 and 6 weeks compared with those fed normal chow diet (NCD), and miR-146b levels at week 2 had 4-fold at week 6 (). Consistently with above, the mRNA levels of TNF-α, IL-6 and IL-1β were significantly increased at 6 weeks (). Based on the expression of miR-146 b, it was conceivable that the miR-146 b was likely to be involved in the precise control of diet-induced pathological changes in the liver.
Figure 1. MiR-146 b expression was decreased in NAFLD. Mice were fed with NCD (n = 11) or MCD for 2 (n = 9) or 6 (n = 9) weeks. As shown in A, the MCD induced murine NAFLD model exhibited more severe inflammation, steatosis and fibrosis at week 6 than week 2, which were assessed by H&E, oil-red O and Sirius-red staining respectively, Scale bar, 100 µm. (B) Histological score in liver tissue from the three groups as described above. (C–D) Serum levels of ALT and AST by ELISA. (E) The expression of Tnfα, Il6 and Il1β in liver tissue either from WT mice that were fed a NCD or MCD by qPCR, Gene expression was normalized to β-actin. (F) qPCR analysis for miR-146b expression in liver tissues from the three groups as described above. Gene expression was normalized to the U6. Data represent as means ± SD; *p < .05, **p < .01, ***p < .001 versus NCD (2 weeks); #p < .05, ##p < .01, ###p < .001 versus MCD (6 weeks).
MiR-146b deficiency enhanced steatosis, steatohepatitis and fibrosis in vivo
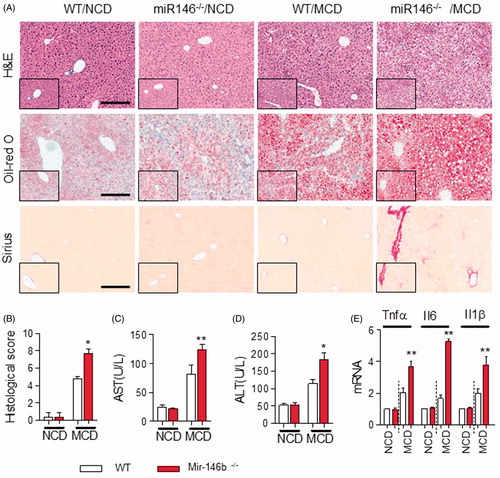
To investigate the effect of miR-146b on steatosis and steatohepatitis, we generated miR-146b-knockout mice by CRISP/CAS9 and fed them either NCD or an MCD for 3 weeks. First, we developed miR-146b−/− mice [Citation15]. MiR-146b−/− mice showed that inflammation progressively advanced in intensity and distribution and included portal areas compared with WT mice induced by MCD diet (). In terms of hepatic steatosis, the deletion of miR-146b significantly increased the lipid accumulation in liver (). The fibrotic index was significantly increased in miR-146b−/− mice fed with MCD (). The histological score also demonstrated that miR-146 b deficiency was effective in promoting inflammation and fibrosis (), which were associated with a significant increase in serum level of ALT and AST in the MCD-treated miR-146b−/− mice compared to MCD-treated WT mice ()). These observations also were correlated with the high expression of mRNA of TNF-α, IL-6 and IL-1β in miR-146b−/− mice as determined by qPCR (). These results suggested that miR-146b attended in the development of NALFD to NASH.
Figure 2. Mir-146 b deletion exacerbated hepatic steatosis, inflammation and fibrosis. WT and Mir-146b−/− mice that were fed a NCD (n = 5 mice per group) or a MCD (n = 5 mice per group) for 3 weeks. (A) Representative H&E-stained (left) and Oil Red O-stained (right) liver sections from WT and miR-146b−/− mice that were fed a MCD for 3 weeks. Scale bar, 100 µm. (B) Histological score in liver tissue from the above groups. (C,D) Serum levels of ALT and AST. (E) qPCR analysis for Tnfα, Il6 and Il1β expression in liver samples either from WT mice that were fed a NCD or MCD. Gene expression was normalized to β-actin. Data represent as means ± SD; *p < .05, **p < .01.
Preparation and characterization of Lac-PDMAEMA/miR-146b mimic nanoparticles
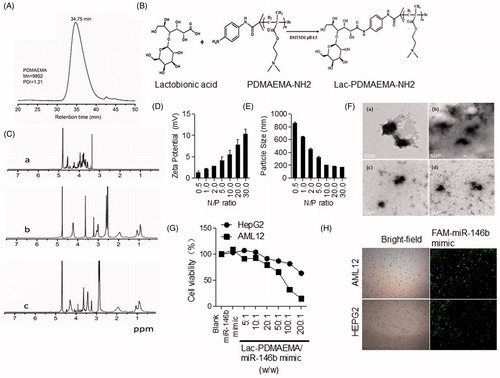
Lac-PDMAEMA and Lac-PDMAEMA/miR-146b mimic were synthesized as previously described and were characterized by TEM, AFM and DLS [Citation24]. The average particle sizes of Lac-PDMAEMA and Lac-PDMAEMA/miR-146 b mimic were about 150–350 nm respectively as measured by DLS. The PDI of Lac-PDMAEMA/miR-146b mimic was 1.21, and GPC curves exhibited the single-peak curve, which showed the characteristics of the complex narrow distributions (). The zeta potentials of Lac-PDMAEMA/miR-146b mimic was 10.3 mV, The reduced zeta potential of Lac-PDMAEMA/miR-146b mimic was due to the incorporation of the miRNA with a negative potential. TEM images showed that the Lac-PDMAEMA/miR-146b mimic nanoparticles were dispersed in the solution and particle shape was uniform. DLS determination also indicated that the particle size had a normal distribution ()). The average particle size of the Lac-PDMAEMA/miR-146b mimic determined by TEM was about 168.9 nm. A similar result was obtained by AFM (). Furthermore, we also investigate the cellular uptake and cytotoxicity of Lac-PAMAEMA/miR-146b mimic nanoparticle. Because HCC HepG2 cells, which has high ASGR expression, HepG2 and AML12 cells were used as in vitro model [Citation24]. No significant change in cell viability was observed between treated cells (the ratio of Lac-PDMAEMA/miRNA was 5:1 or 10:1) and untreated cells, but the cell viability decreased when the ratio increased (). The weight ratio for the best loading efficiency of miRNA was carefully optimized using the agarose gel electrophoresis analysis. The miRNA was fully entrapped in the loading wells with Lac-PDMAEMA when the ratio of Lac-PDMAEMA and miRNA was 10:1 (w/w) (Supplementary Figure S1(A)) Suggesting maximum loading of the miRNA into the Lac-PDMAEMA at this ratio. To determine whether Lac-PDMAEMA-FAM-miR-146b mimic nanoparticles can be taken up by HepG2 and AML12 cells, we treated HepG2 and AML12 cells with Lac-PDMAEMA -FAM-miR-146b mimic at a miR-146b mimic concentration of 100 nM. As shown in that Lac-PDMAEMA-FAM-miR-146b mimic was taken up by the HepG2 and AML12 cells. These data suggest that Lac-PDMAEMA/miR-146b mimic can enhance efficiently deliver miR-146b mimic to the cells. These results suggested a low cytotoxicity and high efficiently deliver of Lac-PDMAEMA (10:1) in HepG2 and AML12 cells.
Figure 3. Synthesis of Lac-PDMAEMA coupling miR-146b mimic. (A) GPC curve; (B) Process of synthesis of Lac-PDMAEMA; (C) 1H NMR spectra of (a) Lac, (b) PDMAEMA and (c) Lac-PDMAEMA: (D,E) Determination of diameter distribution of Lac-PDMAEMA/miR-146b mimic nanoparticles using dynamic light scattering (DLS). (F) TEM images of the Lac-PDMAEMA/miRNA complexes: a (N/P = 5), b (N/P = 10), c (N/P = 20), d (N/P = 30). (G) The evaluation of cytotoxicity for Lac-PDMAEMA/miR-146b mimic complex in different ratio: (H) Uptake effect of Lac-PDMAEMA/miR-146b mimic complex in HepG2 and AML12 cell lines. Cells were then treated with 100 nM Lac-PDMAEMA/FAM-miR-146b mimic and then were viewed after 24 h using a fluorescence inverted microscope.
Lac-PDMAEMA/miR-146b mimic inhibited the lipid accumulation and adipogenesis
To further define the role of miR-146b mimic on lipid accumulation, the well-established in vitro model of lipid accumulation (PA administration model) was applied. HepG2 and AML12 cells respectively were treated with Lac-PDMAEMA/NC or Lac-PDMAEMA/miR-146b mimic and then incubation with PA for 48 h. The Oil-Red results showed that Lac-PDMAEMA/miR-146b mimic significantly inhibited the lipid accumulation in HepG2 and AML12 cells compared with untreated control cells ().
Figure 4. Anti-steatosis activity of Lac-PDMAEMA/miR-146b mimic in HepG2 and AML12 cells in vitro: Cells were pre-treated with 100 nM Lac-PDMAEMA/NC or Lac-PDMAEMA/miR-146b mimic for 4 h, and then treated with PA (250 μM) for 48 h. (A) Oil-red O was used to determine the lipid accumulation. Scale bar, 25 µm. (B) Western blot was used to determine the protein levels of PPARγ, and the result was normalized with GAPDH. (C) Confluent HepG2 and AML12 cells were incubated with 250 μ5 PA for indicated period. MyD88 and IRAK1 protein expression were examined by western blotting. The results, normalized with GAPDH. (D) Cells were pre-treated with 100 nM Lac-PDMAEMA/NC or Lac-PDMAEMA/miR-146b for 4 h, and then treated with PA (250 μM) for 48 h. MyD88 and IRAK1 protein expression were examined by western blotting. The results were normalized with GAPDH.
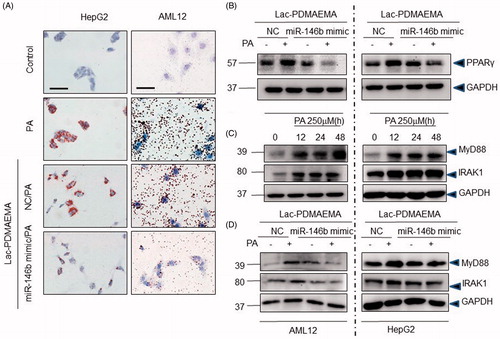
The mass of adipose tissue could be reduced by increasing lipolysis, or/and inhibiting adipogenesis. Further, we examined whether adipogenic markers were affected by Lac-PDMAEMA/miR-146b mimic in hepatocytes. It has been reported that the PPARγ is essential for the formation lipid droplets [Citation34], we observed a significant reduction in PPARγ expression in the Lac-PDMAEMA/miR-146b mimic treatment group (). These results implied that Lac-PDMAEMA/miR-146b mimic suppressed the formation of lipid droplets.
Downregulation of MyD88 and IRAK1 by Lac-PDMAEMA/miR-146b mimic in vitro
The miR-146b mimic was as a negative regulator of the TLR4-signalling pathway [Citation14,Citation17,Citation26]. We wondered whether the Lac-Lac-PDMAEMA/miR-146b mimic affected the hepatic steatosis and steatohepatitis by targeting MyD88 and IRAK1 expression in hepatic parenchymal cells after PA administration. As shown in , PA significantly increased the expression of MyD88 and IRAK1 protein in a time-dependent manner. MyD88 and IRAK1 were significantly decreased in LAC-PDMAEMA/miR-146b mimic group compared with LAC-PDMAEMA/146b NC group (). These results implied that miR-146b mimic was able to decrease the MyD88 and IRAK1 expression in PA-administered hepatic parenchymal cells.
Lac-PDMAEMA/miR-146b could directly target the hepatocytes and attenuated the hepatic steatosis in vivo
In order to assess the in vivo delivery efficiency and tissue specificity of Lac-PDMAEMA, Cy3-miR-146b mimic coupling with Lac-PDMAEMA particles was injected in C57BL/6 tail at a dose of 1.5 mg/kg. As shown in , maximal fluorescence signals accumulated in the liver when mice were treated with Lac-PDMAEMA/146b with no detectable signal in lung, spleen and kidney. These results suggested that the delivery of Cy3-miR-146b mimic by Lac-PDMAEMA was specific to liver. Furthermore, TEM was performed to investigate the nanoparticle location of liver. TEM images showed a spherical shape and a relatively uniform size distribution of Lac-PDMAEMA, which located the hepatocytes ().
Figure 5. Lac-PDMAEMA/miR-146b mimic receded the hepatic steatosis in NAFLD model in vivo. (A) Tissue distribution of Lac- PDMAEMA/Cy3-miR-146b mimic in mice. Lung, spleen, kidney and liver were harvested from C57BL/6 mice 4 h after intravenous administration of Lac-PDMAEMA/Cy3-miR-146b mimic (1 mg/kg miRNA). Cy3 fluorescence signals were measured by IVIS Imaging system. (B) Morphology of Lac-PDMAEMA/Cy3-miR-146b mimic was determined by TEM in liver. Scale bar represents 100 nm. (C) After MCD 1 week, C57BL/6 mice were divided into different groups (n = 5 per group): mice that continued receiving mice fed MCD, mice that continued with MCD diet with tail vein injection of negative control (Lac-PDMAEMA/NC) and mice fed MCD diet with Lac-PDMAEMA/miR-146b mimic (once a week, total 2 weeks). The efficacy of transfection of miR-146b mimic was determined by qPCR. (D) The degree of inflammation, steatosis and fibrosis in murine NAFLD model were assessed by H&E, oil-red O and Sirius-red staining respectively, Scale bar, 100 µm. (E) Histological score in liver tissue from the three groups as described above. (F) qPCR analysis for TNF-α, IL-6 and IL-1β expression in liver samples. Gene expression was normalized to β-actin. (G,H) Serum levels of ALT and AST. Data represent as means ± SD; *p < .05, **p < .01, ***p < .001 versus MCD group.
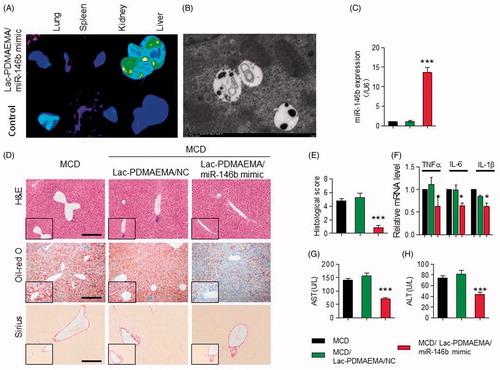
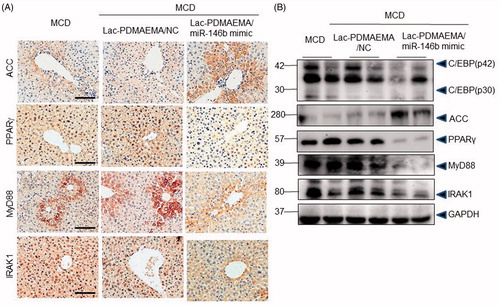
Figure 6. Downregulation of IRAK1, MyD88 and PPARγ, MyD88 and IRAK1, as well increased ACC by miR-146b in mice fed a MCD diet. (A) Immunohistochemically staining for IRAK1, MyD88, PPARγ and ACC in mice. Scale bar represents 50 μ0. (B) Representative western blots showed the protein levels of C-EBP, ACC, PPARγ, MyD88 and IRAK1 in mice. These results were normalized with GAPDH.
Next, Lac-PDMAEMA/miR-146b mimic function was evaluated in miR-146b−/− NAFLD mouse model. Lac-PDMAEMA/NC or Lac-PDMAEMA/miR-146b mimic was administered via tail vein at doses 170 μg/kg miR-146b mimic (once a week, total 2 weeks) in 0.1 ml saline under anaesthesia at 1 week after the first MCD feed. Mice were sacrificed until 3 weeks. MiR-146b level increased in Lac-PDMAEMA/miR-146b mimic group by qPCR (), these data confirmed that miR-146b could be accurately delivered to hepatocytes by Lac-PDMAEMA. Next, we analyse the change of pathological of liver. As shown in , H&E staining and Oil-Red staining showed inflammation and lipid droplets formation was significantly decreased, respectively. Sirius Red staining no-showed significantly decreased fibrosis in livers over-expression Lac-PDMAEMA/miR-146b mimic compared to the control and Lac-PDMAEMA/NC consistently. The histological score also demonstrated that Lac-PDMAEMA/miR-146b mimic given was effective in promoting inflammation and steatosis (). Consistently with these results, the mRNA levels of TNF-α, IL-6 and IL-1β were significantly decreased in MCD mice treated with Lac-PDMAEMA/miR-146b (). Serum ALT and AST levels were also significantly decreased ()).
In vivo, we investigated the effects of Lac-PDMAEMA/miR-146b mimic on the MyD88, IRAK1 and adipogenic markers, such as PPARγ, ACC (Acetyl-CoA Carboxylase) and C/EBPα, etc IHC showed less hepatic expression of PPARγ, MyD88 and IRAK1 were found in the MCD-treated Lac-PDMAEMA/miR-146b mimic mice than in the control and Lac-PDMAEMA/NC mice, and ACC significantly increased (). Consistently, Western blot analysis revealed that PPARγ, C/EBPα, MyD88 and IRAK1 were significantly decreased in liver and ACC was significantly increased after administration of miR-146b mimic (). So, these data stated that Lac-PDMAEMA could directly target the hepatocyte, and effectively delivered the miR-146b mimic, which obviously suppressed the hepatic steatosis in vivo.
Discussion
It is widely considered that rising saturated liver fat content is the first “hit” of the pathogenesis of NAFLD, followed by multiple additional factors that trigger the inflammatory activity [Citation35,Citation36]. However, no specific anti-steatosis medical therapy exists. In the present study, we revisited the NAFLD mice induced by MCD with decreased miR-146b. MiR-146b deficient mice exhibit susceptible steatosis and inflammation. Furthermore, a novel hepatocyte-targeted Lac-PDMAEMA exhibited more delivery efficacy and target to hepatocytes in vitro and in vivo. Finally, treatment with Lac-PDMAEMA/miR-146b mimic significantly suppressed lipid droplets formation in vivo and ameliorated NAFLD development. Collectively, the results suggest miR-146b expressed in liver may play an important role in the process of lipid droplets formation, and Lac-PDMAEMA/miR-146b mimic maybe as the potential therapeutic approaches for NAFLD and possibly for liver fibrosis.
As previously reported, aberrant miRs expression was observed in NAFLD and NASH-induced hepato-carcinogenesis [Citation13,Citation22,Citation37,Citation38]. MiRs were able to modify gene expression at the post-transcriptional level by binding to the 3′UTRs of gene transcripts and thereby repressing their translation or inducing their degradation [Citation39]. They often regulated multiple target genes within the same biological pathway. Largely of studies further supported their critical role in metabolism, differentiation, cell growth, stress response, tissue remodelling and safeguards the stability of biological systems [Citation12,Citation39]. Post-transcriptional gene silencing by miR-146b mimic was known to play important role in regulating inflammatory response and tumour development [Citation40–42]. The expression of miR-146b mimic was greatly increased in human monocytes by LPS, TNF-α and IL-1β [Citation16]. Meanwhile, miR-146b mimic function as negative regulators of the inflammatory process due to their ability to target IRAK1 and TRAF6, known modulators of the TLR4 pathway, for translational repression and thereby inhibiting pro-inflammatory cytokine signalling [Citation16,Citation43]. In addition, some study provided evidence that miR-146b induction depended on the activity of IL-10 produced after LPS [Citation14]. We had reported that IL-10 induces the expression of miR-146b in the modulation of M1 macrophage differentiation, and we also generated the miR-146b−/− mice by CRISP/CAS9, which spontaneously developed the colitis the same as IL-10−/− mice [Citation15,Citation44]. So miR-146b mimic was thought to play a critical role in the process of inflammatory disease. NASH was characterized by steatosis with inflammation. The previous study showed that upregulation of miR-146b mimic could significantly inhibit the lipid accumulation and inflammation both in vitro and in vivo [Citation26,Citation45]. However, despite its important roles in anti-steatosis and anti-inflammation, the potential therapeutic of miR-146b mimic has not been adequately evaluated in a translational research setting. In our study, we firstly demonstrated that miR-146b mimic was frequently downregulated in NAFLD, and functions as a lipid accumulation and inflammation suppressor in NAFLD.
Some miRNA-targeted therapeutics has been considered applied in clinical, but the major challenge is identifying the most efficacious delivery candidates. Traditional methods for miRs delivery included electroporation, a lipid-based delivery agent such as Lipofectamine 3000 and virus transfection. However, these methods often exhibited limited delivery efficacy in application due to various barriers such as lysosomal degradation and off-target uptake in vivo. It has already been demonstrated that free miR-146b mimic exhibit anti-steatosis and anti-inflammation activity [Citation26]. However, despite the encouraging anti-inflammation efficacy of the mono-delivering miR-146b, limited delivery efficacy and degradation eventually contributes to treatment failure. The thrilling news was that hepatocyte-targeted LN with the capability of overcoming in vivo delivery barriers was designed and synthesized [Citation25]. Furthermore, Lac-PDMAEMA was synthesized that favoured localization to the liver and diminished the off-target uptake from other tissues to a great extent [Citation24]. In this study, Lac-PDMAEMA/miR-146b mimic was successfully synthesized using the method originally developed by Zhang et al. [Citation24]. As shown in this study, Lac-PDMAEMA/miR-146b mimic system was able to efficiently deliver to hepatocytes.
We uncovered that miR-146b acted as a lipid accumulation and inflammation suppressor in NAFLD model with a series of in vitro and in vivo assays. Although miR-146b attenuates high-fat diet-induced non-alcoholic steatohepatitis (NASH), but miR-146b couldn’t discriminate the cell type [Citation26], and the lipid accumulation maybe be triggered by the certain cytokines releasing by Kupffer cells in the treatment of miR-146b. It was unclear whether miR-146b could directly regulate the hepatocyte metabolism. So, Lac-PDMAEMA particles were employed to delivery miR-146b mimic to the hepatocyte. Our data confirmed that miR-146 b was downregulated in NAFLD and significantly associated with lipid accumulation degree. Furthermore, we also have shown that miR-146b−/− deficient mice were easier to develop NAFLD. And then, Lac-PDMAEMA particles coupled miR-146b mimic could obviously inhibit the hepatic steatosis with only aiming at the hepatocyte. After validating miR-146b mimic acted as a NAFLD-associated miRNA in vitro and in vivo, the previous study also revealed that TLR4 related pathway plays a key role in the anti-inflammation process of miR-146b [Citation14]. Other research reported that mTOR signalling pathway played a vital function and inactivating the mTOR signalling could change the metabolic process, which was involved in the development of the NAFLD and NASH, and inhibit the expression of IL-6, TNFα, but increase IL-10 expression [Citation46,Citation47]. We also confirm that Lac-PDMAEMA–miR-146b mimic particle could attenuate the proinflammation cytokines including TNFα, IL-6 and IL-1β, which may be mediate by myD88 and IRAK-1. Thus, by facilitating the degradation of TLR4 related markers in liver, miR-146 b mimic attenuated both NAFLD pathologies and its complications.
To the best of our knowledge, this was the first report on the therapeutic value of miR-146b mimic in a NAFLD model when it was delivered with targeted nanoparticles (Graphical Abstract). We have provided evidence that nanoparticles delivering miRs modulating specific molecular targets in hepatocytes represent a potential therapeutic agent for NAFLD.
| Abbreviations | ||
| NAFLD | = | non-alcoholic fatty liver disease |
| NASH | = | non-alcohol steatohepatitis |
| NCD | = | normal chow diet |
| MCD | = | methionine–choline-deficient diet |
| Lac-PDMAEMA | = | Lactosylated poly(2-(dimethylamine) ethyl methacrylate)nanoparticles |
| TLR | = | Toll-like receptor |
| RISC | = | RNA-induced silencing complex |
| MyD88 | = | myeloid differentiation factor |
| IRAK1 | = | IL-1 receptor-associated kinase 1 |
| TRAF6 | = | tumour necrosis factor receptor-associated factor 6 |
| ASGR | = | asialoglycoprotein receptor |
| LA | = | lactobionic acid |
| PA | = | Palmitic acid |
| ACC | = | Acetyl-CoA carboxylase |
Supplementary.docx
Download MS Word (78.4 KB)Disclosure statement
The authors declare that they have no competing interests.
Additional information
Funding
References
- Younossi ZM, Koenig AB, Abdelatif D, et al. Global epidemiology of nonalcoholic fatty liver disease-Meta-analytic assessment of prevalence, incidence, and outcomes. Hepatology. 2016;64:73–84.
- Wree A, Broderick L, Canbay A, et al. From NAFLD to NASH to cirrhosis-new insights into disease mechanisms. Nat Rev Gastroenterol Hepatol. 2013;10:627–636.
- Zhao GN, Zhang P, Gong J, et al. Tmbim1 is a multivesicular body regulator that protects against non-alcoholic fatty liver disease in mice and monkeys by targeting the lysosomal degradation of Tlr4. Nat Med. 2017;23:742–752.
- Hall Z, Bond NJ, Ashmore T, et al. Lipid zonation and phospholipid remodeling in non-alcoholic fatty liver disease. Hepatology. 2016;65:1165–1180.
- Gariani K, Ryu D, Menzies KJ, et al. Inhibiting poly ADP-ribosylation increases fatty acid oxidation and protects against fatty liver disease. J Hepatol. 2017;66:132–141.
- Hong CP, Park A, Yang BG, et al. Gut-specific delivery of T-helper 17 cells reduces obesity and insulin resistance in mice. Gastroenterology. 2017;152:1998–2010.
- Non-alcoholic fatty liver disease: assessment and management. National Institute for Health and Care Excellence: Guidance. London: NICE; 2016.
- Li L, Chen L, Hu L, et al. Nuclear factor high-mobility group box1 mediating the activation of Toll-like receptor 4 signaling in hepatocytes in the early stage of nonalcoholic fatty liver disease in mice. Hepatology. 2011;54:1620–1630.
- Rivera CA, Adegboyega P, van Rooijen N, et al. Toll-like receptor-4 signaling and Kupffer cells play pivotal roles in the pathogenesis of non-alcoholic steatohepatitis. J Hepatol. 2007;47:571–579.
- Spruss A, Kanuri G, Wagnerberger S, et al. Toll-like receptor 4 is involved in the development of fructose-induced hepatic steatosis in mice. Hepatology. 2009;50:1094–1104.
- Ambros V. The functions of animal microRNAs. Nature. 2004;431:350–355.
- Willeit P, Skroblin P, Kiechl S, et al. Liver microRNAs: potential mediators and biomarkers for metabolic and cardiovascular disease? Eur Heart J. 2016;37:3260–3266.
- Rottiers V, Naar AM. MicroRNAs in metabolism and metabolic disorders. Nat Rev Mol Cell Biol. 2012;13:239–250.
- Curtale G, Mirolo M, Renzi TA, et al. Negative regulation of Toll-like receptor 4 signaling by IL-10-dependent microRNA-146b. Proc Natl Acad Sci USA 2013;110:11499–11504.
- Peng L, Zhang H, Hao Y, et al. Reprogramming macrophage orientation by microRNA 146b targeting transcription factor IRF5. EBioMedicine. 2016;14:83–96.
- Taganov KD, Boldin MP, Chang KJ, et al. NF-kappaB-dependent induction of microRNA miR-146, an inhibitor targeted to signaling proteins of innate immune responses. Proc Natl Acad Sci USA. 2006;103:12481–12486.
- Jiang W, Ni Q, Tan L, et al. The microRNA-146a/b attenuates acute small-for-size liver graft injury in rats. Liver Int. 2015;35:914–924.
- Hulsmans MVDE, Mathieu C, Holvoet P. Decrease of miR-146b-5p in monocytes during obesity is associated with loss of the anti-inflammatory but not insulin signaling action of adiponectin. PLoS One. 2012;7:e32794.
- Deng X, Cao M, Zhang J, et al. Hyaluronic acid-chitosan nanoparticles for co-delivery of MiR-34a and doxorubicin in therapy against triple negative breast cancer. Biomaterials. 2014;35:4333–4344.
- Yang T, Zhao P, Rong Z, et al. Anti-tumor efficiency of lipid-coated cisplatin nanoparticles co-loaded with microRNA-375. Theranostics. 2016;6:142–154.
- Chen Y, Zhu X, Zhang X, et al. Nanoparticles modified with tumor-targeting scFv deliver siRNA and miRNA for cancer therapy. Mol Ther. 2010;18:1650–1656.
- Sato A, Takagi M, Shimamoto A, et al. Small interfering RNA delivery to the liver by intravenous administration of galactosylated cationic liposomes in mice. Biomaterials. 2007;28:1434–1442.
- Kelkar DA, Chattopadhyay A. The gramicidin ion channel: a model membrane protein. Biochim Biophys Acta. 2007;1768:2011–2025.
- Zhang M, Zhou X, Wang B, et al. Lactosylated gramicidin-based lipid nanoparticles (Lac-GLN) for targeted delivery of anti-miR-155 to hepatocellular carcinoma. J Control Release. 2013;168:251–261.
- Zhou X, Zhang M, Yung B, et al. Lactosylated liposomes for targeted delivery of doxorubicin to hepatocellular carcinoma. Int J Nanomedicine. 2012;7:5465–5474.
- Jiang W, Liu J, Dai Y, et al. MiR-146b attenuates high-fat diet-induced non-alcoholic steatohepatitis in mice. J Gastroenterol Hepatol. 2015;30:933–943.
- Zhang S, Ermann J, Succi MD, et al. An inflammation-targeting hydrogel for local drug delivery in inflammatory bowel disease. Sci Transl Med. 2015;7:300ra128.
- Valdecantos MP, Pardo V, Ruiz L, et al. A novel glucagon-like peptide 1/glucagon receptor dual agonist improves steatohepatitis and liver regeneration in mice. Hepatology. 2016;65:950–968.
- Ma C, Kesarwala AH, Eggert T, et al. NAFLD causes selective CD4(+) T lymphocyte loss and promotes hepatocarcinogenesis. Nature. 2016;531:253–257.
- Kao YHCC, Jawan B, Chung YH, et al. Upregulation of hepatoma-derived growth factor is involved in murine hepatic fibrogenesis. J Hepatol. 2010;52:96–105.
- Sahai A, Malladi P, Melin-Aldana H, et al. Upregulation of osteopontin expression is involved in the development of nonalcoholic steatohepatitis in a dietary murine model. Am J Physiol Gastrointest Liver Physiol. 2004;287:G264–G273.
- Weltman MDFG, Liddle C. Increased hepatocyte CYP2E1 expression in a rat nutritional model of hepatic steatosis with inflammation. Gastroenterology. 1996;116:1645–1653.
- Kleiner DE, Brunt EM, Van Natta M, et al. Design and validation of a histological scoring system for nonalcoholic fatty liver disease. Hepatology. 2005;41:1313–1321.
- Rosen ED, Sarraf P, Troy AE, et al. PPAR gamma is required for the differentiation of adipose tissue in vivo and in vitro. Mol Cell. 1999;4:611–617.
- Engin A. Non-alcoholic fatty liver disease. Adv Exp Med Biol. 2017;960:443–467.
- Perla FM, Prelati M, Lavorato M, et al. The role of lipid and lipoprotein metabolism in non-alcoholic fatty liver disease. Children 2017;4:E46.
- Wang B, Majumder S, Nuovo G, et al. Role of microRNA-155 at early stages of hepatocarcinogenesis induced by choline-deficient and amino acid-defined diet in C57BL/6 mice. Hepatology. 2009;50:1152–1161.
- Lundbaek JA, Collingwood SA, Ingolfsson HI, et al. Lipid bilayer regulation of membrane protein function: gramicidin channels as molecular force probes. J R Soc Interface. 2010;7:373–395.
- Adlakha YK, Seth P. The expanding horizon of MicroRNAs in cellular reprogramming. Prog Neurobiol. 2017;148:21–39.
- Li Y, Zhang H, Dong Y, et al. MiR-146b-5p functions as a suppressor miRNA and prognosis predictor in non-small cell lung cancer. J Cancer. 2017;8:1704–1716.
- Li C, Miao R, Liu S, et al. Down-regulation of miR-146b-5p by long noncoding RNA MALAT1 in hepatocellular carcinoma promotes cancer growth and metastasis. Oncotarget. 2017;8:28683–28695.
- Imamura T, Komatsu S, Ichikawa D, et al. Depleted tumor suppressor miR-107 in plasma relates to tumor progression and is a novel therapeutic target in pancreatic cancer. Sci Rep. 2017;7:5708.
- Bhaumik DSG, Schokrpur S, Patil CK, et al. MicroRNAs miR-146a/b negatively modulate the senescence-associated inflammatory mediators IL-6 and IL-8. Aging. 2009;1:402–411.
- Kiesler P, Fuss IJ, Strober W. Experimental Models of Inflammatory Bowel Diseases. Cell Mol Gastroenterol Hepatol. 2015;1:154–170.
- Jin X, Liu J, Chen YP, et al. Effect of miR-146 targeted HDMCP up-regulation in the pathogenesis of nonalcoholic steatohepatitis. PLoS One. 2017;12:e0174218.
- Tarantino G, Capone D. Inhibition of the mTOR pathway: a possible protective role in coronary artery disease. Ann Med. 2013;45:348–356.
- Weichhart T, Costantino G, Poglitsch M, et al. The TSC-mTOR signaling pathway regulates the innate inflammatory response. Immunity. 2008;29:565–577.