
 ?Mathematical formulae have been encoded as MathML and are displayed in this HTML version using MathJax in order to improve their display. Uncheck the box to turn MathJax off. This feature requires Javascript. Click on a formula to zoom.
Abstract
Theranostic nanoparticles have attracted considerable attention in recently revolutionized medicine. Since the last decade, there has been a growing attempt to design various theranostic nanoparticles but difficulties still exist in the fabrication of their biocompatible one. Herein, fluorescent titania nanoparticles (FTN) were fabricated using a one-step green method. This FTN had ultra-high doxorubicin hydrochloride (DOX) loading capacity (encapsulation efficiency 95.50% and loading content 38.20%) that release the loaded drug in response to acidic pH. In vitro cytotoxicity experiments on human osteosarcoma (SaOs-2) and breast cancer (MCF-7) cell lines revealed superior anticancer efficacy (lowered the IC50 concentration by 3- and 5.5-fold for SaOs-2 and MCF-7 cells, respectively) and also better imaging for intracellular tracking of DOX/FTN relative to free DOX. Furthermore, the prepared nanoparticles showed efficient antibacterial activity against both gram-negative (Escherichia coli ATCC 25922) and gram-positive (Staphylococcus aureus ATCC 25923) bacteria. In this study, we have developed novel theranostic titania nanoparticles with inherent fluorescence property for cancer imaging and therapy.
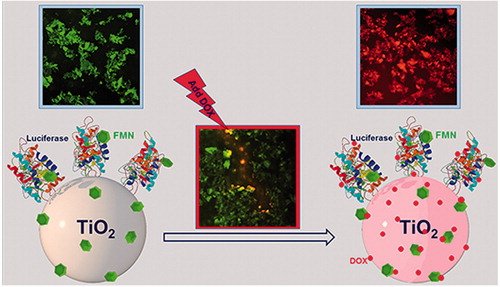
Graphical Abstract
Introduction
Nanotheranostics or theranostic nanomedicine, the next generation of medicine, is implementation of nanotechnology for imaging and therapy simultaneously [Citation1]. The major challenges of nanotheranostics that must be overcome include selection of the best nanoparticles (nontoxic or biodegraded into nontoxic byproducts), development of an ideal fabrication procedure with less step, higher reproducibility, lower cost, improvement of drug loading efficiency, controlled drug release and imaging guidance [Citation2].
Metal nanoparticles as theranostic nanoparticles have advantages over other nanoparticles due to their biocompatibility in nature and easy excretion from the body. The surface of metal nanoparticles can modify to target cancer cells. Furthermore, therapeutic components can also encapsulate or conjugate with metal nanoparticles and imaging agents such as fluorescent dye, radioisotopes and optical imaging agents can attach for imaging [Citation3]. Titanium dioxide or titania nanoparticles (TiO2 NPs), well-known functional metal nanoparticles, due to their unique photocatalytic properties, excellent biocompatibility, high stability and low cost have been investigated for diverse biomedical applications [Citation4]. Up to now, the efficacy of TiO2 NPs has been studied for delivery of various anticancer drugs [Citation5,Citation6]. However, the techniques to fluorescently labelled TiO2 NPs are limited and come with several challenges including: small fluorescent yield, non-specific and high cost [Citation7].
In this study, we prepared novel titania nanoparticles with inherent fluorescence property using a one-step green and inexpensive method. DOX as a therapeutic agent was loaded on the fluorescent titania nanoparticles to form nanocomposite of DOX/FTN. FTN exhibited ultra-high loading capacity and pH-sensitive release of DOX. The anticancer efficacy of nanocomposite was studied on human osteosarcoma SaOs-2 and human breast cancer MCF-7 cell lines. The internalization of samples into the cancer cells was examined using fluorescence microscopy after 4 and 24 h of incubation. The antibacterial activity of nanoparticles was also studied against Escherichai coli ATCC 25922 and Staphylococcus aureus ATCC 25923.
Materials and method
Preparation of Vibrio CLS
The isolated luminescent Vibrio sp. VLA was inoculated in sterile sea water complete medium (SWC, 2.4% w/v sea salt, 0.5% w/v peptone, 0.3% w/v yeast extract and 0.3% v/v glycerol) and incubated for 16 h at 28 °C. The cell lysate supernatant (CLS) was obtained using previous method [Citation8] with slight modification. Briefly, the bacterial medium was separated using centrifugation, the bacterial cells (pellet) were resuspended in sterile distilled water (SDW), vortexed gently and sonicated for 10 min to lyse. Thereafter, the suspension was centrifuged and the supernatant containing bacterial biomolecules was named CLS and used for nanoparticles preparation.
Preparation, separation and purification of nanoparticles
For the preparation of nanoparticles, 50 mL of titanyl hydroxide solution (TiO(OH)2, 25 mM) was added to 100 mL of CLS and incubated in a water bath at 100 °C for 15 min. The reaction mixture was cooled and incubated at room temperature overnight. The resultant precipitate was separated from the solution by centrifugation at 8000 rpm for 20 min, washed several times with SDW, afterward dried by freeze dryer (Christ, Germany) and named fluorescent titania nanoparticles (FTN). Two negative controls were used with the similar experimental condition including TiO(OH)2 with SDW (1:2) and the CLS with SDW (2:1). A part of the FTN was purified by heating in an oven at 450 °C for 3 h and named heated titania nanoparticles (HTN). The two prepared samples were characterized to compare their properties.
Preparation of nanocomposite
For typical drug loading experiment, 2 mL of aqueous solution of doxorubicin hydrochloride (DOX, 2 mg/mL, Korea United Pharm, Korea) was added dropwise to 1 mL aqueous suspension of FTN (10 mg/mL). The reaction mixture was incubated at 30 °C in the dark and the absorbance of the supernatant was measured at 480 nm by UV–visible spectrophotometer S2100 (Unico, Germany) at the specified time interval. The nanocomposite was separated using centrifugation (5000 rpm for 10 min), washed repeatedly with PBS (pH 7.4), dried using freeze-dryer and named DOX/FTN.
Characterization of the samples
The X-ray diffraction (XRD) patterns were obtained by Bragg–Brentano geometry using D8-Advance (Bruker, Germany) diffractometer for the range 10° ≤ 2θ ≤ 80° with a step size of 0.04° per second. The Fourier transform infrared spectroscopy (FT-IR) spectra of the samples were recorded on AVATAR 370 FT-IR spectrophotometer (Nicolet Avatar, Madison, WI, USA) using the KBr pellet method in the range of 400–4000 cm−1. The UV–visible spectra of the samples were obtained on Unico UV-2100 spectrophotometer (Agilent, Palo Alto, CA, USA) in the range of 200–700 nm. FTN and HTN samples were visualized using field emission scanning electron microscopy (FE-SEM) on Mira 3-XMU FE-SEM (TESCAN, Brno, Czech Republic) with energy dispersive X-ray spectrometer (EDS). The AFM images were taken by an AFM 0101/A instrument in the tapping mode (Ara Pajoohesh, Tehran, Iran). The zeta potential was performed with zeta compact (CAD, Les Essarts-le-Roi, France) at pH 6.
Protein assay
The Bradford protein assay is one of the popular spectroscopic analytical procedure used to measure the quantity of protein in a solution [Citation9]. First, a standard curve of bovine serum albumin (BSA, Sigma Aldrich, St Louis, MO, USA) as a reference protein, was obtained by plotting the absorbance value versus different concentrations. For this purpose, Bradford reagent (1 mL) was added to the suspension of different concentrations of the BSA (50–400 μg/mL), incubated at room temperature for 5 min. The absorption of the samples was recorded with UNICO S2100 UV spectrophotometer (Unico, Shanghai, China) at 595 nm. The different concentrations of the FTN (1 and 2 mg/mL) were analogously treated and the relevant protein concentration was determined by extrapolation of the standard curve. The HTN was used as a negative control. The fluorescence/photoluminescence spectra of both samples were recorded on RF-1501 spectrofluorophotometer (Shimadzu, Kyoto, Japan). The activity of the luciferase enzyme was investigated using decanal as an aldehyde [Citation10]. For this purpose, the prepared decanal suspension (5 μL) was added to the suspension of samples (50 μL, 4 mg/mL) and the amount of emitted light was measured at interval 10 min using luminometer FB12 (Berthold, Bad Wildbad, Germany). The HTN was considered as a control.
Antibacterial activity
The antibacterial activity of the samples (FTN and HTN) with different concentrations (0–1000 μg/mL) was evaluated against gram-negative E. coli ATCC 25922 and gram-positive S. aureus ATCC 25923 strains regarding the minimum inhibitory concentration (MIC) using a broth microdilution method followed by the CLSI guidelines [Citation11]. MIC, defined as the lowest concentration of the nanoparticles, inhibits the growth of the bacteria with no significant increases [Citation12]. In general, 10 μL of each bacterial suspension (108 CFU/mL) was added to each well containing 100 μL growth medium with varying nanoparticles concentration. The positive control (well containing inoculum and medium, devoid of nanoparticles), the negative control (well containing the different concentration of nanoparticles and medium, devoid of inoculum) and blank control (well containing medium) were also considered in comparison. The microplates were incubated at 37 °C and the optical density (OD) at 630 nm was recorded after 20 h using ELIZA microplate reader ELX 800 (BioTeck, Winooski, VT, USA). The percentage of bacterial survival was determined by EquationEquation (1)(1)
(1)
(1)
(1)
where A is absorbance of the test well, B is blank, C is the negative control and D is a positive control. The minimum bactericidal concentration (MBC), the lowest concentration of nanoparticles that kills the bacteria [Citation13], was also determined by subculturing 10 μL of each overnight well to nutrient agar (Quelab, Montreal, QC, Canada) plates that incubated at 37 °C for 24 h.
The growth of E. coli and S. aureus was investigated in the presence and absence of different concentrations of the samples. The bacterial strains were cultured in nutrient broth medium (Quelab, Montreal, QC, Canada) and incubated at 37 °C for 18 h. After overnight incubation, 100 μL of bacterial suspension was inoculated to 10 mL fresh nutrient medium further incubated for 4 h in 37 °C. Then, the turbidity of the bacterial suspension was adjusted to 0.5 McFarland (108 CFU/mL) and 10 µL of such bacterial culture was inoculated into each wells containing 100 µL of growth medium with varied concentration of the samples (the cell density was ∼105 CFU/well). The negative and positive controls were used as mentioned before. The microplates were incubated at 37 °C and the OD at 630 nm was recorded at the interval of 2 h by ELIZA microplate reader.
Characterization of bacterial morphology
In order to study the modification of bacterial structure after treatment with nanoparticles, E. coli (106 CFU/mL, 300 μL) was inoculated to growth medium containing FTN (100 μg/mL, 3 mL) and incubated at 37 °C for 1 h. Then, the diluted suspension (1:1000) was deposited on mica substrates, dried at room temperature and investigated by AFM. The E. coli suspension without nanoparticles was used as a control.
DOX loading on FTN
The nanocomposite was separated from free DOX using centrifugation and the optical density of residual DOX (unbounded) in the supernatant was measured at 480 nm by UV–visible spectrophotometer S2100 (Unico, Shanghai, China) [Citation14]. The concentration of DOX was calculated from the DOX calibration curve that was performed at 480 nm. Drug loading efficiency was expressed as drug encapsulation efficiency (%, w/w) and drug loading content (%, w/w) calculated from EquationEquations (2)(2)
(2) and Equation(3)
(3)
(3)
(2)
(2)
(3)
(3)
pH-dependent drug release
The release behaviour of DOX was investigated at pH 7.4 (physiological condition in the blood) and 4.5 (environmental condition around cancer cells) by UV–visible spectroscopy method [Citation15]. Briefly, 1 mg/mL of DOX/FTN was dispersed in PBS with different pH and kept in the dark at 37 °C. At predetermined time intervals, supernatants were collected and the absorptions were measured at 480 nm. The amount of released DOX from the nanoparticles was calculated according to a calibration curve of DOX.
In vitro anticancer effect
The cytotoxicity of the FTN, DOX and DOX/FTN was studied on the human SaOs-2 osteosarcoma and human breast cancer MCF-7 cell lines by MTT assay [Citation16]. The cancer cells were cultured in advanced RPMI 1640 (Roswell Park Memorial Institute, Biosera, France) medium supplemented with 10% fetal bovine serum (FBS, Gibco BRL, Paisley, Scotland), 100 g/mL streptomycin and 100 U/mL penicillin (Biosera, Boussens, France) at 37 °C. in humidified air with 5% CO2. Cell number and viability were assessed using the abilities of the cells to exclude trypan blue. The density of 104 cells/well was seeded into 96-well microplates and incubated at 37 °C. in humidified air with 5% CO2 for 24 h. The growth medium was then replaced with 200 μL of the fresh medium containing DOX and DOX/FTN in which the DOX concentration was 0, 0.12, 0.25, 0.5 and 1 μg/mL. Followed by incubation for 24 h, 15 μL of MTT (3-(4,5-dimethylthiazol-2-yl)-2,5-diphenyl-tetrazolium bromide) solution (5 mg/mL, Sigma Aldrich, St Louis, MO, USA) was added to each well and incubated for additional 4 h. Then, the MTT solution was removed and 150 μL dimethyl sulfoxide (DMSO, Merck, Darmstadt, Germany) was added to solubilize the formazan crystals. The optical density was recorded at 570 nm using multi-well ELX 800 spectrophotometer reader (BioTeck, Winooski, VT, USA). Untreated cells were used as the control. The cells were also treated with FTN at the concentration of 0, 25, 50, 100 and 125 μg/mL to evaluate cytotoxicity. The cell viability fraction was calculated as follow (EquationEquation (4))(4)
(4)
(4)
(4)
Cellular uptake and intracellular imaging using fluorescence microscopy
For tracing and scanning of FTN, free DOX and DOX/FTN intracellularly, the SaOs-2 cell line was seeded at the density of 104 cells/well into 96-well microplates and incubated at 37 °C in humidified air with 5% CO2 for 24 h. Then, the growth medium was replaced with fresh medium containing FTN (1 μg/mL), free DOX (0.829 μg/mL) and DOX/FTN (0.283 μg/mL), incubated for 4 and 24 h. The treated cells were trypsinized, centrifuged, washed with PBS (pH 7.4), resuspended in 100 μL PBS and visualized on an Olympus BX 51 fluorescence microscope (Olympus, Japan). Hoechst 33342 (Tocris Cookson, Bristol, UK) was used for staining the nucleus.
Statistical analysis
All samples were tested in triplet for each experiment. The quantitative data were expressed as the means ± standard deviation (SD). The experimental data were analyzed using ANOVA one-way analysis of variance and Tukey’s post hoc test, values of p ≤ .05 were considered significant, and significant differences were shown by asterisks (*p < .05 and ****p < .0001).
Results
Characterization
The XRD patterns of FTN and HTN () showed diffraction peaks assigned to the planes (1 0 1), (0 0 4), (2 0 0), (1 0 5), (2 1 1), (2 0 4), (2 2 0) and (2 1 5) that were consistent with the standard TiO2 powder diffraction reported from the XRD library code 04-0477. No spurious peaks were detected in XRD patterns of our prepared nanoparticles which indicated the formation of high purity of anatase phase. The FT-IR spectra of FTN and HTN () showed a broad peak at wavenumber less than 600 cm−1 corresponded to Ti–O–Ti stretching vibration modes [Citation17]. The significant peaks of FTN spectrum were similar to CLS spectrum. The bands at 2923 and 1534 cm−1 attributed to O–H stretching of carboxylic acid and N-H bending of amide, respectively. The bands at 1221 and 1072 cm−1 corresponded to C-N and N–H stretching, respectively [Citation18,Citation19]. These results revealed that presented bacterial biomolecules in the CLS played an important role in the bioreduction of FTN. These peaks were disappeared after heating at 450 °C. because of removal biomolecules (HTN). shows the zeta potential, ζ potential, of the samples. The low negative zeta potential of FTN (−10.01 mV) compared to HTN (−24.90 mV) is most probably related to the presence of amino groups of proteins at the surface of FTN, which were eliminated by heating and caused negative zeta potential of HTN. The UV–visible spectra () showed that prepared nanoparticles had the absorption edges in the visible region and their calculated energy band gap using Tauc/David-Mott model [Citation20], Eg, were less than that of bulk anatase TiO2 (Eg= 3.2 eV) (insect ).
Figure 1. Characterization of the samples. (A) XRD patterns of FTN, HTN and DOX/FTN. Three additional peaks in the XRD pattern of DOX/FTN (D1, D2 and D3) attributed to doxorubicin hydrochloride. (B) FT-IR spectra of CLS, FTN, HTN, DOX and DOX/FTN. The resemblance of FTN spectrum with CLS spectrum indicate that bacterial biomolecules exist on FTN. While there were disappeared for HTN due to removal of bacterial biomolecules by heating. The FT-IR spectrum of DOX/FTN also shows characteristic peaks of DOX. (C) Zeta potential of FTN, HTN, DOX and DOX/FTN. (D) UV–visible spectra of FTN, HTN, DOX and DOX/FTN. Insect picture shows energy band gap values of nanoparticles corresponding Tauc plots.
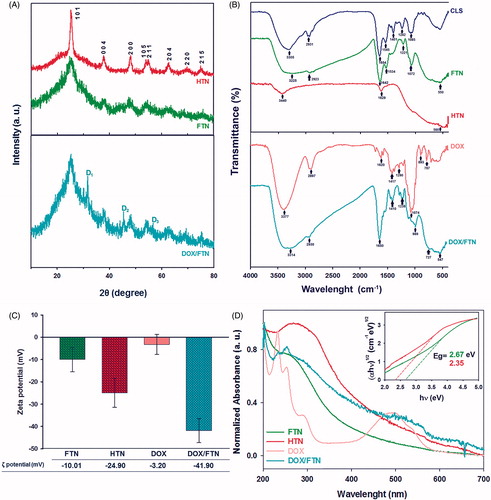
The XRD pattern of DOX/FTN () showed three extra peaks corresponding to (2 0 0), (2 2 0) and (2 2 2) lattice planes of DOX [Citation21]. The FT-IR spectrum of DOX/FTN () indicated the bands which were attributed to DOX [Citation22,Citation23]. The resemblance of the bands corresponding to DOX with DOX/FTN confirms the presence of drug in the nanocomposite. The successful loading of DOX onto the FTN was also supported by the change in the zeta potential of FTN (). The UV–visible spectrum of DOX indicated a characteristic peak at 480 nm which reduced for DOX/FTN (), further confirmed the successful binding of DOX with the nanoparticles.
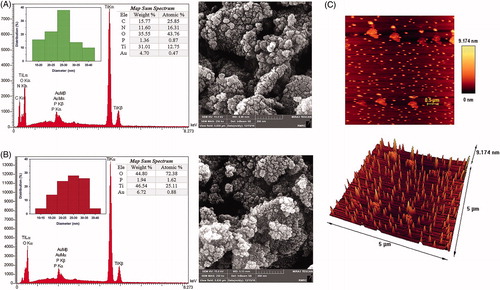
The FE-SEM images () showed that nanoparticles have spherical morphology which was further confirmed by AFM (). The PSD (particle size distribution) plots were obtained by determining the size of 50 particles for each samples (using Digimizer 4.0, MedCalc Software, Belgium). The average particles size was <30 nm for both samples. The EDS analysis showed the distinct peaks for Ti and oxygen elements with an atomic percent of 12.75% (25.11%) and 43.76% (72.38%), respectively for FTN (HTN). The Au peak was originated from the gold coating of the samples for obtaining images. The C and N peaks with an atomic percent of 25.85% and 16.31%, respectively, were observed for FTN which could be related to the presence of flavin mononucleotide (FMN) and/or bacterial enzymes. These peaks did not exist for HTN.
Figure 2. The FE-SEM micrograph, EDS, PSD plot and map sup spectrum of (A) FTN and (B) HTN. The micrographs show spherical morphologies of nanoparticles and the average particle size was less than 30 nm for both samples. The EDS analysis shows Ti and oxygen elements for both samples. While the C and N peaks observed for FTN corresponded to FMN/or bacterial enzymes. The Au peak corresponds to the gold coating of the samples for imaging. The scale bar is 200 nm. (C) The 2D and 3D AFM images of FTN.
As can be inferred from the results, FTN was surrounded by bacterial enzymes. The immobilization of bacterial enzymes over FTN was also confirmed by the Bradford protein assay. The Bradford reagent in the presence of FTN converted to its blue form (insect ), while no change in colour was observed in the presence of HTN. The amount of protein loaded onto 1 and 2 mg/mL of FTN was calculated by extrapolation of the BSA standard curve () which was 146 μg/mL for former and 260 μg/mL for latter, respectively. It was shown that by increasing nanoparticles concentration, enzyme concentration was also increased. The existence of luciferase was studied through investigating its activity in the presence of decanal (). FTN suspension emitted light up to 4000 RLU/s while it was zero for HTN suspension in the presence of decanal.
Figure 3. Protein quantification. (A) The standard curve of BSA by using Bradford protein assay. Dash arrows indicate the determined amount of protein on different concentration of FTN (1 and 2 mg/mL). The insect picture shows the colour of Bradford reagent (BR) in the absence and presence of FTN suspension. BR in the presence of FTN converted to its blue form. (B) The luciferase activity assay. FTN suspension after adding decanal produce measurable light about 4000 RLU/s, most probably due to existence of luciferase enzyme. Insect picture shows FTN after adding decanal emitted blue-green light under UV irradiation at 254 nm. While, it did not observe for HTN. (C) The fluorescence/photoluminescence emission spectra of FTN and HTN (λ excitation is 350 nm). There are two extra peaks at 520 and 530 nm of FTN spectrum corresponded to FMN. The insect pictures show (a) fluorescence microscopy image of FTN and (b) the suspension of FTN under UV lamp at 365 nm.
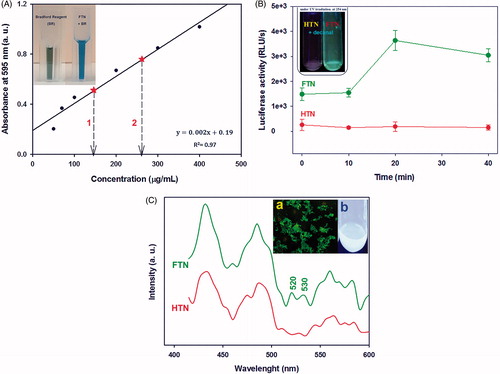
The fluorescence/photoluminescence (FL/PL) emission spectra of both nanoparticles () showed three maximum peaks at 430, 490 and 560 nm which belonged to the existence of excitons and defect levels below the conduction band of TiO2 NPs [Citation24]. Furthermore, it was observed some additional peaks at 520 and 530 in FTN spectrum which may be attributed to FMN [Citation25]. Moreover, FTN exhibited green fluorescence signal under fluorescence microscopy and its suspension was shining under UV irradiation at 365 nm (insect ) which is most probably due to the presence of FMN on the surface of nanoparticles, while HTN did not show these properties.
Antibacterial activity
shows the antibacterial activity of FTN and HTN against E. coli and S. aureus strains. The results showed that FTN and HTN had antibacterial activity and the viability of both strains decreased with increasing nanoparticles concentrations. Titania nanoparticles bactericidal mechanism has been known to be most related to the generation of reactive oxygen species (ROS) such as hydroxyl radical (·OH) which leads to membrane phospholipid peroxidation and ultimately cell death [Citation26]. When E. coli and S. aureus were treated with 31.2 μg/mL of FTN, more than 50% of both bacterial cells were destroyed while about 10% of both bacterial cells were killed at the same concentration of HTN. The MIC values of FTN and HTN were obtained 62.5 (62.5) μg/mL and 250 (250) μg/mL for E. coli (S. aureus), respectively. The MBC values were also determined by subculturing MIC wells onto nutrient agar medium and obtained 62.5 (62.5) μg/mL and 250 (500) μg/mL for FTN and HTN, respectively against E. coli (S. aureus).
Figure 4. The antibacterial activity of nanoparticles. (A) The percent viability of bacteria at different concentration of FTN and HTN. The antibacterial of nanoparticles was dose-dependent. (B) the growth curve of Escherichia coli and (C) Staphylococcus aureus treated with different concentration of nanoparticles. (D) The 3-D AFM images of E. coli treated with (a) 0 μg/mL (control) and (b) 100 μg/mL of FTN. Control bacterial cell was viable with no observed membrane damage. While, at 100 μg/mL of nanoparticles, several membrane disruption were observed.
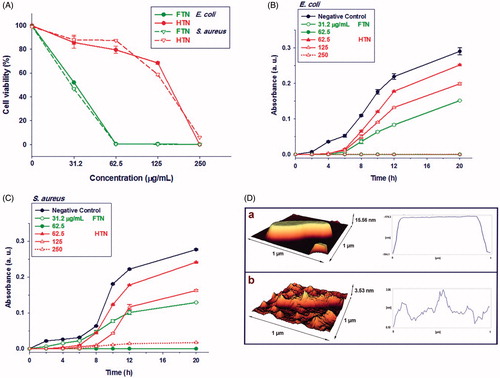
The growth profile of E. coli and S. aureus strains in the presence of varying concentration of FTN and HTN was also investigated (). The Delay in Lag phase was observed for both bacterial strains on exposure to the different concentration of nanoparticles. In general, it was found that growth inhibition of both bacterial strains was dose-dependent as by increasing nanoparticles concentration the bacterial growth decreased.
The surface structures of both FTN treated and untreated bacterial cells were examined using AFM (). FTN binding to the bacterial surface caused severe damage on cell membrane most probably because of ROS production. ROS disturbs membrane integrity by peroxidation of phospholipids leading to leakage of minerals, proteins and genetic materials ending with cell death [Citation27].
Loading and release of DOX
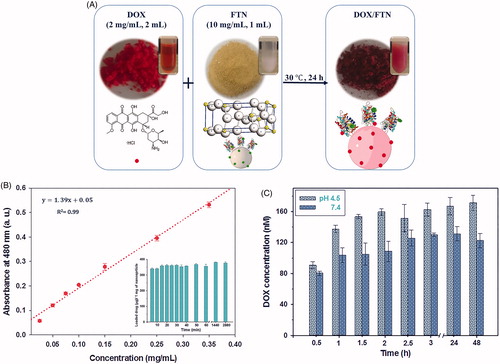
The general procedure used for fabrication of the nanocomposite, DOX/FTN, is illustrated in . The colour of FTN changed from light yellow to dark red due to DOX adsorption. The characterization results also confirmed successful loading of DOX on FTN. The encapsulation efficiency and loading content of DOX/FTN were calculated as 95.50 ± 0.75% and 38.20 ± 0.30%, respectively. Furthermore, the amount of DOX loaded on the surface of nanoparticles was calculated from the calibration curve of DOX () and it was about 380 μg per 1 mg of nanoparticles after 24 h (insect ). The release pattern of DOX from FTN was examined by incubating DOX/FTN in different pH (7.4 and 4.5), and the amount of released DOX into PBS was calculated. The release profile of DOX was pH-dependent and a great amount of DOX was released in the acidic PBS ().
Figure 5. DOX loading and release profile. (A) Schematic illustration for fabrication of DOX/FTN. DOX as an anticancer drug was added dropwise to the prepared theranostic nanocarrier (FTN) and the mixture was incubated at 30 °C for 24 h. The colour of FTN was changed due to the absorption of DOX. (B) The calibration curve of DOX at 480 nm. The insect histogram shows the amount of loaded DOX per 1 mg of FTN versus time. The maximum DOX loading occurred at the beginning time of exposure to FTN. (C) pH-dependent release profile of DOX from FTN in PBS at different pH value.
In vitro anticancer effect
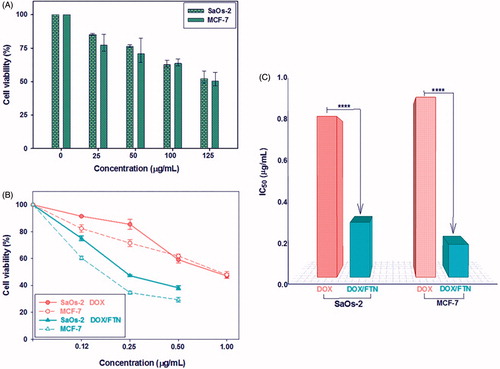
About 50% of both cancer cell types were remained viable at a high FTN concentration (125 μg/mL) () indicating that FTN is nontoxic in the ranges used for drug delivery. Also MTT assay were used for studying the anticancer properties of low concentrations (0–1 μg/mL) of free DOX and DOX/FTN against SaOs-2 and MCF-7 cell lines. The results showed the dose-dependent cytotoxicity of free DOX and DOX/FTN as higher mortality observed with increased concentration (). Furthermore, DOX/FTN exhibited a higher anticancer effect than free DOX. The IC50 values, the concentration that inhibits the 50% of cells growth, were determined using GraphPad Prism 6 software (GraphPad Software, La Jolla, CA, USA). The IC50 value of DOX when loaded on FTN decreased to 0.283 μg/mL and 0.169 μg/mL for SaOs-2 cells (IC50 ∼ 0.829 μg/mL) and MCF-7 cells (IC50 ∼ 0.928 μg/mL), respectively ().
Figure 6. In vitro cytotoxicity evaluation of FTN, free DOX and DOX/FTN on SaOs-2 and MCF-7 cancer cell lines after 24 h using MTT assay. (A) The effect of FTN at different concentration (0–125 μg/mL) on the viability of cancer cells. It shows that the cell viability is more than 50% even at the high concentration of FTN (125 μg/mL), indicating their biocompatibility. (B) Anticancer efficiency of free DOX (circle symbols) and DOX/FTN (triangle symbols) at different concentration in which the DOX concentration is 0, 0.12, 0.25, 0.50 and 1 μg/mL. (C) The IC50 values of free DOX and DOX/FTN for SaOs-2 and MCF-7 cells indicate the superior anticancer efficiency of DOX/FTN. ****p < 0.0001 compared with free DOX.
Cellular uptake and intracellular imaging
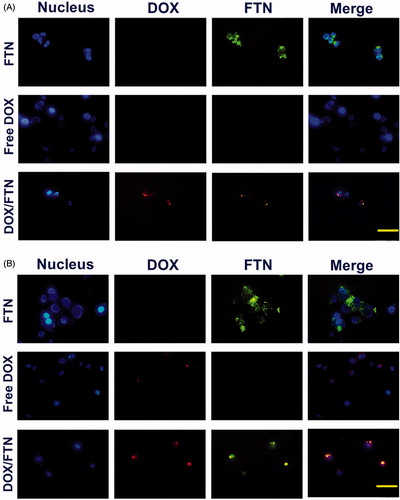
The fluorescence microscopy analysis of SaOS-2 cell treated with FTN, free DOX and DOX/FTN for 4 and 24 h was performed to examine the cellular uptake via fluorescence signals (). The fluorescence signal from FTN, DOX and Hoechst were green, red and blue, respectively. The images of treated cells with FTN showed strong green emitting after 4 and 24 h which indicated the rapid internalization of nanoparticles into the cells. For treated cells with free DOX, no (limited) fluorescence signal was observed within 4 h (24 h), indicating no or little uptake of free DOX. While, the DOX fluorescence signal was observed in the treated cells with nanocomposite after 4 and 24 h incubation.
Figure 7. Cellular uptake study and imaging using fluorescence microscopy. The fluorescence microscopy images of SaOs-2 cells treated with FTN, free DOX and DOX/FTN after (A) 4 h and (B) 24 h of incubation. The nucleus is stained with Hoechst 33342. Despite the used amount of DOX/FTN were about three fold lower than free DOX, but it has strong fluorescence signal relative to free DOX. It was related to fluorescence property of FTN. The scale bar is 10 μm.
Discussion
Recently numerous types of theranostic nanoparticles have been developed [Citation28]. In this study, the novel biogenic fluorescent titania nanoparticles were fabricated in a one-step green approach using isolated luminescent Vibrio sp. VLA and its potential applications as antibacterial and cancer theranostic agents were studied.
The biosynthesis of titania nanoparticles has been performed using various bacteria [Citation19,Citation29]. However, to the best of our knowledge, there is not any report that indicated the application of luminescent bacteria in TiO2 NPs production. Beside Au NPs and Se NPs biosynthesis using naturally occurring and genetically engineered luminescent bacteria have been recently achieved in which enzymes stabilized on nanoparticles were recognized as the most predictive agents in nanoparticles biosynthesis [Citation30,Citation31]. In this study, comparison of FTN and HTN characteristics revealed that luciferase enzyme with cofactor FMN as one of the important and most abundant luminescent Vibrio agents are present on nanoparticles surface and bring unique properties.
The prepared titania nanoparticles (FTN and HTN) influenced both gram-negative and gram-positive bacteria lethally without requirement of UV light (in dark condition) mostly because both FTN and HTN energy band gap lied in visible light energy ranges (1.55–3.10 eV). Although many studies have been devoted to antibacterial activity of TiO2 NPs, no certain reasons have been explained about their toxicity on bacteria in dark (where no UV irradiation present). Meanwhile, some researchers reported that the bacterial death can occur in the dark condition [Citation32], while others found that TiO2 NPs were harmless under such condition [Citation33]. However, enhancement of bacterial inactivation by TiO2 NPs under UV irradiation has been widely accepted [Citation34]. When TiO2 NPs are irradiated with light of energy greater than or equal to their band gap, electron–hole pairs are generated, induce redox reaction with water at nanoparticles surface and release the hydroxyl radical with subsequent formation of superoxide ions. In addition, hydrogen peroxide and singlet oxygen generation may occur. These types of ROS synergistically act by attacking polyunsaturated phospholipids leading to increased permeability of cell membrane and leaking out vital cell components which finally cause bacterial death [Citation35]. Leung and his coworker [Citation27] investigated the antibacterial activity of TiO2 NPs on E. coli by scanning electron microscopy (SEM). Their results showed that TiO2 NPs attached to bacteria followed by causing holes in their cell membrane and collapsing due to leakage of content. They also expressed that cell membrane damage is attributed to the ROS generation. Similarly but in a classified manner Sundrarajan et al. [Citation36] suggested several mechanism for antimicrobial activity of TiO2 NPs including: (i) small size, (ii) large active surface area, (iii) bacterial cell wall structure, (iv) release of Ti4+ ions from TiO2, (v) the generation of hydrogen peroxide and (vi) reactive oxygen species (ROS) at the surface of TiO2 NPs. In overall the antibacterial mechanism of TiO2 NPs are mostly attributed to the decomposition of bacterial outer membranes by ROS which leads to cell death.
The nanoparticles surface electrical charge is another significant factor that affects nanoparticles antibacterial activity [Citation37]. Positively charged nanoparticles have better bactericidal activity than negative ones as they can attach more efficiently to the negatively charged bacterial cell wall. Both gram-negative and gram-positive bacteria surface are negatively charged due to the presence of lipoteichoic acid (in gram-positive) and lipopolysaccharide (in gram-negative) [Citation38]. Results of our study also clearly showed that FTN with less negatively charge had better bactericidal activity than negatively charged HTN.
The MIC of our prepared titania nanoparticles was very close to Durairasu and his coworkers [Citation39] and Ahmad and his coworkers [Citation32] MIC values. Durairasu and his coworkers fabricated TiO2 NPs by bacteriologically mediated method using Staphylococcus arlettae and found MIC value of 150 μg/mL for both gram-negative and gram-positive bacteria. Also, TiO2 NPs with average particle size of 25–50 nm biosynthesized using alpha amylase enzyme in Ahmad and his workers’ study had MIC value of 62.5 μg/mL for both E. coli and S. aureus. According to the MBC and growth curve results, the HTN showed a higher antibacterial activity against gram-negative (E. coli) than gram-positive (S. aureus) bacteria. The less susceptibility of S. aureus might be related to its thick peptidoglycan layer (20–80 nm) compared to thin layer of E. coli (5–10 nm) [Citation40] which may protect formation of pits by ROS [Citation34].
The FTN had ultra-high loading efficiency of DOX that seems quite significant relative to previous reports [Citation6,Citation14,Citation41]. DOX has an amino and several hydroxyl groups [Citation42] which can form hydrogen-bonding interactions with the existing functional groups of the FTN (OH and NH bond, referred to FT-IR analysis). This could be a reason for higher loading of DOX on FTN.
The pH-dependent release behaviour of DOX from FTN can be explained by hydrogen-bonding interaction between DOX and FTN. At acidic condition, the hydrogen-bonding interaction between DOX and nanocarrier is partially dissociated while it is strong at the neutral condition, resulting in more DOX release at acidic pH surrounding the tumour site or inside the endosome and lysosome of tumour cells [Citation43]. Inefficient release in physiological condition suggesting the minimize release of cytotoxic DOX during blood circulation which greatly reduces the side effects to normal tissue [Citation44].
The cytotoxicity of FTN was dose-dependent as by increasing nanoparticles concentration the cytotoxicity increased. However, FTN was nontoxic at the ranges used for drug delivery. The cytotoxicity of TiO2 NPs is related to oxidative stress by production of ROS. Excessive generation of ROS is potentially toxic to cells because of their ability to oxidize a range of biomolecules which play an important role in maintaining cellular redox homeostasis through its antioxidant effects [Citation45]. This might be one of the potential mechanisms of ROS mediated cytotoxicity of FTN. Murugan et al. [Citation46] investigated the induction of apoptosis as a possible mechanism for anti-proliferative activity of TiO2 NPs. They also reported low toxicity of TiO2 NPs on normal cells relative to cancer cells. Wei et al. [Citation4] showed that the anticancer activity of TiO2 NPs was dose-dependent and by increasing nanoparticles concentration the activity increased. They found that TiO2 NPs have anticancer effect on osteosarcoma cells through ROS generation which induce cancer cells apoptosis. They also exhibited that the ROS generation could damage the mitochondrial membrane resulting in releases of cytochrome C into cytoplasm inducing the cell apoptosis by beginning of the intrinsic pathway.
Our prepared nanocomposite (DOX/FTN) showed higher anticancer efficiency than free DOX that could be related to the rapid and effective internalization of DOX/FTN into cancer cells (refer ) and also non-covalently bonding of DOX with FTN. It has been reported that cellular uptake of free DOX was mediated by a passive diffusion, while the internalization of DOX-loaded nanoparticles involved an endocytosis mechanism [Citation47]. The endocytosis leading to increase accumulation of drug into cells compared to passive diffusion [Citation48]. The drug loading mode (non-covalent complexation or covalent conjugation) was also reported as a crucial factor which influences therapeutic efficiency, so that the non-covalently loaded DOX to nanoparticles exhibited significantly higher cytotoxicity than covalently conjugated DOX [Citation47].
Moreover, the fluorescence property of FTN caused the intracellular tracking of DOX/FTN via fluorescence microscopy. These phenomena corresponded with Wu and his coworker's observations [Citation49]. They functionalized chemically synthesized mesoporous TiO2 NPs (with particle size around 350 nm) with a phosphate-containing fluorescent molecule and loaded them with DOX for intracellular imaging and drug delivery. The fluorescently labelled TiO2 NPs are primarily depend on use of Alizarin Red S [Citation50]. Although this fluorescent molecule binds well to the TiO2 NPs surface, but its fluorescent yield is small. Other labelling approach to stain TiO2 NPs are complicate and come with challenges [Citation7].
Overall, the presented fluorescent titania nanoparticles are biogenic, biocompatible, stable, inexpensive and have antibacterial and cancer theranostics activities.
Conclusions
We could successfully prepare multifunctional titania nanoparticles by a cheap and rapid green method. The MIC value indicated an efficient bactericidal activity of nanoparticles against both gram-negative and gram-positives bacteria without requirement of UV irradiations. Moreover, the good biocompatibility, high drug loading efficiency, pH-dependent drug release, enhancement anticancer efficacy and imaging abilities may cause our fabricated titania nanoparticles to be considered as an appropriate candidate for in vivo cancer studies.
Disclosure statement
No potential conflict of interest was reported by the authors.
Additional information
Funding
Related Research Data
References
- Yi Y, Lin G, Chen S, et al. Polyester micelles for drug delivery and cancer theranostics: Current achievements, progresses and future perspectives. Mater Sci Eng C. 2017;83:218–232.
- Ma Y, Huang J, Song S, et al. Cancer‐targeted nanotheranostics: recent advances and perspectives. Small. 2016;12:4936–4954.
- Sharma H, Mishra PK, Talegaonkar S, et al. Metal nanoparticles: a theranostic nanotool against cancer. Drug Discov Today. 2015;20:1143–1151.
- Ai J-W, Liu B, Liu W-D. Folic acid-tagged titanium dioxide nanoparticles for enhanced anticancer effect in osteosarcoma cells. Mater Sci Eng C. 2017;76:1181–1187.
- Bakhshizadeh M, Sazgarnia A, Seifi M, et al. TiO2-based mitoxantrone imprinted poly(methacrylic acid-co-polycaprolctone diacrylate) nanoparticles as a drug delivery system. Curr Pharm Des. 2017;23:2685–2694.
- Chen Y, Wan Y, Wang Y, et al. Anticancer efficacy enhancement and attenuation of side effects of doxorubicin with titanium dioxide nanoparticles. Int J Nanomed. 2011;6:2321–2326.
- Brown K, Thurn T, Xin L, et al. Intracellular in situ labeling of TiO2 nanoparticles for fluorescence microscopy detection. Nano Res. 2017;11:464–476.
- Singh S, Vidyarthi AS, Nigam VK, et al. Extracellular facile biosynthesis, characterization and stability of gold nanoparticles by Bacillus licheniformis. Artif Cells Nanomed Biotechnol. 2014;42:6–12.
- Arokiyaraj S, Vincent S, Saravanan M, et al. Green synthesis of silver nanoparticles using Rheum palmatum root extract and their antibacterial activity against Staphylococcus aureus and Pseudomonas aeruginosa. Artif Cells Nanomed Biotechnol. 2017;45:372–379.
- Wiles S, Ferguson K, Stefanidou M, et al. Alternative luciferase for monitoring bacterial cells under adverse conditions. Appl Environ Microbiol. 2005;71:3427–3432.
- Jorgensen JH, Turnidge JD. Susceptibility test methods: dilution and disk diffusion methods. Manual of clinical microbiology. 11th ed. Washington (DC): American Society of Microbiology; 2015. p. 1253–1273 .
- Dehghanizade S, Arasteh J, Mirzaie A. Green synthesis of silver nanoparticles using Anthemis atropatana extract: characterization and in vitro biological activities. Artif Cells Nanomed Biotechnol. 2018;46:160–168.
- Adahoun MA, Al-Akhras M-AH, Jaafar MS, et al. Enhanced anti-cancer and antimicrobial activities of curcumin nanoparticles. Artif Cells Nanomed Biotechnol. 2017;45:98–107.
- Ren W, Iqbal MZ, Zeng L, et al. Black TiO2 based core–shell nanocomposites as doxorubicin carriers for thermal imaging guided synergistic therapy of breast cancer. Nanoscale. 2017;9:11195–11204.
- Timin AS, Balantseva EV, Khashirova SY, et al. Application of guanidine-containing polymers for preparation of pH responsive silica-based particles for drug delivery systems. Colloids Surf A. 2015;477:26–34.
- Meshkini A, Oveisi H. Methotrexate-F127 conjugated mesoporous zinc hydroxyapatite as an efficient drug delivery system for overcoming chemotherapy resistance in osteosarcoma cells. Colloids Surf B. 2017;158:319–330.
- Pu S, Zhu R, Ma H, et al. Facile in-situ design strategy to disperse TiO2 nanoparticles on graphene for the enhanced photocatalytic degradation of rhodamine 6G. Appl Catal B. 2017;218:208–219.
- Hunagund SM, Desai VR, Kadadevarmath JS, et al. Biogenic and chemogenic synthesis of TiO2 NPs via hydrothermal route and their antibacterial activities. RSC Adv. 2016;6:97438–97444.
- Jayaseelan C, Rahuman AA, Roopan SM, et al. Biological approach to synthesize TiO2 nanoparticles using Aeromonas hydrophila and its antibacterial activity. Spectrochim Acta Part A. 2013;107:82–89.
- Eng AYS, Sofer Z, Sedmidubsky´ D, et al. Synthesis of carboxylated-graphenes by the Kolbe–Schmitt process. ACS Nano. 2017;11:1789–1797.
- Manocha B, Margaritis A. Controlled release of doxorubicin from doxorubicin/γ-polyglutamic acid ionic complex. J Nanomater. 2010;2010:12.
- Liu S, Ko AC-T, Li W, et al. NIR initiated and pH sensitive single-wall carbon nanotubes for doxorubicin intracellular delivery. J Mater Chem B. 2014;2:1125–1135.
- Chouhan R, Bajpai A. Real time in vitro studies of doxorubicin release from PHEMA nanoparticles. J Nanobiotechnol. 2009;7:5–17.
- Xie C, Yang S, Shi J, et al. Highly crystallized C-doped mesoporous anatase TiO2 with visible light photocatalytic activity. Catalysts. 2016;6:117.
- Wehner T, Heck J, Feldmann C, et al. White light emission and temperature dependent chromaticity shifts by modification of luminescent ZrO (FMN) nanoparticles with rare earth halides. J Mater Chem C. 2016;4:7735–7743.
- Liu N, Chang Y, Feng Y, et al. {101}–{001} Surface heterojunction-enhanced antibacterial activity of titanium dioxide nanocrystals under sunlight irradiation. ACS Appl Mater Interfaces. 2017;9:5907–5915.
- Leung YH, Xu X, Ma AP, et al. Toxicity of ZnO and TiO2 to Escherichia coli cells. Sci Rep. 2016;6:35243.
- Chen F, Ehlerding EB, Cai W. Theranostic nanoparticles. J Nucl Med. 2014;55:1919–1922.
- Khan R, Fulekar M. Biosynthesis of titanium dioxide nanoparticles using Bacillus amyloliquefaciens culture and enhancement of its photocatalytic activity for the degradation of a sulfonated textile dye Reactive Red 31. J Colloid Interface Sci. 2016;475:184–191.
- Attaran N, Eshghi H, Rahimizadeh M, et al. Genetically modified luminescent bacteria Ralostonia solanacerum, Pseudomonas syringae, Pseudomonas savastanoi, and wild type bacterium Vibrio fischeri in biosynthesis of gold nanoparticles from gold chloride trihydrate. Artif Cells Nanomed Biotechnol. 2014;44:263–269.
- Hosseini M, Mashreghi M, Eshghi H. Biosynthesis and antibacterial activity of gold nanoparticles coated with reductase enzymes. Micro Nano Lett. 2016;11:484–489.
- Ahmad R, Mohsin M, Ahmad T, et al. Alpha amylase assisted synthesis of TiO2 nanoparticles: structural characterization and application as antibacterial agents. J Hazard Mater. 2015;283:171–177.
- Markowska-Szczupak A, Ulfig K, Morawski A. The application of titanium dioxide for deactivation of bioparticulates: an overview. Catal Today. 2011;169:249–257.
- Barnes RJ, Molina R, Xu J, et al. Comparison of TiO2 and ZnO nanoparticles for photocatalytic degradation of methylene blue and the correlated inactivation of gram-positive and gram-negative bacteria. J Nanopart Res. 2013;15:1432–1443.
- Besinis A, De Peralta T, Handy RD. The antibacterial effects of silver, titanium dioxide and silica dioxide nanoparticles compared to the dental disinfectant chlorhexidine on Streptococcus mutans using a suite of bioassays. Nanotoxicology. 2014;8:1–16.
- Sundrarajan M, Bama K, Bhavani M, et al. Obtaining titanium dioxide nanoparticles with spherical shape and antimicrobial properties using M. citrifolia leaves extract by hydrothermal method. J Photochem Photobiol B. 2017;171:117–124.
- Chang T-Y, Chen C-C, Cheng K-M, et al. Trimethyl chitosan-capped silver nanoparticles with positive surface charge: their catalytic activity and antibacterial spectrum including multidrug-resistant strains of Acinetobacter baumannii. Colloids Surf B. 2017;155:61–70.
- Feng ZV, Gunsolus IL, Qiu TA, et al. Impacts of gold nanoparticle charge and ligand type on surface binding and toxicity to gram-negative and Gram-positive bacteria. Chem Sci. 2015;6:5186–5196.
- Durairasu M, Indra V, Arunagirinathan N, et al. Antagonistic activity of biogenic TiO2 nanoparticles against Staphylococcus aureus and Escherichia coli. Int J Curr Microbiol Appl Sci. 2017;6:2485–2495.
- Alavi M, Karimi N. Characterization, antibacterial, total antioxidant, scavenging, reducing power and ion chelating activities of green synthesized silver, copper and titanium dioxide nanoparticles using Artemisia haussknechtii leaf extract. Artif Cells Nanomed Biotechnol. 2017 [Dec 12]; [16 p.]. DOI:10.1080/21691401.2017.1408121
- Ren W, Zeng L, Shen Z, et al. Enhanced doxorubicin transport to multidrug resistant breast cancer cells via TiO2 nanocarriers. RSC Adv. 2013;3:20855–20861.
- Choi J-S, Doh K-O, Kim B-K, et al. Synthesis of cholesteryl doxorubicin and its anticancer activity. Bioorg Med Chem Lett. 2017;27:723–728.
- Li L, Liu C, Zhang L, et al. Multifunctional magnetic–fluorescent eccentric-(concentric-Fe3 O4@SiO2)@ polyacrylic acid core–shell nanocomposites for cell imaging and pH-responsive drug delivery. Nanoscale. 2013;5:2249–2253.
- Madhusudhan A, Reddy GB, Venkatesham M, et al. Efficient pH dependent drug delivery to target cancer cells by gold nanoparticles capped with carboxymethyl chitosan. Int J Mol Sci. 2014;15:8216–8234.
- Ahamed M, Khan MM, Akhtar MJ, et al. Role of Zn doping in oxidative stress mediated cytotoxicity of TiO2 nanoparticles in human breast cancer MCF-7 cells. Sci Rep. 2016;6:30196.
- Murugan K, Dinesh D, Kavithaa K, et al. Hydrothermal synthesis of titanium dioxide nanoparticles: mosquitocidal potential and anticancer activity on human breast cancer cells (MCF-7). Parasitol Res. 2016;115:1085–1096.
- Qin Y, Sun L, Li X, et al. Highly water-dispersible TiO2 nanoparticles for doxorubicin delivery: effect of loading mode on therapeutic efficacy. J Mater Chem B. 2011;21:18003–18010.
- Elbaz NM, Ziko L, Siam R, et al. Core-shell silver/polymeric nanoparticles-based combinatorial therapy against breast cancer in-vitro. Sci Rep. 2016;6:30729.
- Wu KC-W, Yamauchi Y, Hong C-Y, et al. Biocompatible, surface functionalized mesoporous titania nanoparticles for intracellular imaging and anticancer drug delivery. ChemComm. 2011;47:5232–5234.
- Thurn KT, Arora H, Paunesku T, et al. Endocytosis of titanium dioxide nanoparticles in prostate cancer PC-3M cells. Nanomedicine. 2011;7:123–130.