
Abstract
Basic fibroblast growth factor (bFGF) has shown great therapeutic effects for diabetic nephropathy (DN). However, its clinical applications are limited due to its short half-life, low stability and poor penetration. Herein, a bFGF-loaded liposome (bFGF-lip) was constructed and combined with ultrasound-targeted microbubble destruction (UTMD) to overcome these drawbacks. bFGF-lip exhibited spherical morphology with a diameter of 171.1 ± 14.2 nm and a negative zeta potential of -5.15 ± 2.08 mV, exhibiting a sustained-release profile of bFGF. DN rat models were successfully induced by streptozotocin. After treatment with bFGF-lip + UTMD, the concentration of bFGF in kidney of DN rats was significantly enhanced in comparison with free bFGF treatment. Additionally, the morphology and the function of the kidneys were obviously recovered after bFGF-lip + UTMD treatment as shown by ultrasonography and histological analyse. The molecular mechanism was associated with the inhibition of renal inflammation. After treatment with bFGF-lip + UTMD, the activation of NF-κB was obviously reduced in the renal tissues, and downstream inflammatory mediators including TGF-β1, MCP-1, IL-6 and IL-1β were also down regulated. In addition, inflammation-induced cellular apoptosis of renal tubular cells was also significantly inhibited by detecting Bax, caspase-3 and Bcl-2. Therefore, bFGF-lip in combination with UTMD might be a potential strategy to reverse the progression of early DN.
Introduction
Diabetes, characterized by hyperglycaemia, is a metabolic disease with high morbidity and mortality around the world. Diabetic nephropathy (DN), which is caused by diabetes, is one of the major-“microvascular”-complications of diabetes mellitus and is a leading cause of chronic renal failure. Various signalling pathways of diabetic nephropathy are involved in the progression of diabetic nephropathy [Citation1], but the mechanisms of the development and progression of DN are not well known. At the present time, many studies have shown that DN is a chronic low-grade inflammatory response [Citation2]. In the development of DN, there is an obvious inflammatory reaction that promotes the progression of diabetic nephropathy [Citation3,Citation4], and controlling the inflammatory response is conducive to delaying the progression of DN [Citation5,Citation6]. There has been an observation that many common diseases, including diabetes, are associated with dysregulation of NF-κB [Citation7]. In addition, studies have found that regardless of the length of illness, the expression of NF-κB in DM patients was still abnormal, suggesting that NF-κB may play an important role in the development of diabetic nephropathy [Citation6,Citation8,Citation9]. It is known that nuclear transcription factor NF-κB is a cofactor that regulates inflammation [Citation7] and can be activated by a variety of factors, including hyperglycaemia, obesity, oxidative stress, increased plasma free fatty acids, proteinuria, cytokines, and growth factors [Citation10]. NF-κB is an important mediator of the release of pro-inflammatory mediators, such as MCP-1, IL-1β, IL-6, TGF-β1, and HMGB1 [Citation11,Citation12].
Glomerular podocytes, which are highly specialized and terminally differentiated cells, play a pivotal role in maintaining the glomerular filtration barrier function. Mature podocytes do not have the capacity for proliferation and the injury to these podocytes can result in continuous and irreversible albuminuria in DN patients [Citation13,Citation14]. The slit diaphragm (SD) of a podocyte is a specific membrane region on the podocyte foot process that is composed of many protein molecules, and podocin (Nphs2) is considered to be one of the key molecules involved in maintaining the integrity of the glomerular filtration barrier [Citation15]. With the progression of diabetic nephropathy, the protein expression of Nphs2 decreases, suggesting the serious damage of podocyte. Moreover, Li et al. [Citation14] reported that crocin demonstrated a protective effect on the SD by inhibiting oxidative stress and decreasing levels of IL-1β, IL-8, IL-10, etc., possibly through the inhibition of NF-κB. Therefore, the signalling pathway of NF-κB may be an important target for the treatment of the disease [Citation16,Citation17].
Basic fibroblast growth factor (bFGF) is a member of the fibroblast growth factor family. As a highly activated basic protein with 146 amino acids, bFGF distributes extensively in vivo. bFGF plays an important role in the processes involved in cell growth, proliferation, differentiation, survival, and malignant transformation. Numerous studies have demonstrated that bFGF is a pleiotropic cytokine, and exogenous bFGF can promote renal repair in acute kidney injury [Citation18] and reduces pro-inflammatory signals [Citation19], and in chronic kidney disease, it can reduce structural and functional damage [Citation20], and it also has anti-apoptotic activity. However, the concrete mechanism by which bFGF acts remains unclear. Moreover, bFGF can reduce blood glucose, blood lipid levels and other levels in diabetic rats [Citation20] and can intervene the diabetic cardiomyopathy [Citation21,Citation22]. Therefore, bFGF has great potential for the treatment of diabetic nephropathy. However, it remains difficult to apply bFGF in the clinics because of its short half-life, low stability and poor membrane permeability. Therefore, optimization of bFGF delivery is necessary so that the exogenous bFGF in the damaged kidney tissue reaches a high enough concentration to repair the damaged kidney tissue. In addition, the bFGF delivery system should maximize the biological activity of bFGF as well as minimize the impact on systemic tissues.
Liposomes consist of natural lipids, and they are non-toxic and biodegradable and do not stimulate the immune system. In addition, the use of liposomes as carriers of bioactive compounds not only improves the bioavailability of these compounds but also enhances their stability since they are trapped inside the liposome [Citation23]. In addition, another advantage of liposomes is that they can release active drug continuously at the site [Citation24]. Therefore, the usage of liposomes as carriers for bFGF in vivo is a great choice to overcome these issues [Citation25]. However, liposomes lack organ and tissue specificity in vivo [Citation26], so it is necessary to find an effective technology for the targeted release a bFGF-encapsulated liposome (bFGF-lip) and improve the uptake of this bFGF-lip in the kidney.
Low-intensity ultrasound (US) in combination with the destruction of microbubbles (UTMD) was proved to be a useful strategy to promote the specific delivery of therapeutics to some organs and improve their permeability against the dense tissues [Citation27,Citation28]. Moreover, the damage of UTMD against the focused tissues was negligible at the low intensity. Recently, several studies have shown that UTMD can obviously enhance the release of drug from the liposome in the ultrasonic sites [Citation21] and also selectively increase its permeability against the microvessel so that circulating materials extravasate into the tissues [Citation29], which, in theory, have benefits for most drugs and antifibrotic genes. The enhanced permeability under ultrasound-mediated microbubble destruction (UTMD) is largely attributed to the cavitation of ultrasound-mediated microbubble [Citation28]. In addition, Zhang et al. [Citation30] confirmed that UTMD can increase renal interstitial capillary permeability in early diabetic nephropathy rats.
Therefore, in this study, UTMD is adopted to promote the kidney-targeted delivery of the bFGF-encapsulated liposome (bFGF-lip) and improve their permeability against renal tissue. We aim to gain a deeper understanding of the therapeutic impact of the bFGF-lip + UTMD technique and determine whether the bFGF-lip + UTMD technique is effective for preventing DN in an animal model of diabetes. Therefore, a wide range of commonly used pathophysiological indicators of nephropathy were measured in a rat model of induced type 1 DM and DN. These measurements allowed a thorough preclinical evaluation of the in vivo effects of 12 weeks of bFGF-lip + UTMD therapy on renal function and related structural damage. Overall, this study has generated comprehensive data that are significant for validating a novel therapy to prevent DN.
Materials and methods
Materials
Egg Yolk Lecithin (PC, PC-98 T) and cholesterol (98% of purity) were purchased from Shanghai Advanced Vehicle Technology Pharmaceutical L.T.D. Co (AVT, Shanghai, Chian). Anti-Bax, anti-Bcl-2, anti-NPHS2, anti-caspase-3, anti-NF-κB, anti-MCP-1, anti-IL-1β, anti- IL-6, and anti- TGFβ1 antibodies were obtained from Abcam (Cambridge, MA). Anti-GAPDH primary antibody and appropriate secondary antibodies were purchased from Santa Cruz Biotechnology (Santa Cruz, CA). TUNEL kit was obtained from Roche (Roche, Shanghai, China). All other reagents were obtained from Sigma-Aldrich (St. Louis, MO). ELISA and SOD/MDA assay kits were purchased from Nanjing Jiancheng Bioengineering Institute (Nanjing, China).
Preparation of phospholipid-based microbubbles (PMBs)
As our previous study reported, phospholipid-based microbubbles (PMBs) were provided by the School of Pharmaceutical Sciences, Wenzhou Medical University using the sonication–lyophilization method [Citation31]. At 30 °C, using a JY 92-II ultrasonic processor (KunShan US Inc., KunShan, China) at a frequency of 40 kHz and power of 160 W to dissolve hydrogenated phosphatidylcholine (HPC, HPC >99%, Doosan Corporation Biotech BU, Kyonggi Do, Korea), polyethylene glycol 1500 (Qingming Chemical Plant, Zhejiang Province, China), and Poloxamer 188 (Shenyang Chemical Plant, Liaoning Province, China) in analytical-grade butanol and sonicated for 3 min. Storing the solution at 0 °C for 30 min and at –20 °C for 1 h and then lyophilizing the coagulated solution at 5 × 10⁻⁴ Pa for a total of 20 h (primary drying at −48 °C for 15 h and then temperature was gradually increased to 10 °C in 5 h). The lyophilized PMB powder was put in vials (100 mg/vial) and saturated with perfluoropropane (C3F8, electronic grade, Institute of Special Gas, Tianjing, China). PMB solution was obtained by adding 2 ml 0.9% NaCl to lyophilized PMB. The PMBs with an average diameter of 3.41 μm was measured by Nano Measurer 1.2.
Preparation and characterization of bFGF-lip
Preparation of bFGF-lip
The reverse-phase evaporation method was used to prepare the bFGF liposomes. According to the molar ratio (9:1), 100 mg of total lipids (PC) and cholesterol were dissolved in 1 ml of dichloromethane as an oil. Then, 50 μL of bFGF solution (0.5 mg/mL) in an aqueous phase was added to the oil solutions and emulsified under probe sonication (Branson 450 Sonifier, 20% of amplitude for 20 s, on 10 s, off 10 s). The sample was always kept in ice water during sonication, and after sonication, W/O emulsion was further evaporated on a rotary evaporator to remove organic solvent under a vacuum. Finally, the residual dry lipid membrane was hydrated with pH 7.4 PBS (10 × 10−3 mol) at room temperature.
Characterization of bFGF-lip
The Zeta Potential/Particle Sizer Nicomp™ 380 ZLS system (PSS. Nicomp, Santa Barbara, CA) was used to determine the zeta potential of the blank and the bFGF-lip by dynamic light scattering. A transmission electron microscope (TEM) (1230, Jeol Jem Company, Tokyo, Japan) was used to observe the morphology of the blank and the bFGF-lip using negative staining with 1% phosphotungstic acid. Each sample was diluted with 5% trehalose solution, and a drop of the diluted sample that was stained with 1% phosphotungstic acid and air dried was placed on the surface of a copper grid. The TEM was used to examine the blank and the bFGF-lip.
The encapsulating efficiency of the bFGF-lip was determined by an ELISA assay. A total of 1.5 ml of the bFGF-lip dispersion was centrifuged at 10,000 g for 40 min. Then, the supernatant was collected and diluted for the ELISA assay. The analyses were performed in triplicate and the encapsulation efficiency was calculated using the follow formula: encapsulation efficiency (%) = (total amount of drug − amount of drug in supernatant)/total amount of drug ×100%.
The release of bFGF liposomes in vitro was detected using the dynamic dialysis method. For this assay, the bFGF liposome solution (2 ml) was placed into a dialysis bag (3500 Da) and immersed in 50 ml of release medium (PBS buffer, pH 7.3) under continuous stirring (120 rpm/min) at 37 °C. Then, 1 ml of release medium was withdrawn at each time, and drug concentration was determined by ELISA. At the same time, an equivalent volume of fresh medium was supplemented at each sample time. The following formula was used to calculate the cumulative release percentage: cumulative release percentage (%) = (amount of the released bFGF/total bFGF amount in liposome) × 100%.
Animal studies
Type 1 DM animal model
The experiments were approved by the Institutional Animal Care and Use Committee of Wenzhou Medical University. Male Sprague–Dawley (SD, 7–8 week) rats were purchased from SLAC Laboratory Animal Co., Ltd. (Shanghai, China). As reported in our previous study [Citation31], STZ was prepared as a 1% solution in 0.1 M of citrate buffer (pH 4.0–4.5). All the rats received a single intraperitoneal injection of 70 mg/kg STZ after 12 h of fasting. On days 3, 7 and 14 after STZ injection, the fasting blood glucose concentrations were determined by samples from the tail vein using an autoanalyser (Surestep, Roche, Germany). Only the rats with fasting blood glucose levels exceeding 16.7 mm were diagnosed with diabetes. Four weeks after the onset of diabetes, diabetic rats showed mild microalbuminuria (early signs of DN) and were selected for use as diabetic rats with DN.
Experimental design
After the model of DN was induced, the DN rats were randomly divided into seven groups: (1) control group: rats that did not receive STZ injections and were treated with physiological saline; (2) DN group: rats that had DN induced but were treated with physiological saline; (3) bFGF group: rats that were treated with bFGF (5 μg/kg) in 1 ml of physiological saline without PMB or ultrasound treatment; (4) bFGF-lip group: rats that were treated with bFGF-lip (5 μg/kg) in 1 ml of normal saline without phospholipid-based microbubbles or ultrasound treatment; (5) UTMD group: rats had DN induced and were treated with 1 ml PMB solution + ultrasound treatment; (6) bFGF + UTMD group: rats that had DN induced and were treated with a bFGF (5 μg/kg) and PMB mixture dissolved in 1 ml of physiological saline + ultrasound treatment; and (7) bFGF-lip + UTMD group (study group): rats that were treated with bFGF-lip (5 μg/kg) and PMB mixture dissolved in 1 ml of normal saline + ultrasound treatment. For all the rats, bFGF and PMB were administered via a tail vein injection twice weekly for 12 consecutive weeks.
Treatment with bFGF-loaded liposomes combined with UTMD
The UTMD treatment was performed twice a week (from weeks 4 to 12). The experimental animals were anaesthetized through intraperitoneal injection of 30 mg/kg 10% chloral hydrate. They were placed in the prone position, and the left abdomen was shaved. The UTMD effect was generated through a linear array transducer (9Lprobe, 5–9 MHz, Logic E9, GE Medical Systems, Chicago, IL). The linear array transducer was placed over the left kidney in the groups treated with UTMD. The drugs were injected through the tail vein, and there was no enhanced ultrasonic signal before filling of the microbubbles and bFGF-containing treatment. When a large number of PMBs were seen filling the left kidney, the microbubble destruction (MBD) function key was immediately pressed to disrupt the PMBs for UTMD (mechanical index [MI] = 1.3, exposure time =10 s, repeated 10 times, depth =2–3 cm). The probe was moved slowly until the microbubbles completely disappeared in the left kidney.
Measurement of renal dimensions and function using ultrasound imaging
Ultrasound, because of its safety and convenience, is often used clinically to detect soft tissue morphology and blood flow [Citation32]. We used contrast-enhanced ultrasound (CEUS) and colour Doppler to assess kidney morphology and function. In recent years, quantitative analysis technology for CEUS has developed rapidly and involves the use of ultrasound microbubbles as red blood cell tracers, which effectively reflect perfusion in the renal microcirculation [Citation33–35] for the early diagnosis of diabetic nephropathy. Before treatment, each rat’s renal cortical perfusion was quantitatively assessed by CEUS at the fourth week. Quantitative ultrasound analysis software was used to analyse the echogenicity of the contrast agent microbubbles in the region of interest (ROI) (surface peripheral renal cortex) and obtain a time-intensity curve (TIC). A series of parameters, such as A (absolute peak intensity), TTP (time to peak), area (area under curve) and grad (gradient from start frame to peak frame), were obtained from the TIC [Citation36]. Among the quantitative parameters of the real-time CEUS time-intensity curve, TTP represents that the contrast agent does not initially enter the region of interest until the time to reach the peak intensity, grad response indicates the tissue perfusion rate, and A refers to the cross-sectional area of the contrast agent where the signal intensity is most obviously enhanced, which reflects the blood volume of the local tissue and can better reflect renal perfusion. The area and local tissue blood flow have a good correlation. Each site within the ROI was repeatedly analysed 3 times, and the average was calculated.
After 8 weeks of treatment, the length, width and thickness of the maximum coronal sections of the left kidneys were measured, and the renal volume was calculated according to the following formula: kidney volume (cm3) = (π/6) × length (cm) × width (cm) × thickness (cm). In addition, colour Doppler mode was used to observe the left renal blood flow distribution, and spectral Doppler mode was used to collect the haemodynamic parameters, such as peak systolic velocity (VS), end-diastolic velocity (VD) and interlobar arterial resistance index (RI).
Haematoxylin–eosin staining of the kidneys
Tissues were fixed in 4% paraformaldehyde and subsequently embedded in paraffin. Sections (5 μm thick) were stained with haematoxylin and eosin (HE) using a standard protocol and analysed by optical microscopy (Nikon ECLPSE 80i, Tokyo, Japan) to observe mesangial cell proliferation.
Intrarenal detection of bFGF by Western blot
The normal rats were randomly divided into two groups: one was administered bFGF alone via tail vein injection and another was administered bFGF combined with PMB via tail vein injection followed by ultrasound treatment. Then, the rats were sacrificed to detect the content of bFGF in the kidneys by Western blot. Protein extracts from the renal tissues were prepared by centrifuging the complex mixed with a portion of the renal tissues and protein extraction reagents and subjected to Western blot. The protein concentrations were measured by the Braford protein assay. Equal amounts of protein extracts were fractionated by SDS-PAGE assay.
Inhibition of inflammatory factors
Immunohistochemical staining of inflammatory factors
After paraffin-embedded sections (5 μm) were deparaffinized and rehydrated, the sections were incubated with 3% H2O2 for 10 min at 37 °C and then blocked with 5% bovine serum albumin (BSA) for 30 min. The sections were covered with anti-caspase-3 (1:150), anti-NF-κB (1:200), anti-MCP-1 (1:200), anti-TGF-β1 (1:200), anti-IL-6 (1:200), anti-IL-1β (1:250) and anti-Nphs2 (1:200) and stored at 4 °C overnight. Then, the samples were incubated with the appropriate secondary antibody for 1 h. Next, the samples were stained with 3,3-diaminobenzidine (DAB 1:20) and counterstained with haematoxylin. The positive points were dyed brown and observed using a Nikon ECLPSE 80i (Nikon, Tokyo, Japan). The average integrated optical density (IOD) per stained area (μm2) (IOD/area) (10 random fields from per group) was calculated blindly and analysed using Image-Pro Plus 6.0 software (NIH, Bethesda, MD).
Immunofluorescence staining of inflammatory factors
Briefly, the paraffinic sections were treated with anti-IL-6 (1:200) and anti-IL-1β (1:250). All the steps were the same as the immunohistochemistry staining before incubating with the secondary antibody. After treating with the primary antibody, the samples were incubated with goat anti-rabbit IgG-conjugated FITC (1:1500). Subsequently, the samples were stained with DAPI, and all fluorescent images were captured using a Nikon confocal laser microscope.
Inhibition of inflammation-induced oxidative stress
The blood samples were collected immediately when the rats were sacrificed. The blood samples were centrifuged at 3000 rpm for 15 min to achieve serum separation, and serum levels of malondialdehyde (MDA) and superoxide dismutase (SOD) were measured using the SOD/MDA assay kit (Nanjing Jiancheng Bioengineering Institute, Nanjing, China) according to the manufacturer’s instructions.
Inhibition of inflammation-induced apoptosis of renal cells
TUNEL staining of diabetic kidneys
Apoptosis in kidney sections was detected by using the TUNEL kit (Roche, Mannheim, Germany) according to the manufacturer’s instructions. Kidney sections were deparaffinized and rehydrated, treated with H2O2 for 20 min at 37 °C and incubated with the reaction mixture containing terminal deoxynucleotidyl transferase (TdT) and digoxigenin-conjugated dUTP for 1 h at 37 °C. After TUNEL labelling, the nucleus was labelled with DAPI, and the TUNEL-positive labelled apoptotic cells were observed using a Nikon confocal laser microscope (Nikon, A1 PLUS, Tokyo, Japan).
Western blot assay of apoptotic factors
After treatment, the rats were sacrificed to detect the expression of Bcl-2 and Bax in the kidneys by Western blot. Protein extracts from the renal tissues were prepared by centrifuging the complex mixed with a portion of the renal tissues and protein extraction reagents and subjected to Western blot. The protein concentrations were measured by the Braford protein assay. Equal amounts of protein extracts were fractionated by SDS-PAGE and then transferred to polyvinylidene difluoride (PVDF) membranes (Millipore Company, Billerica, MA). Membranes were blocked with 5% non-fat milk in Tris-buffered saline with Tween-20 (TBST, pH 7.6) for 1 h at room temperature. Then, the membranes were incubated with primary antibodies Bcl-2 (1:1000), Bax (1:1000), GAPDH (1:1000)) overnight at 4 °C. The membranes were rinsed three times with TBST for 5 min each time and incubated with the respective secondary antibodies (1:7000 dilutions of each antibody) for 1 h at room temperature. The signals were visualized with the BIO-RAD Imaging System (Bio-Rad, Hercules, CA) with chemiluminescence detection reagents.
Statistical analysis
The data presented were analysed with one-way analysis of variance (ANOVA) and Student’s t-test using SPSS 19.0 software (SPSS, Chicago, IL) and presented as the mean ± SD. p < .05 was considered statistically significant.
Results
Characterization of bFGF-lip
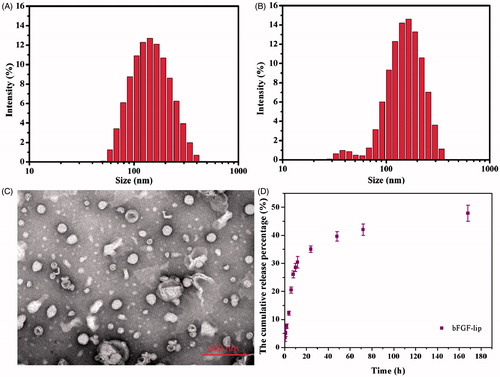
Characteristics of the blank and the bFGF-lip are summarized in Table S1. Dynamic light scattering results demonstrated that the average particle sizes of the blank and the bFGF liposomes were 133.3 ± 17.4 nm and 171.1 ± 14.2 nm, respectively. The zeta potential of the blank liposomes was −1.96 ± 0.66 mV, and the zeta potential of the bFGF liposomes was −5.15 ± 2.08 mV, which indirectly indicates that bFGF was encapsulated in the liposomes. In addition, the encapsulation efficiency of the bFGF-lip reached 79.8 ± 2.6%. , the bFGF-loaded liposomes had good round morphology, and the bFGF-lip exhibited an inner aqueous phase with an outer layer covered with a lipid vesicular layer. The in vitro drug release profiles of the bFGF-lip in pH 7.4 PBS are shown in . The release of bFGF from the bFGF-lip was slow without any obvious burst release. The cumulative release percentage of the encapsulated bFGF was only 40.08 ± 2.9% at 48 h, 42.21 ± 4.8% at 72 h and only 47.81 ± 4.79% at 168 h. The sustained-release profile was beneficial for prolonging the retention time in blood, which may facilitate more drugs distribution to the damaged kidney.
Figure 1. Characterization of the bFGF-lip. (A) Size distribution of the liposomes; (B) size distribution of the bFGF-lip; (C) representative TEM micrographs of the bFGF-lip; (D) in vitro cumulative release of CoQ10 from bFGF-lip.
Effects of bFGF-lip + UTMD on renal dimensions and function
The time–intensity curve (TIC) was acquired from the CEUS quantitative analysis to reflect the perfusion of the renal microcirculation, and the results are shown in . A series of parameters obtained from the TIC are shown in Table S2. From the results, we found that compared with normal rats, rats with early DN had greater TTP and area values and lower A and grad values. However, only the differences between the A values and the area values were statistically significant. These finding indicate that the ultrasound parameters A and area may be sensitive indicators that reflect the early blood flowing changes in diabetic nephropathy.
Figure 2. Effects of bFGF-lip + UTMD on left kidney dimensions and function. (A) CEUS images of TIC curve in normal rats and early DN rats at week 4; (B) the images of left kidney size from two-dimensional ultrasound; (C) the images of renal blood signal from Doppler ultrasound; (D, E, F, G) The statistics of left kidney volume, peak systolic velocity (VS), end-diastolic velocity (VD) and the resistance index (RI). N = 6 per group. *p < .05, **p < .01 and ***p < .001 versus the DN group, #p < .05, ##p < .01 and ###p < .001 versus the bFGF-lip + UTMD group.
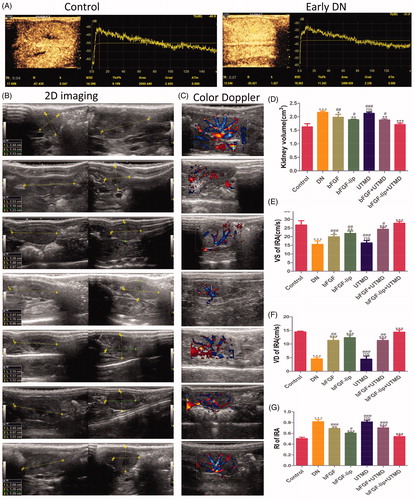
After 8 weeks of treatment, the renal volume and blood flow parameters were observed with two-dimensional ultrasound and colour Doppler, respectively, and the results are shown in . Compared with the control group, there were less blood flow signals in the DN group. However, after treatment with the bFGF or the bFGF-lip ± UTMD, the blood flow signals in the kidneys were increasing and were richest in the bFGF-lip + UTMD group (). The size of the left kidney was measured by two-dimensional ultrasound, and the left kidney volume in the DN group was significantly increased. After the treatment with the bFGF or the bFGF-lip ± UTMD, the left kidney volumes were decreased in the DN group. In addition, there was also a statistically significant difference between the treatment groups (in ). As expected, the bFGF-lip + UTMD group showed the most remarkable curative effect. The parameters that VS, VD and RI were measured to reflect renal function. The dates are shown in ). Compared with the control group, in the DN group, the VS and VD were decreased to a great extent, and the RI was remarkably increased. Moreover, from the dates above, we found that only UTMD did not have any effect on the kidneys (p > .05 versus DN group), indicating that it only played a role in delivering the bFGF to the kidneys in a targeted manner to enhance the efficiency of bFGF.
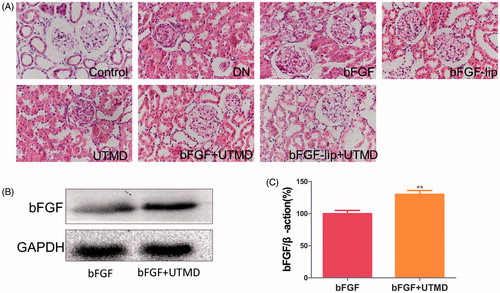
Figure 3. Effects of bFGF-lip + UTMD on renal histopathological morphology and the content of bFGF in kidney combined with UTMD. (A) Haematoxylin–eosin staining of kidney; (B) Western blot analysis of bFGF; (C) quantitative analyses of bFGF. N = 6 per group. Data are expressed as the mean ± SD. *p < .05, **p < .01 and ***p < .001 versus the bFGF group.
Effects of bFGF-lip + UTMD on renal histopathological morphology
Haematoxylin–eosin staining was used to evaluate the morphology of the kidneys in DN rats after the various treatments. The results are shown in . Compared with the control group, the DN group had mesangial cell proliferation and basement membrane thickening. Nevertheless, these pathological renal lesions were alleviated after treatment with bFGF or bFGF-lip ± UTMD. In addition, the bFGF-lip + UTMD group had the best effect. Meanwhile, there was little improvement in the histopathological morphology of the kidneys after UTMD treatment.
Content of bFGF in the kidney tissue in the bFGF + UTMD group compared with the bFGF alone group
To confirm the effects of UTMD technology in targeted delivery of bFGF to the kidney, we detected the content of bFGF in the kidneys by Western blot, and the results are shown in ). The content of bFGF in the kidney tissue in the group treated with bFGF + UTMD was richer than that in the group treated with bFGF alone. The results confirm that UTMD can effectively deliver bFGF to the targeted tissues.
Effects of bFGF-lip + UTMD on NF-kb, MCP-1, TGF-β1, IL-6, and IL -1β release
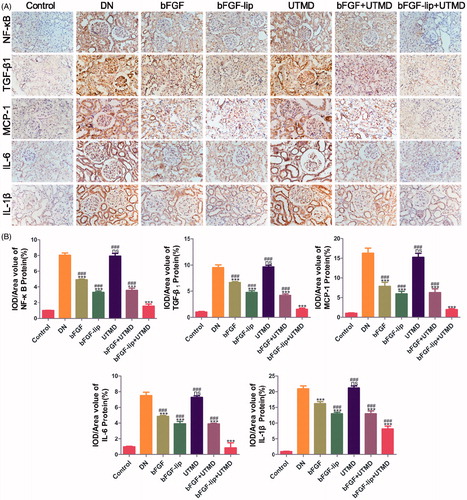
With the development of diabetes, the typical symptoms of diabetes appeared among the experimental rats. Due to long-term hyperglycaemia, a variety of diabetic complications such as diabetic nephropathy gradually occurred. Pro-inflammatory mediators, such as TGF-β1, MCP-1, IL-1β and IL-6, were closely related with diabetic nephropathy, and NF-kb took part in regulating the release of these mediators. The expression of NF-kb, TGF-β1 and MCP-1 in renal tissues was detected by immunohistochemical staining () and the expression of IL-6 and IL -1β was detected by immunohistochemical staining () and immunofluorescence staining (Figure S1(A,B)). Compared with the control group, the DN group had much higher levels of NF-kb, TGF-β1 and MCP-1 (Fi 4) and IL-6 and IL -1β (). With the treatment with bFGF or bFGF-lip ± UTMD, the expression of NF-kb decreased, and pro-inflammatory mediators, such as MCP-1, TGF-β1, IL-6 and IL-1β, were also reduced, following the same trend as NF-kb. In addition, in the bFGF-lip + UTMD group, the degree of reduction was the most obvious. Similar results were found with immunofluorescence staining (Figure S1(A,B)).
Figure 4. Effects of bFGF-lip + UTMD on NF-kb, TGF-β1, MCP-1, IL-6 and IL-1β release. (A) Immunohistochemistrical staining of NF-κB, TGF-β1, MCP-1, IL-6 and IL-1β; (B) quantitative analyses of renal NF-κB, TGF-β1, MCP-1, IL-6 and IL-1β immunohistochemistry, N = 6 per group. Data are expressed as the mean ± SD. *p < .05, **p < .01 and ***p < .001 versus the DN group, #p < .05, ##p < .01 and ###p < .001 versus the bFGF-lip + UTMD group.
Effects of bFGF-lip + UTMD on biochemical indicators
To some extent, long-term hyperglycaemia plays an important role in activating NF-κB to initiate inflammatory reactions, and inflammation is further enhanced by the oxidative stress response [Citation37], which increases local renal injury. Malondialdehyde (MDA) is the end product of lipid peroxidation and a common indicator of the level of oxidative stress and is associated with oxidative stress-induced renal damage in DN rats [Citation38]. Superoxide dismutase (SOD) is the first line of defence against free radicals in the body, and the activity of SOD reflects the strength of the antioxidant capacity [Citation39]; thus, the above indicators can determine the degree of the body's oxidative stress response. The levels of SOD and MDA in blood after different treatments are shown in Figure S1(C,D). The MDA content in scrum decreased after treatment with bFGF or bFGF-lip ± UTMD, and the activity of SOD increased. The therapeutic effect of bFGF-lip + UTMD was the best.
Effects of bFGF-lip + UTMD on expression levels of caspase-3, Bcl-2 and Bax
The pro-inflammatory mediator TGF-β1 is involved in the regulation of many cellular functions, including proliferation, differentiation, apoptosis and inflammation [Citation40,Citation41]. As shown in , positive expression of caspase-3 was represented by brown immunohistochemical staining in the renal tissue. The expression of caspase-3 was significantly increased in the glomeruli and the adjacent cortical tubular interstitium in the DN group compared with the control group. With the treatment of bFGF or bFGF-lip ± UTMD, the expression of caspase-3 was downregulated. Moreover, the extent of down-regulation of caspase-3 was the greatest in the bFGF-lip + UTMD group (). Apoptosis-associated molecules, including Bax and Bcl-2, were detected by Western blot and the expression of Bcl-2 and Bax are shown in . Quantitative analyses of the ratio of Bcl-2/Bax are shown in , and lower expression of Bcl-2/Bax was observed in the DN group compared with the control group. As expected, the bFGF-lip + UTMD group demonstrated the highest level of Bcl-2/Bax expression compared with the other bFGF treatment groups. Additionally, TUNEL staining was also used to evaluate cell apoptosis, and the results are shown in . Similar results were obtained. Compared with the control group, the positive apoptotic cells number was increased in the DN group, and fewer positive apoptotic cells were observed in bFGF treatment groups. Additionally, the bFGF-lip + UTMD group had the fewest positive apoptotic cells.
Figure 5. Effects of bFGF-lip + UTMD on cells apoptosis of kidney. (A) Immunohistochemistrical staining of caspase-3; (B) quantitative analyses of renal caspase-3 immunohistochemistry; (C) Western blot analysis of renal Bax and Bcl-2 protein expression; (D) quantitative analyses of Bcl-2/Bax; (E) immunofluorescent staining of TUNEL (green staining). N = 6 per group. Data are expressed as the mean ± SD. *p < .05, **p < .01 and ***p < .001 versus the DN group, #p < .05, ##p < .01 and ###p < .001 versus the bFGF-lip + UTMD group.
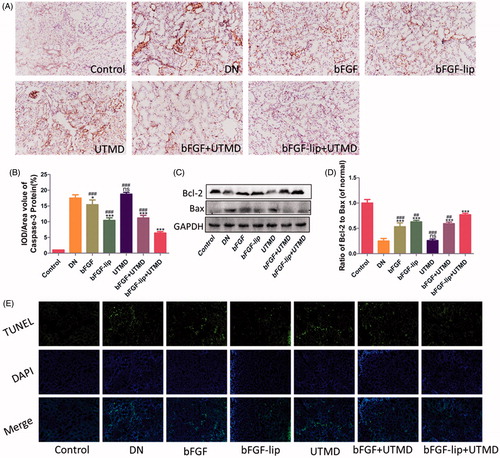
Figure 6. Effects of bFGF-lip + UTMD on expression of Nphs2 levels. (A) Immunohistochemistrical staining of Nphs2; (B) quantitative analyses of Nphs2 immunohistochemistry; (C) Western blot analysis of Nphs2 protein expression; (D) quantitative analyses of Nphs2 expression. N = 6 per group. Data are expressed as the mean ± SD. *p < .05, **p < .01 and ***p < .001 versus the DN group, #p < .05, ##p < .01 and ###p < .001 versus the bFGF-lip + UTMD group.
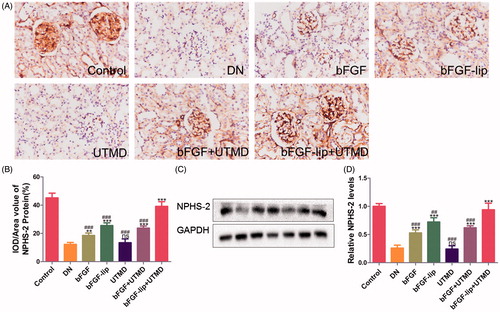
Effects of bFGF-lip + UTMD on the expression of Nphs2
As shown in , the Nphs2 protein was observed with immunohistochemical staining. As expected, the expression of Nphs2 was significantly decreased in DN rats, indicating severe damage of the podocytes. After treatment with bFGF or bFGF-lip ± UTMD, the expression of Nphs2 increased to a certain extent. In addition, an obvious improvement in Nphs2 expression was observed in the bFGF-lip + UTMD group (in ), which suggests that bFGF can protect kidney function by preserving the podocytes. Similar results were exhibited in Western blot analysis: the expression of Nphs2 was the highest in the group treated with bFGF-lip + UTMD compared with the other bFGF treated groups (in )).
Discussions
bFGF can reduce structural and functional damage in chronic kidney disease [Citation19], reduce pro-inflammatory signals in acute kidney injury [Citation18] and has tremendous therapeutic potential for diabetes [Citation20,Citation21]. However, it remains difficult to apply bFGF in the clinic because of its short half-life, low stability and poor penetration of the cellular membrane. Liposomes, which are non-toxic multi-functional drug carriers, can enhance the solubility of insoluble drugs, protect the drugs from degradation, and produce controlled release effects; thus, they can solve these problems. Therefore, we evaluated a technology that could deliver bFGF-loaded liposomes to the entire kidney in a targeted manner. UTMD as a non-invasively strategy to deliver agents to the entire kidney, can increase renal interstitial capillary permeability [Citation30], markedly improve the efficiency of drug ingress into cells [Citation29] and recover renal function significantly. Figure S2 depicts ultrasound images of left kidney at the different stages of the UTMD process, which were captured by the linear array transducer. Before injection of microbubble agent, the kidney was not filled with the microbubble and, therefore, there was a little enhancement of ultrasonic signals in the kidney (Figure S2(A)). At appropriately 20 s after injection of microbubble agent, the left kidney was completely filled with the microbubble, exhibiting strong ultrasonic signal (Figure S2(B)). During the repeating ultrasound targeted microbubble destruction (UTMD), most of the microbubbles burst and the ultrasound signal was significantly enhanced (Figure S2(C)). After UTMD, the microbubble completely disappeared in the left kidney and the ultrasound signal was recovered to the strength of naive kidney (Figure S2(D)). Microbubbles and ultrasound not only deliver agents in a targeted manner and diagnose kidney disease but also enhance the cellular uptake of agents into the kidney [Citation35]. Therefore, in this study, we applied a combination of bFGF-loaded liposomes with ultrasound targeted microbubble destruction (UTMD) to treat diabetic nephropathy. Western blot analysis of the kidney tissues of normal rats treated with bFGF + UTMD and bFGF confirmed that the group combining bFGF with UTMD had a higher level of bFGF than bFGF treatment alone, which indicates that the UTMD technology can deliver bFGF into the kidneys effectively.
The kidneys have a rich blood flow that accounts for approximately 20% of the systemic circulation. Therefore, when renal parenchymal lesions occur, the development and the rehabilitation of these lesions are almost all caused by changes in perfusion. Studies have reported that the pathogenesis of DN in both type 1 and type 2 DM is associated with abnormalities in renal haemodynamics [Citation42], so exploring haemodynamic changes in the kidney has practical implications for the diagnosis of early DN. In addition, CEUS can analyse renal blood flow quantitatively [Citation43]. Through analyzing the echo volume and changes in the contrast agent microbubbles in the ROI over time to generate the TIC, quantitative parameters obtained from the TIC can be used to objectively and accurately quantify renal cortical haemodynamic changes [Citation44]. The study by Dong et al. [Citation45] showed that renal function changes in patients with DN can be monitored by changes in the TIC curve parameters of the renal cortex. Compared with the normal rats, in the diabetic rats, the parameters A and grad were decreased, and the area and TTP were increased at the fourth week (Table S2). Both were associated with significant thickening of the glomerular basement membrane and significant increases in the mesangial matrix, which led to capillary stenosis or occlusion, increased vascular resistance, reduced blood perfusion velocity, decreased blood volume and decreased blood flow, indicating that early DN was induced [Citation31]. However, only the parameters A and area had statistical significance. Therefore, the A and area values might be sensible quantitative indexes to reflect haemodynamics in rats with early DN. The volume of the kidneys in the DN group was significantly increased on the two-dimensional ultrasound images, and the blood flow was drastically reduced on the colour Doppler images. The mechanism may be related to hyperglycaemia, renal haemodynamics and a variety of cytokines that result in excessive accumulation of extracellular matrix and increased renal volume, which consistent with the literature [Citation46]. After 12 weeks of bFGF or bFGF-lip ± UTMD treatment, the rats in the treatment group had different degrees of renal hypertrophy, and blood flow improved to a certain extent. VS mainly reflects the degree of blood supply for renal vascular filling and blood flow, VD mainly reflects the amount of renal perfusion and RI reflects the renal vascular bed resistance due to vascular elasticity and renal interstitial changes. Normal renal arteries have low resistance, high velocity and high perfusion, and with the progression of diabetic nephropathy, renal arteries gradually showed high resistance, low flow rates and decreased low perfusion. It has been reported that an RI of IRA ≥0.7 can serve as a diagnostic index for DN, and its accuracy reached 93.7% [Citation47]. The occurrence and development of diabetic nephropathy accompanied by haemodynamic changes can provide theoretical support for the assessment of renal function.
The pathogenesis of DN is still unclear, and in the past, it was widely accepted that disorders of glucose metabolism, changes in renal haemodynamics and other factors played an important role in the progression of DN. A large number of excellent reviews have already covered the role of the inflammatory response in the progress of DN [Citation48]. Studies have shown that inflammatory cells, such as macrophages and lymphocytes, and pro-inflammatory mediators, such as TGF-β, MCP-1, IL-1β and IL-6 were significantly increased in diabetic patients or diabetic models [Citation4,Citation49,Citation50], and these resulted in a cascade of damage to the kidney (Figure S3). We assessed the degree of inflammation in diabetic nephropathy by detecting the levels of TGF-β, MCP-1, IL-6 and IL-1β in the blood [Citation51–53]. Nuclear factor-kappa B (NF-κB) emerged as a major regulator of the inflammatory response [Citation7], and, in diabetes, activated NF-κB promotes the expression of pro-inflammatory mediators, such as TGF-β1, MCP-1, IL-6 and IL-1β, to increase the local inflammatory response. The results of the immunohistochemical staining showed that bFGF treatment could inhibit the activation of NF-κB to some extent and thus reduce the expression of the pro-inflammatory cytokines TGF-β1, MCP-1, IL-6 and IL-1β. These results showed that bFGF could reduce the inflammatory response to protect renal function, and the bFGF-lip + UTMD group had the best effect. Moreover, inflammation in turn enhances oxidative stress [Citation37,Citation54,Citation55], forming a vicious circle and promoting the progression of diabetic nephropathy. In addition, from the results above, we found that the serum MDA values that are associated with oxidative stress-induced renal damage in DN rats [Citation38] were decreased, and the activity of SOD, which reflects the strength of the antioxidant capacity [Citation39], was increased after treatment with bFGF or bFGF-lip ± UTMD. Among the groups, the therapeutic effect of bFGF-lip + UTMD was the best. These findings indicate that bFGF-lip + UTMD can protect renal function by reducing the activation of NF-κB, reducing the expression of the pro-inflammatory cytokines TGF-β1 MCP-1, IL-6 and IL-1β, as well as reducing the oxidative stress caused by inflammation.
Many factors account for the occurrence and development of diabetic nephropathy, including damage of the renal tubules [Citation56]. The expression of TGF-β1 was associated with apoptotic tubular cells, and inhibiting the expression of TGF-β1 reduced tubular epithelial apoptosis [Citation57]. From the results of our study, we found that bFGF-lip + UTMD had the best effect on inhibiting renal tubular cell apoptosis, which was confirmed by immunohistochemistry, TUNEL staining and WB. There was downregulation of caspase-3, upregulation of the anti-apoptotic protein Bcl-2 and downregulation of the apoptotic protein Bax. These findings indicated that bFGF-lip + UTMD can protect renal function by reducing cell apoptosis.
It has been reported that in diabetic conditions podocytes undergo oxidative stress and inflammatory responses that strongly contribute to the destruction of the SD, and inhibiting the activation of NF-κB to decrease the levels of pro-inflammatory mediators may protect the podocytes [Citation14,Citation57]. SD is a specific membrane region on the podocyte foot process, and Nphs2 is a key molecule that maintains the integrity of the glomerular filtration barrier [Citation15]. Our results showed that the expression of Nphs2, a pivotal indicator of podocyte damage, was decreased with the progression of DN. However, after treatment with bFGF-lip + UTMD, it was remarkably increased, indicating that bFGF-lip + UTMD treatment could protect podocytes.
Conclusions
In conclusion, this study shows that CEUS quantitative analysis has favourable value for the diagnosis of early diabetic nephropathy. In addition, it was found that bFGF can delay the progression of diabetic nephropathy, possibly by inhibiting the activation of NF-κB, so that the expression of the pro-inflammatory cytokines TGF-β1, MCP-1, IL-6 and IL-1β is reduced, which reduces the oxidative stress response, tubular epithelial apoptosis and podocyte damage. Moreover, treatment with bFGF-lip combined with UTMD produced the superior therapeutic effects on DN of diabetic rats in comparison with treatment with free bFGF solution, which may be due to more bFGF distributed to the kidneys. This method might be a good way to target drugs to reverse DN in future clinical applications.
supporting_information.docx
Download MS Word (1.2 MB)Disclosure statement
No potential conflict of interest was reported by the authors.
Additional information
Funding
Related Research Data
References
- Kanwar YS, Wada J, Sun L, et al. Diabetic nephropathy: mechanisms of renal disease progression. Exp Biol Med (Maywood). 2008;233:4–11.
- Luis-Rodriguez D, Martínez-Castelao A, Górriz JL, et al. Pathophysiological role and therapeutic implications of inflammation in diabetic nephropathy. Wjd. 2012;3:7–18.
- Rivero A, Mora C, Muros M, et al. Pathogenic perspectives for the role of inflammation in diabetic nephropathy. Clin Sci. 2009;116:479–492.
- Tesch GH. Macrophages and diabetic nephropathy. Semin Nephrol. 2010;30:290–301.
- Sanchez-Nino MD, Bozic M, Córdoba-Lanús E, et al. Beyond proteinuria: VDR activation reduces renal inflammation in experimental diabetic nephropathy. Am J Physiol Renal Physiol. 2012;302:F647–F657.
- Wu J, Guan TJ, Zheng S, et al. Inhibition of inflammation by pentosan polysulfate impedes the development and progression of severe diabetic nephropathy in aging C57B6 mice. Lab Invest. 2011;91:1459–1471.
- Vallabhapurapu S, Karin M. Regulation and function of NF-kappaB transcription factors in the immune system. Annu Rev Immunol. 2009;27:693–733.
- Palsamy P, Subramanian S. Resveratrol protects diabetic kidney by attenuating hyperglycemia-mediated oxidative stress and renal inflammatory cytokines via Nrf2-Keap1 signaling. Biochim Biophys Acta. 2011;1812:719–731.
- Pai S, Thomas R. Immune deficiency or hyperactivity-Nf-kappab illuminates autoimmunity. J Autoimmun. 2008;31:245–251.
- Ahad A, Ganai AA, Mujeeb M, et al. Ellagic acid, an NF-kappaB inhibitor, ameliorates renal function in experimental diabetic nephropathy. Chem Biol Interact. 2014;219:64–75.
- Navarro-Gonzalez JF, Mora-Fernández C, Muros de Fuentes M, et al. Inflammatory molecules and pathways in the pathogenesis of diabetic nephropathy. Nat Rev Nephrol. 2011;7:327–340.
- Nogueira-Machado JA, Volpe CM, Veloso CA, et al. HMGB1, TLR and RAGE: a functional tripod that leads to diabetic inflammation. Expert Opin Ther Targets. 2011;15:1023–1035.
- Yasuda-Yamahara M, Kume S, Tagawa A, et al. Emerging role of podocyte autophagy in the progression of diabetic nephropathy. Autophagy. 2015;11:2385–2386.
- Li S, Liu X, Lei J, et al. Crocin protects podocytes against oxidative stress and inflammation induced by high glucose through inhibition of NF-kappaB. Cell Physiol Biochem. 2017;42:1481–1492.
- Economou CG, Kitsiou PV, Tzinia AK, et al. Enhanced podocalyxin expression alters the structure of podocyte basal surface. J Cell Sci. 2004;117:3281–3294.
- Ingaramo PI, Ronco MT, Francés DE, et al. Tumor necrosis factor alpha pathways develops liver apoptosis in type 1 diabetes mellitus. Mol Immunol. 2011;48:1397–1407.
- Villanueva S, Cespedes C, Gonzalez A, et al. bFGF induces an earlier expression of nephrogenic proteins after ischemic acute renal failure. Am J Physiol Regul Integr Comp Physiol. 2006;291:R1677–R1687.
- Tan XH, Zheng XM, Yu LX, et al. Fibroblast growth factor 2 protects against renal ischaemia/reperfusion injury by attenuating mitochondrial damage and proinflammatory signalling. J Cell Mol Med. 2017;21:2909–2925.
- Villanueva S, Contreras F, Tapia A, et al. Basic fibroblast growth factor reduces functional and structural damage in chronic kidney disease. Am J Physiol Renal Physiol. 2014;306:F430–F441.
- Lin X, Zhao L, Tang S, et al. Metabolic effects of basic fibroblast growth factor in streptozotocin-induced diabetic rats: a (1)H NMR-based metabolomics investigation. Sci Rep. 2016;6:36474.
- Zhao YZ, Zhang M, Tian XQ, et al. Using basic fibroblast growth factor nanoliposome combined with ultrasound-introduced technology to early intervene the diabetic cardiomyopathy. Int J Nanomedicine. 2016;11:675–686.
- Zhao YZ, Tian XQ, Zhang M, et al. Functional and pathological improvements of the hearts in diabetes model by the combined therapy of bFGF-loaded nanoparticles with ultrasound-targeted microbubble destruction. J Control Release. 2014;186:22–31.
- Bardania H, Tarvirdipour S, Dorkoosh F. Liposome-targeted delivery for highly potent drugs. Artif Cells Nanomed Biotechnol. 2017;45:1478–1489.
- Hong YJ, Pyo CG, Kim JC. Liposomes incorporating hydrophobically modified silk fibroin: pH-dependent release. Int J Biol Macromol. 2010;47:635–639.
- Gokce EH, Korkmaz E, Tuncay-Tanrıverdi S, et al. A comparative evaluation of coenzyme Q10-loaded liposomes and solid lipid nanoparticles as dermal antioxidant carriers. Int J Nanomedicine. 2012;7:5109–5117.
- Duvshani-Eshet M, Machluf M. Therapeutic ultrasound optimization for gene delivery: a key factor achieving nuclear DNA localization. J Control Release. 2005;108:513–528.
- Koike H, Tomita N, Azuma H, et al. An efficient gene transfer method mediated by ultrasound and microbubbles into the kidney. J Gene Med. 2005;7:108–116.
- Lan HY, Mu W, Tomita N, et al. Inhibition of renal fibrosis by gene transfer of inducible Smad7 using ultrasound-microbubble system in rat UUO model. J Am Soc Nephrol. 2003;14:1535–1548.
- Chappell JC, Song J, Burke CW, et al. Targeted delivery of nanoparticles bearing fibroblast growth factor-2 by ultrasonic microbubble destruction for therapeutic arteriogenesis. Small. 2008;4:1769–1777.
- Zhang Y, Ye C, Xu Y, et al. Ultrasound-mediated microbubble destruction increases renal interstitial capillary permeability in early diabetic nephropathy rats. Ultrasound Med Biol. 2014;40:1273–1281.
- Yue T, Xu HL, Chen PP, et al. Combination of coenzyme Q10-loaded liposomes with ultrasound targeted microbubbles destruction (UTMD) for early theranostics of diabetic nephropathy. Int J Pharm. 2017;528:664–674.
- Miller DL, Averkiou MA, Brayman AA, et al. Bioeffects considerations for diagnostic ultrasound contrast agents. J Ultrasound Med. 2008;27:611–632; quiz 633–636.
- Jimenez C, de Gracia R, Aguilera A, et al. In situ kidney insonation with microbubble contrast agents does not cause renal tissue damage in a porcine model. J Ultrasound Med. 2008;27:1607–1615.
- Kinns J, Aronson L, Hauptman J, et al. Contrast-enhanced ultrasound of the feline kidney. Vet Radiol Ultrasound. 2010;51:168–172.
- Deelman LE, Declèves AE, Rychak JJ, et al. Targeted renal therapies through microbubbles and ultrasound. Adv Drug Deliv Rev. 2010;62:1369–1377.
- Benozzi L, Cappelli G, Granito M, et al. Contrast-enhanced sonography in early kidney graft dysfunction. Transplant Proc. 2009;41:1214–1215.
- Elmarakby AA, Sullivan JC. Relationship between oxidative stress and inflammatory cytokines in diabetic nephropathy. Cardiovasc Ther. 2012;30:49–59.
- Chang JM, Kuo MC, Kuo HT, et al. Increased glomerular and extracellular malondialdehyde levels in patients and rats with diabetic nephropathy. J Lab Clin Med. 2005;146:210–215.
- Noh SJ, Lee SH, Shin KY, et al. SP-8203 reduces oxidative stress via SOD activity and behavioral deficit in cerebral ischemia. Pharmacol Biochem Behav. 2011;98:150–154.
- Loboda A, Sobczak M, Jozkowicz A, et al. TGF-β1/*Smads and miR-21 in renal fibrosis and inflammation. Mediators Inflamm. 2016;2016:8319283.
- Fang XX, Sun GL, Zhou Y, et al. TGF-beta1 protection against Abeta1-42-induced hippocampal neuronal inflammation and apoptosis by TbetaR-I. Neuroreport. 2018;29:141–146.
- Kveder R, Kajtna-Koselj M, Rott T, et al. Nephrotic syndrome in patients with diabetes mellitus is not always associated with diabetic nephropathy. Nephrol Dial Transplant. 2001;16(Suppl 6):86–87.
- Wei K, Le E, Bin JP, et al. Quantification of renal blood flow with contrast-enhanced ultrasound. J Am Coll Cardiol. 2001;37:1135–1140.
- Farina R, Pennisi F, La Rosa M, et al. Functional study of the transplanted kidney with power Doppler US and time/intensity curves. Radiol Med. 2007;112:64–73.
- Dong Y, Wang WP, Lin P, et al. Assessment of renal perfusion with contrast-enhanced ultrasound: preliminary results in early diabetic nephropathies. Clin Hemorheol Microcirc. 2016;62:229–238.
- Seyer-Hansen K. Renal hypertrophy in experimental diabetes mellitus. Kidney Int. 1983;23:643–646.
- Parolini C, Noce A, Staffolani E, et al. Renal resistive index and long-term outcome in chronic nephropathies. Radiology. 2009;252:888–896.
- Wada J, Makino H. Inflammation and the pathogenesis of diabetic nephropathy. Clin Sci. 2013;124:139–152.
- Chow F, Ozols E, Nikolic-Paterson DJ, et al. Macrophages in mouse type 2 diabetic nephropathy: correlation with diabetic state and progressive renal injury. Kidney Int. 2004;65:116–128.
- Ninichuk V, Khandoga AG, Segerer S, et al. The role of interstitial macrophages in nephropathy of type 2 diabetic db/db mice. Am J Pathol. 2007;170:1267–1276.
- Fornoni A, Ijaz A, Tejada T, et al. Role of inflammation in diabetic nephropathy. Curr Diabetes Rev. 2008;4:10–17.
- Choudhary N, Ahlawat RS. Interleukin-6 and C-reactive protein in pathogenesis of diabetic nephropathy: new evidence linking inflammation, glycemic control, and microalbuminuria. Iran J Kidney Dis. 2008;2:72–79.
- Lu J, Randell E, Han Y, et al. Increased plasma methylglyoxal level, inflammation, and vascular endothelial dysfunction in diabetic nephropathy. Clin Biochem. 2011;44:307–311.
- Lee JM, Li J, Johnson DA, et al. Nrf2, a multi-organ protector? FASEB J. 2005;19:1061–1066.
- Buckley BJ, Li S, Whorton AR. Keap1 modification and nuclear accumulation in response to S-nitrosocysteine. Free Radic Biol Med. 2008;44:692–698.
- Bottinger EP, Bitzer M. TGF-beta signaling in renal disease. J Am Soc Nephrol. 2002;13:2600–2610.
- Yang S, Zhang J, Wang S, et al. SOCS2 overexpression alleviates diabetic nephropathy in rats by inhibiting the TLR4/NF-kappaB pathway. Oncotarget. 2017;8:91185–91198.