
Abstract
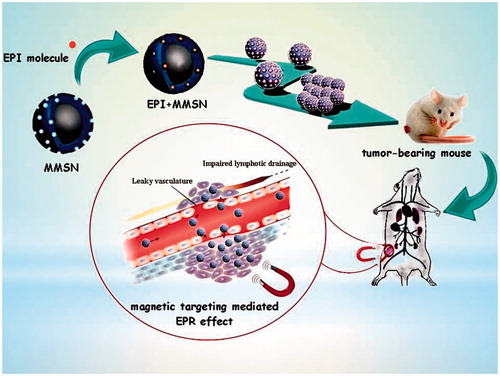
The development of magnetic nanoparticles as delivery carriers to magnetically accumulate anticancer drug in cancer tissue has attracted immense interest. In the present study, magnetic mesoporous silica nanoparticles (MMSNs) with magnetite core and silica shell were synthesized. The obtained MMSNs were characterized by DLS, XRD, FT-IR, TEM and VSM in order to investigate the nanoparticle characteristics. With the focus on in vivo validation of such magnetic drug delivery systems, we selected epirubicin (EPI) as the drug. The anticancer properties of EPI-loaded MMSNs were evaluated in a C-26 colon carcinoma model. Alongside monitoring of drug in the tissues with animal imaging system, the tissue distribution was also determined quantitavely. The average size of MMSNs determined with TEM images was about 18.68 ± 2.31 nm. The cellular uptake test indicated that geometric mean fluorescence intensity (MFI) of cells treated with MMSN + EPI in presence of external magnetic field was increasing 27% compared with free EPI. In addition, treatment with drug-loaded MMSNs with the aid of external magnetic gradient had significantly higher inhibition efficacy towards tumor growth than the free EPI treated mice. The targeted drug delivery through external magnet-attraction using EPI-loaded MMSNs resulted in high tumor cell uptake, which leads to elimination of cancer cells effectively.
Graphical Abstract
Introduction
Magnetic nanoparticles have been extensively used in the area of biomedical applications such as drug targeting, cell sorting and isolation, enzyme immobilization and magnetic resonance imaging [Citation1]. For spherical magnetic nanoparticles when the size of the particles is reduced to sizes below the so-called superparamagnetic (SPM) radius, the domain walls in the nanoparticles are turn down and give rise to single domain particles. Among SPM nanoparticles, the iron oxides are far the most used for biomedicine, since they are much less toxic than their metallic counterparts, and they have high saturation magnetization [Citation2]. In the last decade, increased investigations with various types of iron oxides have been accomplished in the field of magnetic nanoparticles (mostly maghemite, α-Fe2O3 or magnetite, Fe3O4, single domains of about 5–20 nm in diameter), among which magnetite is a very promising candidate as its biocompatibility has already been confirmed [Citation3]. Magnetite is crystallized in a cubic “inverse spinel” structure [Citation4]. Bare superparamagnetic iron oxide nanoparticles (SPIONs) mainly show hydrophilic surface which, due to vandeer Waals, electrostatic or magnetic forces, leads to particle agglomeration. Efforts have been made to alter the properties of SPIONs for specific applications. The biomedical applicability of magnetic nanoparticles is considerably improved by coating their surfaces with biocompatible surfactants, polymers or inorganic materials that can efficiently stabilize these particles [Citation5–7].
Many studies increasingly focused on the design and preparation of inorganic coatings for magnetic nanoparticles to form inorganic magnetic nanocomposites, such as silica, gold, and grapheme [Citation8–10]. In recent years, mesoporous silica nanoparticles (MSNs) are seen as suitable candidates for drug delivery applications due to advantages namely, safety, large surface area, uniform pores and high pore volume that are easily functionalized with biomolecules and targeting ligands thereby enhancing the biocompatibility and treatment efficacy [Citation11,Citation12]. The most well-known and common MSNs include MCM-41, MCM-48 and SBA-15, which present different pore sizes (2–10 nm) and structural characteristics (2D hexagonal and 3D cubic) [Citation13]. The combination of magnetic property with MSNs can endow the resulting composite with multifunctionality including detection, enzyme immobilization, magnetic targeting, hyperthermia therapy and magnetic resonance imaging (MRI) [Citation14–18]. The magnetic nanoparticles are beneficial for both magnetically targeted drug delivery and as excellent contrast agent for MRI, which provides great opportunity for constructing the nanoparticulate theranostic platform for cancer therapy. Moreover, as a physical force, the magnetic stimulation is independent of the complicated tumor physiological microenvironment and the magnetic targeting mediated EPR effect can efficiently and specifically increase the accumulation of magnetic therapeutic agents in the targeted tumor site [Citation19].
In the present study, a novel type of MMSNs with core–shell structure was fabricated and proposed as a drug delivery platform. Superparamagnetic Fe3O4 nanoparticles were incorporated as a core to ensure a strong response for magnetic guided delivery. Then the anticancer drug, epirubicin (EPI), was entrapped in the pores of silica layer deposited over magnetic particle surfaces. The capability of this nanocomposite carrier to load and deliver EPI into the C-26 cancer cells was demonstrated in vitro. The ability of MMSNs in magnetic targeting mediated drug delivery was investigated in vivo.
Materials and methods
Materials
Tetraethylorthosilicate (TEOS) was purchased from Aldrich (St. Louis, MI), Iron (III) chloride hexahydrate, Iron (II) chloride tetrahydrate, ammonium hydroxide solution (NH4OH, 32%), tetramethylammonium hydroxide, cetyltrimethylammonium bromide (CTAB), Triton X-100 solution, and Pluronic F127 were purchased from Sigma (St. Louis, MI). 3–(4,5-Dimethylthiazol-2-yl)-2,5-diphenyltetrazolium bromide (MTT) was purchased from Atocel (Graz, Austria). Cell culture medium RPMI 1640, fetal bovine serum (FBS) and penicillin/streptomycin were purchased from Gibco (Carlsbad, CA). Deionized (DI) water with conductivity 0.055 µS/cm was used in the experiments.
Synthesis of Fe3O4
Fe3O4 nanoparticles were prepared by a modified coprecipitation method. Briefly, FeCl3·6H2O and FeCl2·4H2O were dissolved in degassed water (45 ml) in the ratio 3:1 under argon. Immediately, by quickly adding NH4OH (1 ml) to the solution under gentle mechanical stirring (Stöber, type LR1, Germany, 550 rpm) under argon atmosphere, the Fe3O4 particles is formed [Citation20]. The nanoparticles were separated magnetically from the reaction mixture, washed three times with water and finally dispersed in a mixture of water (35 ml) and tetramethylammonium hydroxide (7 ml) [Citation21].
Synthesis and functionalization of MMSNs
Core-shell magnetic nanoparticles were prepared by alkaline hydrolysis of TEOS in the presence of Pluronic® F127 and Fe3O4 nanoparticles [Citation22]. Briefly, Pluronic® F127 (0.2 g) and CTAB (0.35 g) were dissolved in deionized water (80 ml), and then the ethanol (40 ml) was added under mechanical stirring at room temperature. After a while, Fe3O4 nanoparticles were added and the reaction was continued for another 3 h. Then, NH4OH solution (32%, 1 ml) was added to this mixture. After 30 min, TEOS (500 µl) was added dropwise into the solution. The reaction was stopped after 6 h and the colloids were then centrifuged (30,000g, 15 min) in order to isolate the nanoparticles in the pellet.
Surfactant removal
The pellet was resuspended in ethanol and sonicated 40 min at 60 °C, then centrifuged (30,000g for 15 min) in order to remove all contained CTAB from nanoparticles [Citation23].
Characterization of MMSNs
X-ray powder diffraction (XRD) pattern of both Fe3O4 nanoparticles and MMSNs was performed on a GNR Analytical Instrument (Model: EXPLORER, voltage 40 kV, current 30mA, Italy). Fourier-transform infrared spectroscopy (FT-IR) measurements were carried out to know the chemical interactions in the MMSNs. The KBr pellet of both Fe3O4 nanoparticles and MMSNs was subjected for analysis using FT-IR (Perkin Elmer, Spectrum Two, Waltham, MA) in the range of 400–4000 cm−1. TEM images of the MMSNs samples were obtained on a FEI CM 120 Philips electron microscope (Philips, The Netherlands) operated at 100 kV to characterize the size, shape and structure of nanoparticles. Aqueous suspension of samples was prepared. One droplet of the suspension was deposited on the carbon coated copper grid and analyzed. The magnetic hysteresis of the particles was measured with VSM (7400 Lake Shore, Birmingham, AL) via changing the magnetic field from –20,000 to 20,000 Oe at 25 °C. The iron content of the Fe3O4 nanoparticles was measured with atomic absorption spectrometer (Varian, Spectr AA 240, USA) to determine the yield of iron loading in MMSNs. Nitrogen adsorption–desorption measurements studies were performed on an Autosorb-1 Quantachrome Instrument sorptometer (Quantachrome Instruments, Boynton Beach, FL, USA). Samples were powdered by freeze drying of suspension. Before each measurement, sample was degassed at 120 °C for 10 h, for the removal of contamination and moisture on the surface of MMSNs. The surface area and pore volume were calculated using the Brunauer–Emmett–Teller (BET) and the Barrett–Joyner–Halenda (BJH) methods, respectively [Citation24].
Drug loading and release
The three different MMSN suspension concentrations (1 ml) were mixed with an EPI aqueous solution (2 mg/ml) and stirred under mild agitation at room temperature in dark conditions overnight after which the drug-loaded magnetic nanoparticles were separated from dispersion medium (water) by centrifugation and washed with deionized water to remove free drug molecules. The dispersion medium and washed solutions were collected and analyzed for non-entrapped EPI. For the quantitative determination of the drug, the EPI fluorescence was measured in a microplate reader (Synergy H4 Hybrid, Multi-Mode Microplate Reader, BioTek Instruments Inc., USA) at 488/555 nm, the excitation and emission wavelengths of EPI.
The drug loading capacity (LC) and drug loading efficiency (LE) were calculated as LC(%) = (weight of loaded drug in MMSNs/weight of drug and MMSNs) × 100 and LE (%) = (weight of loaded drug in MMSNs/weight of feeding drug) × 100 [Citation25].
The in vitro release of EPI from the drug-loaded MMSNs (MMSN + EPI) was investigated at several time intervals as cumulative profiles in both phosphate buffered saline (PBS, 0.1 M) with pH 7.4 and succinate buffer (0.1 M) with pH = 5.5 at 37 °C in dark conditions. In addition, the drug release was also evaluated in RPMI-1640 medium supplemented with 30% FBS (RPMI + FBS) to mimic the biological environment. These procedures were carried out as follows: MMSN + EPI were suspended in each buffer or RPMI + FBS (5 ml), in falcon tube. The falcon tubes were placed in a shaker at 37 °C. At regular time intervals, the entire volume of release medium was collected and replaced with the same volume of each buffer. The amount of the drug in the collected release media was determined as described in the previous paragraph.
Cytotoxicity assay
C-26 murine colorectal cancer cells was cultured in RPMI-1640 medium supplemented with heat inactivated FBS (10%), penicillin (100 units/ml) and streptomycin (100 µg/ml). Cells were allowed to grow at 37 °C in an incubator with a humidified atmosphere of 5% CO2 and 95% air. The cytotoxicity of different formulations against C-26 cancer cell line was assessed by using MTT viability assay. Cells were placed in 96-well plates at a density of 5 × 10³ cells/well in complete medium (100 µl) and incubated for 24 h. Then, the cells were incubated with blank nanoparticles, MMSN + EPI in presence (MAG+) or absence (MAG-) of external magnetic field, and free EPI at different concentrations (corresponding to 0.0016–1 µg/ml EPI) for 48 h. Here, for assessing the influence of an external magnetic field in the cytotoxicity of the MMSN + EPI, during the incubation of the cells with MMSN + EPI (MAG+), an external neodymium magnet (NdFeB, surface magnetic field of 0.6 T) was placed below of the plates for 5 h and then was removed [Citation26]. For studying the cytotoxicity of blank nanoparticles, they are used in the same concentrations with those of MMSN + EPI used to generate the different EPI concentrations. After 48 h incubation, the medium was removed and then replaced with fresh medium (180 µl) and MTT solution (20 µl, 5 mg/ml in PBS) and incubated at 37 °C for 3 h. Subsequently after removing the medium, dimethyl sulfoxide (DMSO, 200 µl) was added to dissolve all the cells and MTT formazan. The plates were shaken for 5 min, and the absorbance of the obtained DMSO solution was determined at 570 nm using a microplate reader. The untreated cells were considered as control with 100% viability. The IC50 and the cell viability were computed. The cell viability was calculated as Viability (%) = (Absorbance of each well/Average of absorbance of control wells) × 100 [Citation27].
Cellular uptake
For quantitative determination of cell uptake of the MMSN + EPI, the C-26 cells were seeded in 6-well plates at a density of 3 × 10⁵ per well and incubated overnight. The following day free EPI, MMSN + EPI (MAG-), and MMSN + EPI (MAG+) were added at a concentration of 1 µg/ml and incubated for 2, 4 and 24 h. After incubation, the cells were washed three times with cold PBS, detached with 0.25% trypsin, centrifuged and resuspended in PBS. The average fluorescence intensity per cell was determined by FACSCalibur flow cytometer (BD Biosciences, USA) [Citation28].
Internalization mechanism
To prove the cell internalization of nanoparticles, we determined the cellular EPI content by a fluorimetric technique. For this purpose, C-26 cells were plated at 4 × 10⁴ cells per well in 24-well plates the night before treatment. Cells were stored at 4 °C for 1 h before incubation to harness the endocytosis pathways. Afterwards, the cells were treated with 1 µg/ml free EPI or equimolar concentration of EPI on MMSN-EPI (MAG+) and MMSN-EPI (MAG–) at that temperature for 6 h before cells were washed three times with PBS. Then, cells of each well were lysed in 800 μl HCl 10% and followed by lysate centrifugation at 29,068g [Citation29]. The supernatant was transferred to 96-well dark plates, and the fluorescent of EPI was recorded with microplate reader.
In vivo efficacy
About 6–8 weeks old female BALB/c nude mice were used for all animal experiments. Before cell injection, mice were anesthetized by an i.p. injection of ketamine-xylazine. Subcutaneous tumors were established by injecting 3 × 10⁵ C-26 cells subcutaneously into shaved right flank. When the average tumor size was approximately 20 mm3, mice were sorted into groups of five animals each and treatment was initiated (day 1). The groups were intravenously injected as single bolus through the tail vein. EPI, MMSN + EPI (MAG+) and MMSN + EPI (MAG-) at both doses of 9 and 12 mg EPI/kg, dextrose 5% as control (200 µl) and MMSNs as blank were administrated. MMSN + EPI(MAG+) group was administered in the presence of a static magnetic field gradient generated by a NdFeB disk magnet, which was placed in close proximity over the tumor area for 40 min post-injection [Citation30]. The antitumor activity was evaluated by calculating the tumor volume at different times during the 34-day study duration post-administration until they reached the end point (defined as excessive body weight, loss of >20% or tumor volume of >1000 mm3) for euthanasia [Citation31]. Tumor were measured in three dimensions and tumor volume was calculated using the following formula: tumor volume = (height × length × width) × .5 cm3 [Citation32]. For each mouse, time to reach the end point (TTE) was calculated from the equation TTE = [log(end point) - b]/m, where m and b are the slope and intercept, respectively, of the line gained by linear regression of a log-transformed tumor growth data set consist of the first observation that exceeded the study end point volume and the three following observations that immediately preceded the achievement of the end point volume. Animals that did not attain the end point were assigned a TTE value equal to the last day of the study [Citation33].
Tumor growth delay (TGD) is calculated as TGD % = (mean TTE of treatment group – mean TTE of the control group)/mean TTE of the control group.
For each treatment group, increase the life span (%ILS) was calculated as (mean survival time of treated group/mean survival time of dextrose 5% ×100) – 100 [Citation34].
Animal imaging and biodistribution study
To investigate the tissue biodistibution of MMSN + EPI, when the tumors in mice had reached approximately 125 mm3 in volume, the animals were intravenously injected by free EPI, MMSN + EPI (MAG+) and MMSN + EPI (MAG-) at a dosage of 12 mg EPI/kg. Based on the treatment type and scarification time, the groups include: MMSN + EPI (MAG-) 40 min, MMSN + EPI (MAG-) 12 h, MMSN + EPI (MAG-) 24 h, MMSN + EPI (MAG-) 48 h, MMSN + EPI (MAG+) 40 min, MMSN + EPI (MAG+) 12 h, MMSN + EPI (MAG+) 24 h, MMSN + EPI (MAG+) 48 h, EPI 40 min, EPI 12 h, EPI 24 h, EPI 48 h and control (n = 3). The NdFeB magnet was maintained for 40 min post-injection over the tumor site of mice of MMSN + EPI (MAG+) groups. The mice were sacrificed after 40 min, 12 h, 24 h and 48 h tail vein injection. Tumor tissues and main organs (spleen, heart, kidney, liver and lung) of each group were harvested and collected in the plate and then imaged under the animal imaging system (Kodak, In-Vivo Imaging System F Pro, Rochester, NY, USA). Additionally, for quantitative measurement of EPI, all organs were weighted, then all of them and up to 300 mg of liver were separately placed in 2 ml tubes containing zirconia beads and 1 ml of acidified isopropanol (90% isopropanol/.075 M HCl) and subsequently were homogenized by Mini-Beadbeater-1 (Biospec, Bartlesville, OK). The homogenized tissues were stored at 4 °C overnight to extract the drug. The samples were centrifuged and each supernatant (400 µl) was mixed with acidified isopropanol (1.6 ml). Fluorescence emission from EPI was measured using Fluorescence Spectrometer LS 45 (Perkin Elmer, London, UK) at 488/555 nm. The calibration curve was prepared using serial dilutions of EPI in the acidified isopropanol from 0.1 to 10 µg/ml [Citation35].
Blood analysis
To determine the serum level of total EPI, blood samples of all mice were collected in 1 ml complete blood count (CBC) vials before scarification at four time points of analysis (40 min, 12, 24 and 48 h). The blood was centrifuged at 11,000 rpm for 5 min. 100 µl of each serum sample was transferred to a 2 ml tube containing acidified isopropanol (1900 µl). For drug extraction, the sera were stored at 4 °C overnight. The samples were centrifuged and the fluorescence emission of supernatant was measured using fluorescence spectrometer [Citation36].
Spleen index
C-26 cells were injected subcutaneously and the tumor was allowed to growth. After a week, 15 female BALB/c tumor-bearing mice were divided into 5 groups (n = 3) and injected as follow: free EPI, MMSN + EPI (MAG+) and MMSN + EPI (MAG−) at a dose of 12 mg EPI/kg. Dextrose- and blank MMSN-treated mice were also used as control and blank. On the 20th day of the experiment that the tumor volume of the first mouse reaches to 1000 mm3 all animals were weighted then sacrificed and their spleens were excised. The weight of spleens was determined and the spleen index was calculated as the animal spleen weight (mg) divided by the animal body weight (g) [Citation37]. All the protocols of animal studies were approved by local Ethics Committee.
Statistical analysis
Statistical analysis was performed using GraphPad Prism version 6 (GraphPad software, San Diego, CA). A two-way analysis of variance (ANOVA) was used to analyze the data. Survival data were analyzed by the Log-rank (Mantel-Cox) test. Serum distribution data were analyzed by unpaired t-test. FlowJo 7.6.1 analysis software (Tree Star Inc., Ashland, OR, USA) was utilized for flow cytometry related data analysis. Results were expressed as mean ± standard deviation (SD).
Results and discussion
Synthesis of Fe3O4
Here, we synthesized Fe3O4 nanoparticle by modified coprecipitation method. In general, the particle size of a precipitate is affected by temperature, precipitate solubility, reactant concentration and the rate at which reactants are mixed. The net effect of these variables can be accounted in a single property of the system called relative supersaturation determined as Relative Supersaturation = (Q – S)/S, where Q is the concentration of the solute at any instant and S is its equilibrium solubility.
Experimental evidence reveals that the particle size of a precipitate varies inversely with the average relative supersaturation during the time. Accordingly, we increased the relative supersaturation in order to decrease the size of the nanoparticle. So, we increased Q and decreased S. Q is increased if NH4OH as a precipitant is added quickly. In addition, we used the mechanical stirrer to decrease the mixing rate of reactants. In order to decrease S, the reaction performed at room temperature [Citation38]. With this modified coprecipitation approach, the synthesis time is reduced to only 10 min. Compared to previous works, the time of reaction significantly decreased [Citation39,Citation40].
Synthesis of MMSNs and surfactant removal
Silica coating was performed with a modified Stöber method using TEOS. By varying the concentrations of CTAB, we successfully controlled the silica thickness. As the concentration of CTAB increases, the silica thickness decreases [Citation41]. Moreover, the removal of surfactant was performed by several centrifugation/washing steps.
Characterization of Fe3O4 nanoparticles and MMSNs
Various characterization modalities such as XRD, TEM, VSM and FT-IR were used to confirm the formation processes of Fe3O4 nanoparticle and MMSNs. First, the crystal structure and phase purity of the synthesized Fe3O4 and MMSNs were investigated using XRD. As seen in Supplementary Figure S1 (Supporting Information), the characteristic peaks in the XRD pattern of Fe3O4 sample, corresponding to crystal planes (2 2 0), (3 1 1), (2 2 2), (4 0 0), (4 2 2), (5 1 1), (4 4 0) and (5 3 3) are in good agreement with standard pattern of a crystalline cubic magnetite structure (joint committee on powder diffraction standards (JCPDS) card 01–075-0449). The XRD pattern indicates 100% phase purity of synthesized Fe3O4. For MMSNs, the diffraction peaks are similar to that of the parent Fe3O4 particles, suggesting that the Fe3O4 particles were well retained in the silica matrix. The XRD pattern of MMSNs indicates 60% magnetite phase amount and 40% SiO2 phase amount.
The Fe3O4 formation and the surface coating of silica were confirmed by FT-IR analysis (Supplementary Figure S2, Supporting Information). The strong IR bands at 443, 583 and 608 cm−1, which are the characteristic of the Fe–O vibrations of Fe2+ and Fe3+ ions in octahedral pores and Fe3+ in tetrahedral pores that confirm the preparation of Fe3O4 in inverse spinel structure [Citation42]. After silica coating, the peak of Fe–O slightly shifted to 603 cm−1. Furthermore, there is no more peak around 632 cm−1 observed, which the representative peak for Fe2O3 denoting that the samples are purely magnetite Fe3O4 [Citation43]. The broad absorption band appeared around 1050 cm−1 in Fe3O4/SiO2 core/shell nanoparticles is related to the asymmetric vibration of Si–O–Si bond. In addition, the absorption peak at 950 cm−1 represents Si–OH bond. The peak at 1624 cm−1 attributed to the O–H vibrations of free water molecules. Besides, the broad peak at about 3500–3000 cm−1 attributed to the stretching bend of –OH functional group of chemisorbed water. The FT-IR spectra also indicate the surfactant removal. The bands at 2850 and 2920 cm−1 are related to C–H stretching vibration in CTAB which is disappeared after CTAB removal.
The TEM images together with size distribution histogram of MMSNs are shown in supplementary Figure S3 (Supporting Information). As presented in , spherical structures were observed with a round-shaped Fe3O4 and a thin silica shell. TEM image showed that the MMSNs are about 18.68 ± 2.31 nm.
At room temperature, the absence of hysteresis, immeasurable remanence magnetization (Mr) and coercive force (Hc) indicate the presence of superparamagnetic behavior [Citation44]. Here, the VSM measurements show that Mr and Hc of the uncoated and coated nanoparticles are negligible (Hc = 2G, Mr = 0.15 emu g−1 for Fe3O4 nanoparticles and Hc = 7G, Mr = 0.14 emu g−1 for MMSNs); hence, corroborates the superparamagnetism property of these two type of particles. As shown in supplementary Figure S4 (Supporting Information), the saturating magnetization (Ms) was determined to be 72.359 and 51 emu g−1 for Fe3O4 and MMSNs, respectively.
The iron content of the Fe3O4 nanoparticles was 2.3 mg/ml, which was measured by atomic absorption spectroscopy. It was found that 100 µg/ml of MMSNs contains 62.5 µg/ml Fe. This high Fe content of samples can be advantageous for further in vitro and in vivo studies.
Nitrogen physisorption measurements (Supplementary Figure S5, Supporting Information) show an overall surface area of 695 m2/g, a pore volume of 1.567 cm3/g and a pore diameter of 2.79 nm. Although the surface area and the pore volume are low when compared to mesoporous silica nanoparticles without the Fe3O4 core (typically ∼1000 m2/g and 1 cm3/g, respectively), these values are reasonable when taking into account the inclusion of an Fe3O4 core [Citation24,Citation45].
Drug loading and release
The MMSN solutions of three different concentrations were loaded with EPI by incubating them with EPI solution (2 mg/ml). Under physiologic pH, the driving force for drug loading is the electrostatic interaction between positively charged EPI and negatively charged MMSNs. As shown in EPI loading increased with increasing nanoparticle concentration. This finding may be attributed more to the surface with negative charges to adsorb more positively charged EPI.
Figure 1. (a) Loading capacity of three different MMSN suspension concentrations, (b) drug release in succinate (pH 5.5), phosphate (pH 7.4) and RPMI-1640 medium supplemented with 30% FBS (pH 7.4).
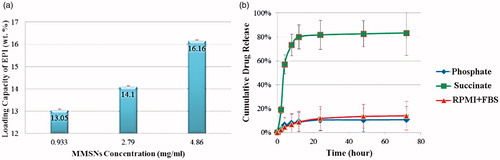
The pH-sensitive release of EPI from MMSNs was assessed by testing the release of EPI in buffer solutions and RPMI contains 30% FBS at pH values of 5.5 and 7.4 to mimic the pH of a tumor site and of normal tissue or blood. The fluorimetry technique was used to indicate the EPI released from the MMSNs sample (). During the 8 h period, less than 10% of the drug was released from the MMSNs at a pH of 7.4 either in phosphate or in RPMI + FBS, while about 73% of the drug was released from nanoparticles at pH of 5.5. EPI molecules could release from nanoparticles in the acidic environment due to the protonation of MMSN-surface silanol groups in the acidic pH; therefore, their interaction with positively charged EPI would weaken, which would consequently lead to the release of the drug [Citation46].
Hemolysis assay
The hemolysis assay was used to evaluate the cytotoxic effect of MMSNs on human red blood cells (RBCs). The highest doses of MMSNs used in this study were relatively equivalent to doses often used for in vivo therapeutic experiments. As shown in Supplementary Figure S6 (Supporting Information), the hemolysis percentage of RBCs increases in a dose-dependent manner. The hemolysis results show that almost no hemolysis of RBCs could be detected in the concentrations ranging in 3.125–100 µg/ml. About 20% of hemolytic activities were distinguished at highest concentrations of 6400 µg/ml, much smaller than those of traditional amorphous silica at lower concentration of 100 µg/ml (44%), demonstrating the excellent blood compatibility of MMSNs [Citation47].
Cell studies
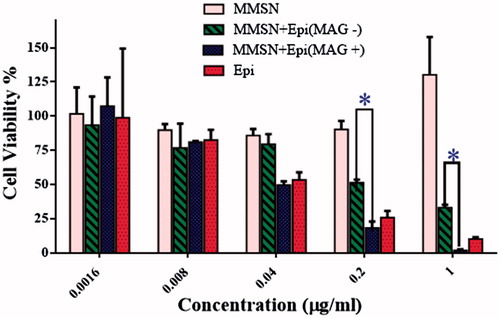
To evaluate the magnetic targeting mediated drug delivery effect, we incubated different formulations with C-26 cells. As shown in , Free EPI and MMSN + EPI (MAG+) exhibited IC50 values of 0.05085 and 0.04589 µg/ml, respectively, which compares well with each other. This result indicates the intense effect of external magnetic field on the uptake of MMSN by cells that later proved by flow cytometry.
Table 1. IC50 of free EPI and MMSN + EPI with or without magnetic field gradient in C-26 cells.
The cytotoxicity of blank MMSNs and MMSN + EPI was also investigated by MTT assay. As shown in , MMSN + EPI (MAG+) exhibited comparable to but even better than free EPI cytotoxicity against the C-26 cancer cells after 48 h. Α significant increase in cytotoxicity was observed in the presence of an external magnet compared to absence of external magnet at concentrations of 0.2 and 1 µg/ml. The cell viability after incubation with 1 µg/ml free EPI was about 10% while the viability is reduced to nearly 2% after incubation with MMSN + EPI (MAG+). The latter may have been the result of increased endocytosis of the MMSNs in the presence of the external magnetic field and then according to our drug release studies, which is described in the previous section, we predicted that the drug is released in the acidity of the endosome and cause the cell death [Citation48].
Figure 2. Cell viability of C-26 cells after treatment with free EPI, MMSN + EPI (MAG+), MMSN + EPI (MAG-) and blank MMSNs (Tukey's multiple comparisons test, p < .0001).
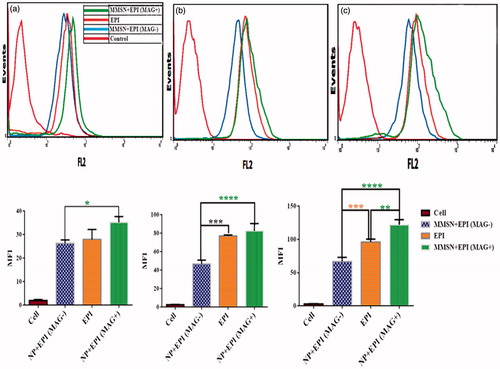
The cellular uptake of free EPI and MMSN + EPI in the presence and absence of an external magnetic field was also investigated for 2, 4 and 24 h after incubation. As shown in , the MFI increased with the time extending for all three treatments. Indeed, the magnetic field gradient significantly increased the cellular uptake of the MMSN + EPI (MAG+) against MMSN + EPI (MAG-) in all evaluated times. The cellular uptake of MMSN + EPI (MAG+) is also significantly higher than free EPI at 24 h. The MFI of the cells treated with MMSN + EPI (MAG+), MMSN + EPI (MAG-) and free EPI were 122.00 ± 7.81, 67.07 ± 6.07 and 96.26 ± 4.24 for 24 h at 37 °C, respectively. It means that MFI of cells treated with MMSN + EPI in presence of external magnetic field is nearly two-fold than that of treated with MMSN + EPI in absence of magnetic field. On the other hand, MFI of cells treated with MMSN + EPI (MAG+) is increasing 27% compared to free EPI. The increase in cell uptake with the presence of external magnetic field indicates that MMSN + EPI are also potentially responsive for use in magnetic targeting applications for destroying cancer cells as well as reduction of side effects.
Figure 3. Above panel: Flow cytometry histogram of C-26 cells after treatment with free EPI, MMSN + EPI (MAG+) and MMSN + EPI (MAG-) and, nontreated cells. The results indicated more internalization of MMSN + EPI (MAG+) into cells compared to EPI-treated group MMSN + EPI (MAG-)-treated group (a: 2h, b: 4h, c: 24h). Bottom panel: In vitro cellular uptake of MMSN + EPI (MAG+), MMSN + EPI (MAG-) and free EPI to C-26 cells at 37 °C. The results expressed as MFI, represented mean ± SD of three independent experiments. *(p < .0001) represents significant differences in cellular uptake of various treatment groups.
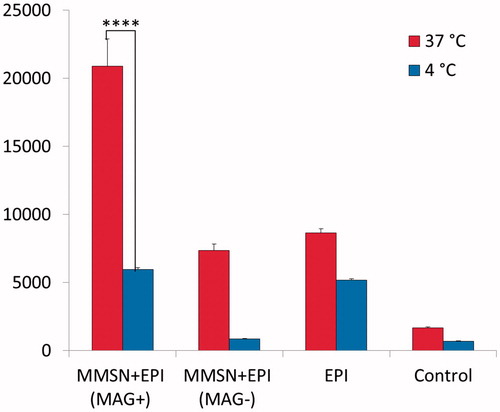
In addition, in order to prove the endocytosis of nanoparticles, cell internalization of MMSN + EPI (MAG-), MMSN + EPI (MAG+) and EPI were examined for 6 h against C-26 cells in both 4 and 37 °C. The internalization of MMSN + EPI (MAG+) at 37 °C is significantly more than internalization at 4 °C and this difference is a three-fold difference (). This result demonstrated that the nanoparticles uptake by endocytosis mechanism is based on the fact that at 10 °C or below, endocytosis is negligible [Citation49]. Besides, the results again revealed that the cellular internalization of MMSN + EPI (MAG+) is significantly higher than free EPI at 37 °C after 6 h.
Figure 4. In vitro cellular internalization of NP + EPI (MAG+), NP + EPI (MAG-) and free EPI to C-26 cells at 4 and 37 °C. The results represented mean ± SD of three independent experiments (Tukey's multiple comparisons test, p < .0001).
Chemotherapy
After in vitro evaluation of the MMSNs cellular uptake and cytotoxicity studies, a 34-day in vivo study was accomplished to investigate the therapeutic efficacy of these formulations. On this basis, nine groups of mice bearing C-26 colon carcinoma were administered drug compound through tail vein injections. The nine groups were divided as follows: Dextrose 5% administration (control), MMSNs (blank) in the same amount as in the MMSN + EPI at both doses of 12 and 9 mg EPI/kg, EPI 12 and 9 mg/kg, MMSN + EPI (MAG+) 12 and 9 mg/kg and, MMSN + EPI (MAG-) 12 and 9 mg/kg. The evolution of tumor size, body weight and survival during therapy were followed as indicators of systemic toxicity. Some key indicators relating to the therapeutic efficacy of treatment groups in mouse model are summarized in including Median survival time (MST), TTE, %TGD and %ILS for each treatment group.
Table 2. Therapeutic efficacy data of MMSN + EPI both in the presence and absence of external magnetic field, and free EPI at two different doses in mice bearing C-26 tumor.
As shown in , EPI group steadily lost weight up to a week after injection at both doses of 12 and 9 mg/kg, while for the MMSN + EPI group mean body weight did not show any downward trend at the dose of 12 mg/kg and a negligible downward trend at the dose of 9 mg/kg, which was recovered 9 days after initiating the dose. As the body weight reduction could be used as the standard for toxicity evaluation, these results indicate that treatments with MMSN + EPI at both 9 and 12 mg/kg were well tolerated and significantly ameliorate the side effects of free EPI [Citation50].
Figure 5. BALB/c mice bearing C-26 colon carcinoma tumor treated with free EPI and MMSN + EPI both in the presence and absence of external magnetic field. Control group was administrated by D 5%; MMSN is as blank; (a, b: mice body weight; a: 12 mg/kg; b: 9 mg/kg; c, d: average tumor volume changes; c: 12 mg/kg; d: 9 mg/kg; e, f: the percent of survival; e: 12 mg/kg; f: 9 mg/kg).
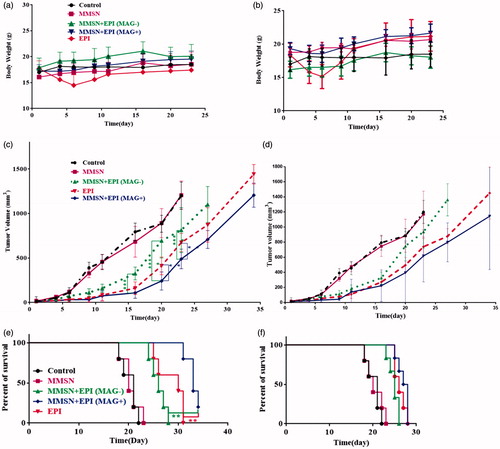
As depicted in , treatment with MMSN + EPI (MAG+) (12 mg/kg) had notably higher inhibition efficacy towards tumor growth than the free EPI treated mice (p < .0001, Tukey's multiple comparisons test). MMSN + EPI (MAG+) 9 mg/kg treatment was also more effective, but not statistically significant in attenuating tumor growth compared to free EPI (). MMSN + EPI (MAG+) at doses of either 9 or 12 mg/kg showed significantly greater tumor growth inhibition compared to dextrose 5%. More importantly, a remarkably enhanced therapeutic effect in tumor suppression for MMSN + EPI (MAG+) with an external magnetic field rather than MMSN + EPI (MAG-) was observed (****p < .0001), suggesting that the magnetic attraction generated by a NdFeB magnet increased the tumor accumulation of MMSN + EPI (MAG+) and probably the in situ pH-sensitive drug release (as we observed in our in vitro studies) was beneficial to enhance antitumor activity and achieve precise therapy. On the other hand, MMSN + EPI (MAG-) also showed significant therapeutic effects on suppressing tumor growth in comparison with that of control after intravenous injection (p < .0001).
The survival results represented in a Kaplan–Meier plot ()) indicated that the treatment with MMSN + EPI (MAG+) at either 9 mg/kg or 12 mg/kg extended mouse survival rate relative to free EPI, MMSN + EPI(MAG-) and dextrose 5%.
Animals treated with MMSN + EPI(MAG-), free EPI and MMSN + EPI(MAG+) at a dose of 12 mg/kg had a median survival time of 26, 30 and 33 days, respectively (). The MST of control group and blank group was 21 and 20 days, respectively. MMSN + EPI (MAG+) at a dose of 12 mg/kg showed significantly greater antitumor activity than free EPI (*p < .0001, Log-rank (Mantel–Cox) test). In fact, the %TGD of MMSN + EPI (MAG+) (12 mg/kg) was 66.33% whereas the %TGD of free EPI and MMSN + EPI(MAG-) at the same dose was 41.58 and 28.71%, respectively. MMSN + EPI (MAG+) (12 mg/kg) treatment resulted in 13.4 days increasing in life span versus control. At the higher dose level (12 mg/kg), MMSN + EPI (MAG+) resulted in complete tumor remission with no recurrence through the completion of the study (day 34) in one treated animal. For MMSN + EPI (MAG-), free EPI and MMSN + EPI(MAG+) at a dose of 9 mg/kg, C-26 tumor-bearing animals survived a mean of 25, 26 and 27 days, respectively. Treatment with MMSN + EPI (MAG+) at 9 mg/kg has not increased the survival of mice compared to mice treated with free EPI at the same dose, but increased the survival of mice compared to mice treated with MMSN + EPI (MAG-) and to control group (* and ***, respectively; p < .0001; Log-rank (Mantel–Cox) test). It is therefore clear that MMSN + EPI at a dose of 12 mg/kg and in the presence of the magnetic field significantly alters the survival time when compared to free EPI at equal doses (p < .0001; Log-rank (Mantel–Cox) test) while MMSN + EPI even at a dose of 12 mg/kg and in the absence of the magnetic field did not improve the therapeutic efficacy of EPI. Based on these results, it could be concluded that although MMSN + EPI (MAG-) did not show a significant body weight loss and therefore decreased the side effects of EPI, it failed to improve the overall therapeutic efficacy, as compared to free drug. After injection, the free EPI circulates in blood vessels freely and reaches to all organs that results in reaching low doses of the drug to therapeutic target. A similar phenomenon is happening to MMSN + EPI (MAG-). In the absence of an external magnetic field, these nanoparticles circulate in the blood inadvertently and EPI can be rapidly released from large pores after injection that leads to the targeting of low doses of the drug to the tumor site. So that, the enhanced permeability and retention (EPR) effect does not occur for MMSN + EPI (MAG-). Accordingly, as shown in the difference of antitumor activity between free EPI and MMSN + EPI (MAG-) is not significant and the survival time is nearly equal for these two groups. Conversely, the high tumor uptake of MMSN + EPI (MAG+) could be attributed to the presence of magnetic attraction force, and such magnetic nanoparticles could accumulate in tumor site, so there is no need for costly modifications with targeting ligands and additional synthetic steps. These results are consistent with the findings of some other studies, which showed enhanced therapeutic efficacy of magnetic nanocarriers as a result of the presence of external magnetic field [Citation16,Citation18,Citation51].
Biodistribution study, blood analysis and animal imaging
The results of biodistribution study clearly indicate that MMSN + EPI are distributed in diverse organs. We studied tissues that are enriched with the reticuloendothelial system (RES), such as the liver, lungs and spleen and non-RES organs, such as the heart and kidney. demonstrates a remarkable difference of these organs between nanoparticle-treated and free EPI-treated mice. The highest concentrations of MMSN + EPI (MAG-) were observed in the liver, lung and spleen but not in kidney and heart, in all time points. This observation suggests that the distribution of the MMSN + EPI without magnetic attraction was consistent with the RES system (). The highest level of EPI is also accumulated in lung and liver in MMSN + EPI (MAG+) group at first time point (40 min), though quickly decreased during 12 h in lung. At the same time, EPI levels in spleens of free EPI injected mice were 3.28-fold higher than those treated with MMSN + EPI (MAG+).
Figure 6. Biodistribution of free EPI and MMSN + EPI both in the presence and absence of external magnetic field at different time points (40 min, 12, 24 and 48 h) in (a) RES organs, (b) non-RES organs, (c) tumor and (d) serum of BALB/c mice bearing C-26 tumor after IV administration of a single dose 12 mg/kg. Data showed as mean ± SD (n = 3). *Represents significant differences of MMSN + EPI (MAG+) compared to free EPI (a, b and c: p-values of <.0001, Newman–Keuls multiple comparisons test. d: p-values of <.05, Unpaired t-test).
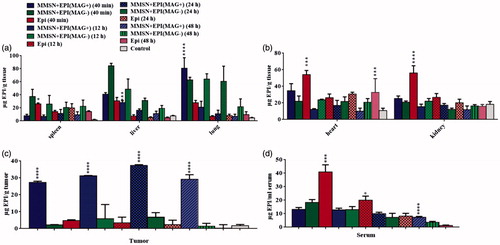
In contrary to the nanoparticle uptake trend in RES organs, in non-RES organs, kidneys and heart, the uptake was significantly lower than that of free EPI. The highest EPI concentration was accumulated in kidney and heart in mice treated with free EPI 40 min post-injection. It is noteworthy that the high accumulation of free EPI in heart is observed even at 48 h after injection ().
As shown in , the significantly increased EPI accumulation in the tumor treated by MMSN + EPI (MAG+) was detected in all time points related to tumors treated by free EPI and MMS + EPI (MAG-). The EPI level in MMSN + EPI (MAG+) and MMSN + EPI (MAG-) groups in tumor tissue has gradually increased up to 24 h post-injection. The EPI level in the free EPI group has gradually decreased as there is almost no EPI in the tumor site after 48 h. This regular incremental trend of EPI level in the nanoparticular form of drug could be attributed to magnetic targeting mediated EPR effect and release of drug in the acidic tumor microenvironment, which results in the improved anticancer efficacy that is obtained by a chemotherapy test [Citation52]. In mice treated with MMSN + EPI (MAG+), the concentration of EPI in tumor was higher than all other tissues at 24 h after injection. At 40 min post-injection, concentration of EPI in tumor for MMSN + EPI (MAG+) was 12.44- and 5.78-fold greater than MMSN + EPI (MAG-) and free EPI, respectively. This appropriate magnet-attraction of MMSN + EPI can attributed to high iron content of these nanoparticles and subsequently to enhancement of nanocarriers uptake by tumor cells in the presence of the magnetic field, as we observed in our in vitro studies.
The total EPI concentration in serum at 40 min, 12, 24 and 48 h after treatment with free EPI, MMSN + EPI with and without magnetic field are shown in . The serum concentration of EPI in free EPI group was significantly higher than two other nanoparticle groups (Unpaired t-test, p-values < .05) after 40 min, whereas after 12 h, it is almost decreased to half. This observation is compatible to the fact that after IV administration, there is triexponential decay of EPI from plasma, with median half-lives of 3.2 min, 1.2 h and 32 h for each phase [Citation53]. Conversely, nanoparticular forms showed low serum concentration of EPI, from the beginning, and showed a slower decrease trend as at time point of 48 h the EPI level of MMSN + EPI (MAG+) is significantly higher than that of free EPI. The longer blood circulation time of MMSN + EPI (MAG+) resulted in the high tumor uptake of MMSN + EPI (MAG+) via the EPR effect even after removing of magnet from the tumor surface [Citation54,Citation55].
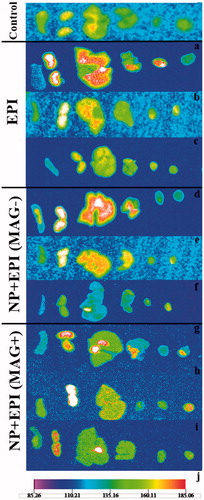
The superior therapeutic effect of MMSN + EPI (MAG+) was also substantiated by the animal imaging. As shown in , MMSN + EPI (MAG+) appearing as red dots accumulates in lung, liver and tumor tissues, while it is not seen in heart and spleen tissues. Kidney tissue remarkably has high fluorescent level, while we note biodistribution results, it is observed that even in the control group, the fluorescence of kidney is relatively high, and so it cannot be attributed to the high level of EPI in this organ. These observations also suggest that the tail vein injection of MMSN + EPI (MAG+) leads to magnetical delivery of the nanoparticles into tumor tissues as well as nonspecific uptake by the Kupffer cells in the liver and monocytes in the lung.
Figure 7. Tissue images of female BALB/c mice bearing C-26 colon carcinoma tumor after i.v. administration of a single dose of 12 mg/kg of free EPI and MMSN + EPI both in the presence and absence of external magnetic field. The organs from right to left are: spleen, kidney, liver, lung, heart and tumor. The control is dextrose-treated mouse. a, b and c: the mice sacrificed 40 min, 24 and 48 h post-injection of free EPI. d, e and f: the mice sacrificed 40 min, 24 and 48 h post-injection of MMSN + EPI in the absence of magnetic field. g, h and i: the mice sacrificed 40 min, 24 and 48 h post-injection of MMSN + EPI in presence of magnetic field. j: the below scale which indicates the fluorescence intensity. Red color indicates the highest fluorescent.
Spleen index
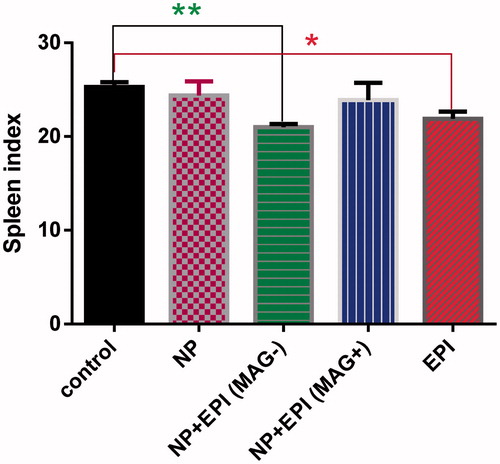
The toxicity reduction monitoring can be corroborated by the spleen index values. As it is shown in , the spleen index was significantly lower in the free EPI group and MMSN + EPI (MAG-) than in the control group (Tukey's multiple comparisons test). In contrast, spleen indices in the MMSN + EPI (MAG+) and blank MMSN were nearly identical with the control group. As the spleen index could be used as the benchmark for toxicity evaluation, no decrease of this parameter in MMSN + EPI (MAG+) group further confirmed the favorable biocompatibility and high tolerance of the mice for the MMSN + EPI; it could be suggested that higher dose and/or more frequent administration of particular EPI, along with AC magnetic field triggered drug release (not being exploited in this study) could offer further enhancement in therapeutic activity in future studies.
Figure 8. Spleen index of mice sacrificed at 20th day of the experiment. The mice were administrated by 12 mg/kg of free EPI and MMSN + EPI both in the presence and absence of external magnetic field (∗p < .05, Tukey's multiple comparisons test).
Conclusions
In summary, we attempted to deliver magnetic mesoporous silica nanoparticles which possessed well-defined pore structures loading EPI, to the tumor site with the aid of external magnetic force. These nanoparticles revealed the suitable size, low systemic toxicity, magnetic responsiveness and high tumor cell uptake. The hemolysis assay and cell studies have been confirmed the safety of the nanoparticles. The targeted drug delivery through external magnet-attraction resulted in high tumor cell endocytosis. Subsequently, tumor passive homing of nanoparticles via the EPR effect has enhanced the treatment efficacy. Our study shed light on an interesting targeting strategy in cancer treatment based on magnetical delivery of a superparamagnetic nanoparticle to the tumor site.
Supporting_information.docx
Download MS Word (1.7 MB)Disclosure statement
No potential conflict of interest was reported by the authors.
Additional information
Funding
Related Research Data
References
- Cheng F-Y, Su CH, Yang YS, et al. Characterization of aqueous dispersions of Fe3O4 nanoparticles and their biomedical applications. Biomaterials. 2005;26:729–738.
- Schwertmann U, Cornell RM. Iron oxides in the laboratory: preparation and characterization. Germany: John Wiley & Sons; 2008.
- Kostiner E. Schwert-Mann U,Cornell RM. Iron oxides in the laboratory. New York: VCH Publishers; 1991 p. 137. J Solid State Chem. 1992;98:442.
- Benitez M, Mishra D, Szary P, et al. Structural and magnetic characterization of self-assembled iron oxide nanoparticle arrays. J Phys Condens Matter. 2011;23:126003–126014.
- Ulman A. Formation and structure of self-assembled monolayers. Chem Rev. 1996;96:1533–1554.
- Salzman E. Polyethleneglycol oxide as a biomaterial. Am J Soc Artif Intern Organs. 1983;6:60–72.
- Yu J-H, Lee CW, Im SS, et al. Structure and magnetic properties of SiO2 coated Fe2O3 nanoparticles synthesized by chemical vapor condensation process. Rev Adv Mater Sci. 2003;4:55–59.
- Villanueva A, Presa P De La, Alonso JM, et al. Hyperthermia HeLa cell treatment with silica-coated manganese oxide nanoparticles. J Phys Chem C. 2010;114:1976–1981.
- Reddy LH, Arias JL, Nicolas J, et al. Magnetic nanoparticles: design and characterization, toxicity and biocompatibility, pharmaceutical and biomedical applications. Chem Rev. 2012;112:5818–5878.
- Sasikala ARK, Thomas RG, Unnithan AR, et al. Multifunctional nanocarpets for cancer theranostics: remotely controlled graphene nanoheaters for thermo-chemosensitisation and magnetic resonance imaging. Sci Rep. 2016;6:20543.
- Sadeghnia HR, Zoljalali N, Hanafi-Bojd MY, et al. Effect of mesoporous silica nanoparticles on cell viability and markers of oxidative stress. Toxicol Mech Methods. 2015;25:433–439.
- Singh N, Karambelkar A, Gu L, et al. Bioresponsive mesoporous silica nanoparticles for triggered drug release. J Am Chem Soc. 2011;133:19582–19585.
- Yang P, Gai S, Lin J. Functionalized mesoporous silica materials for controlled drug delivery. Chem Soc Rev. 2012;41:3679–3698.
- Portilho FL, Helal-Neto E, Cabezas SS, et al. Magnetic core mesoporous silica nanoparticles doped with dacarbazine and labelled with 99mTc for early and differential detection of metastatic melanoma by single photon emission computed tomography. Artif Cells Nanomed Biotechnol. 2018;46:1–8.
- Gupta MN, Kaloti M, Kapoor M, et al. Nanomaterials as matrices for enzyme immobilization. Artif Cells Nanomed Biotechnol. 2011;39:98–109.
- Voulgari E, Bakandritsos A, Galtsidis S, et al. Synthesis, characterization and in vivo evaluation of a magnetic cisplatin delivery nanosystem based on PMAA-graft-PEG copolymers. J Control Rel. 2016;243:342–356.
- Ansari L, Malaekeh-Nikouei B. Magnetic silica nanocomposites for magnetic hyperthermia applications. Intl J Hyperthermia. 2017;33:354–363.
- Chen W-H, Luo GF, Lei Q, et al. Rational design of multifunctional magnetic mesoporous silica nanoparticle for tumor-targeted magnetic resonance imaging and precise therapy. Biomaterials. 2016;76:87–101.
- Li Z, Yin S, Cheng L, et al. Magnetic targeting enhanced theranostic strategy based on multimodal imaging for selective ablation of cancer. Adv Funct Mater. 2014;24:2312–2321.
- Liu Y, Yin J-J, Nie Z. Harnessing the collective properties of nanoparticle ensembles for cancer theranostics. Nano Res. 2014;7:1719–1730.
- Tada DB, Vono LLR, Duarte EL, et al. Methylene blue-containing silica-coated magnetic particles: a potential magnetic carrier for photodynamic therapy. Langmuir. 2007;23:8194–8199.
- Kaiser R, Miskolczy G. Magnetic properties of stable dispersions of subdomain magnetite particles. J Appl Phys. 1970;41:1064–1072.
- Jabariyan S, Zanjanchi MA. A simple and fast sonication procedure to remove surfactant templates from mesoporous MCM-41. Ultrasonics Sonochem. 2012;19:1087–1093.
- Hurley KR, Ring HL, Etheridge M, et al. Predictable heating and positive MRI contrast from a mesoporous silica-coated iron oxide nanoparticle. Mol Pharmaceutics. 2016;13:2172–2183.
- Yahya Hanafi-Bojd M, Jaafari M Reza, Ramezanian N, et al. Co-delivery of epirubicin and siRNA using functionalized mesoporous silica nanoparticles enhances in vitro and in vivo drug efficacy. CDD. 2016;13:1176–1182.
- Liu Q, Zhang J, Xia W, et al. Magnetic field enhanced cell uptake efficiency of magnetic silica mesoporous nanoparticles. Nanoscale. 2012;4:3415–3421.
- Hanafi-Bojd MY, Ansari L, Mosaffa F, et al. The effect of mesoporous silica nanoparticles loaded with epirubicin on drug-resistant cancer cells. Nanomed J. 2017;4:135–141.
- Mosallaei N, Jaafari MR, Hanafi-Bojd MY, et al. Docetaxel‐loaded solid lipid nanoparticles: preparation, characterization, in vitro, and in vivo evaluations. J Pharmaceut Sci. 2013;102:1994–2004.
- Fang C, Kievit FM, Veiseh O, et al. Fabrication of magnetic nanoparticles with controllable drug loading and release through a simple assembly approach. J Control Rel. 2012;162:233–241.
- Cividalli A, Cruciani G, Livdi E, et al. Greater antitumor efficacy of paclitaxel administered before epirubicin in a mouse mammary carcinoma. J Cancer Res Clin Oncol. 1998;124:236–244.
- Farokhzad OC, Cheng J, Teply BA, et al. Targeted nanoparticle-aptamer bioconjugates for cancer chemotherapy in vivo. Proc Natl Acad Sci. 2006;103:6315–6320.
- Arabi L, Badiee A, Mosaffa F, et al. Targeting CD44 expressing cancer cells with anti-CD44 monoclonal antibody improves cellular uptake and antitumor efficacy of liposomal doxorubicin. J Control Rel. 2015;220:275–286.
- Schluep T, Hwang J, Cheng J, et al. Preclinical efficacy of the camptothecin-polymer conjugate IT-101 in multiple cancer models. Clin Cancer Res. 2006;12:1606–1614.
- Huang SK, Mayhew E, Gilani S, et al. Pharmacokinetics and therapeutics of sterically stabilized liposomes in mice bearing C-26 colon carcinoma. Cancer Res. 1992;52:6774–6781.
- Amin M, Badiee A, Jaafari MR. Improvement of pharmacokinetic and antitumor activity of PEGylated liposomal doxorubicin by targeting with N-methylated cyclic RGD peptide in mice bearing C-26 colon carcinomas. Intl J Pharmaceut. 2013;458:324–333.
- Huang Z, Jaafari MR, Szoka FC. Disterolphospholipids: nonexchangeable lipids and their application to liposomal drug delivery. Angew Chem Int Ed. 2009;48:4146–4149.
- Su X, Dong C, Zhang J, et al. Combination therapy of anti-cancer bioactive peptide with Cisplatin decreases chemotherapy dosing and toxicity to improve the quality of life in xenograft nude mice bearing human gastric cancer. Cell Biosci. 2014;4:7.
- Skoog DA, West DM, Holler FJ, et al. Fundamentals of analytical chemistry. USA: Nelson Education; 2013.
- Thakur D, Deng S, Baldet T, et al. pH sensitive CdS–iron oxide fluorescent–magnetic nanocomposites. Nanotechnology. 2009;20:485601.
- Xue S, Wang Y, Wang M, et al. Iodinated oil-loaded, fluorescent mesoporous silica-coated iron oxide nanoparticles for magnetic resonance imaging/computed tomography/fluorescence trimodal imaging. Intl J Nanomed. 2014;9:2527.
- Niu C, Song Q, He G, et al. Near-infrared-fluorescent probes for bioapplications based on silica-coated gold nanobipyramids with distance-dependent plasmon-enhanced fluorescence. Anal Chem. 2016;88:11062–11069.
- Jitianu A, Raileanu M, Crisan M, et al. Fe3O4–SiO2 nanocomposites obtained via alkoxide and colloidal route. J Sol-Gel Sci Technol. 2006;40:317–323.
- Abbas M, Torati SR, Lee CS, et al. Fe3O4/SiO2 core/shell nanocubes: novel coating approach with tunable silica thickness and enhancement in stability and biocompatibility. J Nanomed Nanotechnol. 2014;5:1–8.
- Figuerola A, Corato R Di, Manna L, et al. From iron oxide nanoparticles towards advanced iron-based inorganic materials designed for biomedical applications. Pharmacologic Res. 2010;62:126–143.
- Hanafi-Bojd MY, Jaafari MR, Ramezanian N, et al. Surface functionalized mesoporous silica nanoparticles as an effective carrier for epirubicin delivery to cancer cells. Eur J Pharmaceut Biopharmaceut. 2015;89:248–258.
- Knežević NŽ, Milenković S, Jović D, et al. Fullerenol-capped porous silica nanoparticles for pH-responsive drug delivery. Adv Mater Sci Engg. 2015;2015:567350.
- Chen Y, Chen H, Zeng D, et al. Core/shell structured hollow mesoporous nanocapsules: a potential platform for simultaneous cell imaging and anticancer drug delivery. ACS Nano. 2010;4:6001–6013.
- Prijic S, Scancar J, Romih R, et al. Increased cellular uptake of biocompatible superparamagnetic iron oxide nanoparticles into malignant cells by an external magnetic field. J Membrane Biol. 2010;236:167–179.
- Weigel P, Oka J. Temperature dependence of endocytosis mediated by the asialoglycoprotein receptor in isolated rat hepatocytes. Evidence for two potentially rate-limiting steps. J Biologic Chem. 1981;256:2615–2617.
- Tuscano JM, Martin SM, Ma Y, et al. Efficacy, biodistribution, and pharmacokinetics of CD22-targeted pegylated liposomal doxorubicin in a B-cell Non–Hodgkin's lymphoma xenograft mouse model. Clin Cancer Res. 2010;16:2760–2768.
- Shao D, Li J, Zheng X, et al. Janus “nano-bullets” for magnetic targeting liver cancer chemotherapy. Biomaterials. 2016;100:118–133.
- Wang C, Sun X, Cheng L, et al. Multifunctional theranostic red blood cells for magnetic‐field‐enhanced in vivo combination therapy of cancer. Adv Mater. 2014;26:4794–4802.
- Robert J. Clinical pharmacokinetics of epirubicin. Clin Pharmacokinetics. 1994;26:428–438.
- Dong K, Liu Z, Li Z, et al. Hydrophobic anticancer drug delivery by a 980 nm laser‐driven photothermal vehicle for efficient synergistic therapy of cancer cells in vivo. Adv Mater. 2013;25:4452–4458.
- Cao T, Yang Y, Sun Y, et al. Biodistribution of sub-10 nm PEG-modified radioactive/upconversion nanoparticles. Biomaterials. 2013;34:7127–7134.