
 ?Mathematical formulae have been encoded as MathML and are displayed in this HTML version using MathJax in order to improve their display. Uncheck the box to turn MathJax off. This feature requires Javascript. Click on a formula to zoom.
Abstract
The objective of the present study was to prepare and characterized de-esterified tragacanth-chitosan nanoparticles (DET-CS NPs) as a novel carrier for methotrexate, with a view to improve drug efficacy and target ability. The preparation process was optimized using Taguchi design. NPs were characterized for size, zeta potential, morphology, thermal stability, loading efficiency, cytotoxicity and cellular uptake. Taguchi design indicated that the molecular weight of chitosan possessed the most effect on the zeta potential, PDI, and zeta deviation, and the size of nanoparticles was significantly affected by the DET concentration. The size and zeta potential of drug loaded nanoparticles at optimum condition were 322.9 ± 26 nm and 17.3 ± 5.73 mV, and thermal analysis indicated ionic bond between DET and CS in NPs. The loading efficiency was 20.32% ± 2.01, and the sustained release was observed within nine days. The IC50 was 280 µg/mL in HT-29, and the mitochondrial membrane potential in HT-29 was reduced more than that in MCF-7. The uptake of NPs in HT-29 was higher than that in MCF-7, and active endocytosis was the key mechanism of uptake. These phenomena altogether make DET-CS NPs a proper choice for targeted drug delivery to cells containing asialoglycoprotein receptors.
1. Introduction
Cancer nano-therapeutics are one of growing field of drug delivery, which use nanoparticles as controlled release reservoirs and eliminates the limitations of conventional cancer therapy. Cancer nano-therapeutics systems capabilities include fewer side effects, tumor targeting improvement and cellular uptake promotion [Citation1,Citation2]. Although cancer nanotherapeutics still has some problems such as stability of nanoparticles in physiologic media and challenges associated with the size of the nanoparticles, Enhanced Permeation and Retention (EPR) effect and proper performance of nanoparticles in passive targeting make cancer nanotherapeutics as promising tools for cancer therapy [Citation1].
Among the various types of nanoparticles applied for drug delivery systems, nano-hydrogels are one of the promising systems in the field of drug delivery. Porous molecular structure, high hydrophilicity and small size of nanogels are some of the advantages which made them suitable for the active and passive drug delivery systems [Citation3,J. Citation4]. Medical and pharmaceutical applications of nano-hydrogels depend on their structural properties, and these properties are dependent on the nature of constructive polymers [Citation3]. Hydrogels show great biocompatibility due to water molecules associated with their structure and have so many applications in medical and pharmaceutical uses [Citation1,Citation3]. The combination of hydrogels advantages with the nano-particle characteristics have made the nano-hydrogels as a promising drug delivery system [Citation5].
Gum tragacanth is an acidic heteropolysaccharide, which is comprised of an acidic water-swellable major component, bassorin, and a water-soluble component, tragacanthin. Tragacanth, as a natural gum, has the mentioned advantages for biopolymers but has the limitations of low water solubility and the possibility of forming only weak water-insoluble gels. In order to overcome these typical limitations of tragacanth, de-esterified tragacanth (DET) has been prepared by Fattahi et al. [Citation2]. DET is a water-soluble analog of tragacanth gum that contains a highly branched, high molecular weight de-acetylated tragacanthic acid. It possesses the ability to form stable gels by the ionotropic complex with positive charge polymers like chitosan and cationic metal ions such as zinc and iron [Citation2,Citation6]. Regarding the properties of DET, it could be a proper polymer to produce hydrogels with complex coacervation process together with a positively charged polymer e.g. chitosan.
Chitosan as second abundant, biocompatible, bacteriostatic, fungistatic and anticholesteremic natural polymer is mostly obtained from crustacean shells. Amine groups on this copolymer are protonated in most of the physiologic liquids and form positive charges, and the percentage of acetylated monomers in the copolymer backbone determines solubility and conformation of chitosan in the aquatic environment [Citation7].
Producing nanoparticles by coacervation from this copolymer requires no dangerous solvent or harsh synthetic conditions from temperature and pressure point of view [J. Citation4]. It shows pH-dependent behavior in solution and interesting biopharmaceutical properties such as muco-adhesiveness and opening the tide junctions of epithelial cells [Citation7].
DET properties e.g. stability in acidic media and high temperatures, good surface activity, the existence of focus and xylose on side chains which improves cell adhesiveness and cell targeting [Citation2] together with chitosan properties, raise hopes for coacervation producing of nano-hydrogels for drug delivery.
Methotrexate (2,4-diamino- N10- methyl propyl glutamic acid) which is an analog of folic acid [Citation8] has a high affinity for binding to the dihydrofolate reductase enzyme and reduces the production of tetrahydrofolate by inhibiting this enzyme. Synthesis of purines and adenosine decreases in this way, and synthesis of DNA and RNA reduces accordingly. This mechanism causes the widespread application of this drug for treatment of breast cancer, acute leukemia, choriocarcinoma, solid tumors, hematologic malignancies and autoimmune disease [Citation8]. However, some pharmacokinetic weaknesses such as short plasma half-life, low permeability and poor aqueous solubility besides large side effects have influenced on the treatment by this drug [Citation1]. These weaknesses have made methotrexate a good candidate for progressive investigations in drug delivery. Different drug delivery systems e.g. multi particular system, controlled release carriers, drug conjugates and magnetic nanoparticle conjugates were used for reduction of side effects and enhancement of MTX bio-availability [Citation9,Citation10]. Some of these approaches have faced to many challenges such as carrier toxicity, absence of stability in physiological environment, reproducibility, low loading efficacy and costly chemical synthesis of based materials for carriers [Citation11,Citation12,Citation13,Citation14].
In the present study, tragacanth-chitosan nanoparticles (DET-CS NPs) containing MTX were produced by complex coacervation method. Base of our best knowledge, it is the first time that DET-CS nano-hydrogel had been applied for anti-cancer drug delivery. In order to optimize and control complex coacervation method, which has various accidental parameters, Taguchi experimental design was applied to determine the effect of each parameter on nanoparticle properties. The size, zeta potential and the amount of drug loading were optimized. The cytotoxicity of NPs was evaluated by MTT and MMP assays and the uptake pathway of DET-CS NPs was determined using fluorescein isothiocyanate (FITC) labeled chitosan.
2. Material and methods
2.1. Materials
The ribbon type tragacanth was purchased from local market of Isfahan, Iran. Five and ten kDa chitosans were supplied by Yuhuan Marine Biochemistry co., Ltd., Zhejiang, China, and high molecular weight (>800 kDa) chitosan was purchased from Atocel, Austria. Methotrexate was from Sobhan Oncology Co., Iran. All the other compounds were in analytical grade (Sigma-Aldrich) and were used without further purification.
2.2. Methods
2.2.1. Experimental design using taguchi method
An experimental design using Taguchi method was applied to investigate how different parameters affect the process quality and determine the factors that play the most significant role in product quality with a minimum amount of experimentation, thus improve the performance with lower costs and save time. Taguchi design array, based on the fractional factorial design, divides the independent variables into controllable (capable of being controlled) and uncontrollable or noise variables (may not be easily controlled in actual conditions, but can be controlled in testing conditions). Taguchi method aims to examine the effect of these two groups of variables on quality of products and provides a simple, efficient and systematic approach to optimal design of experiments. This method uses orthogonal arrays, based on the factorial design to lay out the experiments. Two orthogonal arrays are suggested in each experimental design, which are identified as inner and outer matrices. The inner and outer matrices specify factor-level combinations and effects of controllable and noise variables, respectively. The minimum number of experiments could be calculated according to following equation:
Where N is the number of experiments, L is the number of levels, and P is the number of parameters.
In the present study, DET-CS nanoparticles containing MTX was produced, and temperature and pH were kept constant at 27 °C and 5.8, respectively. The CS/DET ratio (w/w) was also fixed at 5:4. Three controllable parameters (DET solution concentration (w/v%), chitosan molecular weight (MW), and MTX/DET ratio (w/w)) were chosen and were introduced to Taguchi model. Considering three levels for each parameter, a set of experiments (9 designed experiments) was suggested by the model. The variation levels for process parameters used in this study are shown in .
Table 1. The controllable parameters and their variation levels.
Statistical analysis was performed by Minitab (Ver. 17.3.1), and the arrangement of controllable parameters was determined according to variation of signal to noise ratio. Then, one-way ANOVA followed by Tukey’s test was employed to obtain accuracy of Taguchi results for optimal levels and to analyze the effect of production process’s parameters on MTX loaded DET-CS nanoparticle characteristics (Size, PDI, Zeta potential and Zeta deviation) with confidence level of p ≤ .05.
2.2.2. Preparation of MTX loaded DET-CS nanoparticles
DET was prepared by de-esterification of tragacanth gum, based on the method applied by Fattahi et al. [Citation2]. DET was dissolved in DI water to obtain different concentrations of DET solution (0.05, 0.01, and 0.005 w/v%). Chitosan with three different molecular weights (5, 10, and >800 kDa) was dissolved in the solution containing DI water and acetic acid (1 v/v%), to obtain the concentration of 0.5% (w/v) for each solution. The MTX solution was diluted with DI water to achieve the 1% (v/v) MTX solution. Then, the MTX solution was added to the under stirring DET solution to obtain the MTX-DET solutions with different MTX/DET ratios of 1:5, 1:10, 1:15 (w/w). The chitosan solutions with different molecular weights were added dropwise to each MTX-DET solution. The prepared nanoparticles were stirred for 10 min at room temperature (25 °C) and then were centrifuged (Beckman-coulter optima L-90 k., USA) for 20 min at 20000 rpm, and nanoparticles were precipitated.
2.2.3. Nanoparticles characterization
2.2.3.1. Measurement of size, polydispersity index, and zeta potential of nanoparticles
In order to determine the particle size, polydispersity index, and surface charge (zeta potential) of nanoparticles, the precipitated nanoparticles were dispersed in 1 ml DI water and these characteristics were assessed using a Zetasizer (Zetasizer, Nano-ZS Malvern Instrument Ltd., Worcestershire, UK). The measurements were carried out using the red laser at a wavelength of 632.8 nm and at 25 °C. All the experiments (suggested by Taguchi method) have been repeated three times, and the characteristics were measured to assure the accuracy and repeatability of the results.
2.2.3.2. Loading and release study
To carry out the loading study, the drug loaded DET-CS nanoparticles were centrifuged at 20000 rpm for 20 min at 4 °C. The drug loaded nanoparticles were precipitated, and the supernatant was collected. The unloaded MTX in the supernatant was measured using UV spectrophotometer (Shimadzu, 1240 UV-Vis., Japan) at 303 nm. The calibration curve was prepared, and the amount of unloaded drug was calculated using standard curve. After calculating the amount of unloaded drug, the loading of MTX in nanoparticles and loading efficiency were determined as follows:
(1)
(1)
(2)
(2)
The in vitro release of MTX from nanoparticles was examined during 384 h. The nanoparticles were centrifuged at 20000 rpm for 20 min at 4 °C. The precipitated nanoparticles were freeze-dried using freeze-dryer (Christ, Alpha 2–4 LD plus, Germany) at −80 °C. Then, 10 mg of each sample was dispersed in 2.5 ml phosphate buffer (pH 7.4) and was placed in a dialysis membrane bag (cut-off eight kDa). The whole bag was sunk in 100 ml of release medium (phosphate buffer, pH 7.4) positioned in the incubator (Kuhner, Lab-Term., Switzerland) at 120 rpm and 37 ± 0.2 °C. At predetermined time intervals, 1 ml of release medium was withdrawn and replaced by one mL of fresh medium. The amount of MTX in withdrawn samples at different time intervals was determined using UV-vis spectrophotometer at 303 nm. All release experiments were repeated three times. The cumulative release percentage at specific times was calculated as follows:
(3)
(3)
2.2.3.3. Thermal Gravimetric Analysis (TGA)
In order to study the thermal properties and thermal stability of MTX loaded nanoparticles, Thermal Gravimetric Analysis (TGA) was performed on Shimadzu, TGA 50H, Japan. 10 g of each sample was placed on an aluminum pan. The temperature range was raised up to 600° C at a ramp of 10 °C/min with nitrogen as purge gas (with the flow rate of 30 ml/min).
2.2.3.4. Morphological study using Transmission Electron Microscope (TEM)
The morphology and structure of obtained nanoparticles at optimum conditions were observed by TEM microscope. The nanoparticle suspension was placed on a carbon-coated copper grid and dried at room temperature. The TEM images were obtained using a Zeiss-EM10C TEM (−80 KV, Germany).
2.2.4. Cell culture conditions
MCF-7 (a human breast cancer cell line) and HT-29 (a human colon adenocarcinoma cell line) were purchased from the Pasteur Institute in Iran. They were cultured in 25 cm2 culture flasks using DMEM (Gibco, Germany) supplemented by 10% (v/v) FBS (fetal bovine serum) and penicillin/streptomycin (100 U/mL, 100 mg/mL) at 37 °C in a humidified atmosphere of 5% CO2. The cells were sub-cultured regularly using trypsin– ethylenediaminetetraacetic acid (EDTA) solution (Ben Yakhte, Iran). The growth medium was changed every 2–3 days, and cells were subcultured until the time of use.
2.2.5. Cell viability assay
Cellular toxicities of MTX, MTX loaded DET-CS NPs, and DET-CS NPs were analyzed in HT-29 and MCF-7 cells using MTT method. Cells were plated into 96-well plates at a density of 2.0 × 10⁴ cells/mL and in a volume of 200 µL. One day after seeding, 20 µL of the free or loaded MTX at different concentrations was added to each well. After 24 or 72 h, 20 µL of MTT (5 mg/mL) was added to each well, and the plate was incubated for three h. Then, the medium was removed by aspiration, and the reduced MTT dye was solubilized with DMSO (150 µL/well). Absorbance was determined on an ELISA plate reader (H1M, BioTek Co., USA) with a test wavelength of 540 nm and a reference wavelength of 630 nm to obtain sample signal (OD540–OD630). Percentage of viability was calculated using the following formula [Citation15]:
(4)
(4)
All the experiments were repeated three times.
2.2.6. Measurement of mitochondrial membrane potential
Mitochondrial dysfunction has been shown to participate in the induction of apoptosis. In this study, mitochondrial membrane potential (MMP) was measured using rhodamine 123 fluorescent dye. Depolarization of MMP during cell apoptosis results in the loss of rhodamine 123 from the mitochondria and a decrease in intracellular fluorescence intensity. HT-29 and MCF-7 cells (1 × 10⁵ cells/well) were seeded in 24-well plates (NEST, China) 24 h before experiments. Cells were treated with MTX, and MTX loaded DET-CS nanoparticle at IC50 concentration in the culture medium at 37 °C for 48 h, then cells were incubated with rhodamine 123 for 30 min at 37 °C. Cells were washed three times with PBS and were lysed for one h on ice with lysis buffer (1% Triton X-100 in PBS). The fluorescence was measured at an excitation wavelength of 488 nm and an emission wavelength of 520 nm using a fluorescence microplate reader (H1M, BioTek Co., USA). The mean fluorescence intensity was normalized to the amount of protein present in the sample using Bradford assay [Citation16].
2.2.7. Cellular uptake assay
In vitro cellular uptake test was performed using fluorescent spectroscopy method. HT-29 and MCF-7 cells (5 × 10⁴ cells/well) were seeded in 24-well plates, 24 h before experiments. Cells were co-incubated (2, 6 and 24 h) with 150 µL of DET-FITC-g-CS (equivalent chitosan concentrations was 500 µg/mL) [Citation17]. To study the cellular entry mechanism, cells were pre-incubated with different inhibitors (1 mg/mL NaN3, 1.3 mg/mL amiloride, 10 mg/mL chlorpromazine, and 20 mg/mL nystatin) individually at concentrations which were not toxic to the cells and at 37 °C, or in the absence of inhibitors at 4 °C for 30 min. Then cells were subsequently incubated with DET-FITC-g-CS nanoparticles for two h. The culture medium was used as the control. The samples were aspirated, and the cells were lysed with 0.1% of Triton X in 0.3 ml of 0.8% NaOH for 10 min, after washing twice with 0.2 ml of ice-cold PBS. The lysates (0.2 ml with 0.1 ml reserved for the determination of protein content) were quantified for FITC by fluorescence measurements at λex: 485 nm and λem: 520 nm using the plate reader. The mean fluorescence intensity was normalized to the amount of protein present in the sample by Bradford assay [Citation18].
3. Results
3.1. Taguchi method
The results of 9 designed experiments suggested by Taguchi method is tabulated in , and S/N ratios for each designed experiments is shown in .
Table 2. The basic taguchi L9(33) orthogonal array and results for individual responses.
Table 3. Orthogonal array and signal to noise ratio for each response.
In this study, four parameters (size, PDI, zeta potential, and zeta deviation) were considered as a response in optimization study. For size, PDI and zeta deviation, the corresponding S/N ratios were calculated considering “smaller is better” approach, and the Taguchi’s “larger is better” approach was used for optimizing zeta potential. The results are reported in .
Figure 1. The S/N ratios of controlled parameters for size (A); zeta potential (B); PDI (C); and zeta deviation (D).
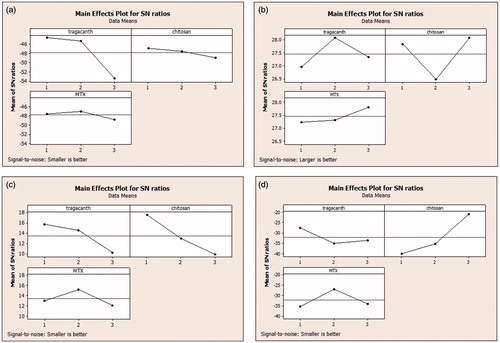
The S/N ratios were compared to examine the significance of each of three variables in a variation of each response parameter. Based on the obtained results, the molecular weight of chitosan possesses the most significant effect on PDI, zeta potential, and zeta deviation of MTX loaded DET-CS nanoparticles and the DET concentration possesses the most significant effect on size of MTX loaded DET-CS nanoparticles.
According to the Taguchi analysis, the optimum conditions for preparing MTX loaded DET-CS NPs could be achieved using high molecular weight chitosan, DET solution with a concentration of 0.005 (w/v%), and MTX/DET ratio of 1:10. The optimum size, zeta potential and PDI for unloaded NPs were 292.1 nm, 19.9 ± 5.99 mV and 0.38 while these optimum parameters for drug loaded NPs were 322.9 nm, 17.3 ± 5.73 mV and 0.424, respectively.
3.2. Analysis of variances (ANOVA)
In order to assure the accuracy and reliability of results, the statistical analysis was performed on the data obtained by Taguchi method [Citation19]. The ANOVA results, mainly the p values and F-values corresponding to individual parameters are reported in to decide which independent factor dominates over other independent variables. It was considered that only controllable parameters with p values <.05 and F-value >1 have non-random effect on the response. Therefore, the concentration of DET solution had a significant effect on the nanoparticle size, and the chitosan molecular weight had a meaningful effect on the zeta deviation verified by the ANOVA. Detail of ANOVA analyses is summarized in Tables at supplementary file.
Table 4. The ANOVA results for responses.
3.3. Loading and release
In order to investigate the drug loading in nanoparticles, MTX solutions with different concentrations in the range of 0.3256 to 31.25 µg/mL were prepared in phosphate buffer (0.2 M, pH 7.4). The amount of MTX loaded in nanoparticles was calculated using a UV-Vis spectrophotometer at 303 nm. The absorbance band of solutions was recorded, and the calibration curve of MTX was prepared. The equation of calibration curve was obtained as follow:
(5)
(5)
While y is the absorbance intensity, and x is the concentration of MTX. The loading efficacy of nanoparticles was 20.32% ± 2.01
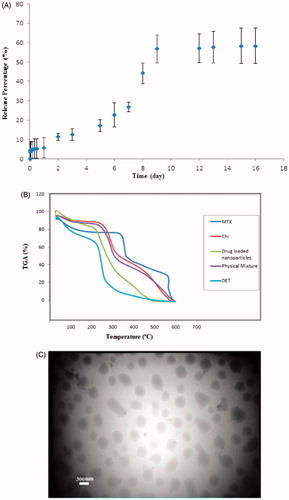
The release curve of MTX from nanoparticles within 16 days is illustrated in . A glance at this figure indicates that the MTX release from nanoparticles occurred without initial burst release and the percentage of MTX release within first two days did not reach to 10%. After two days, the release rate of MTX from nanoparticles gradually increased and reached to 26% up to seven days. The sharp increase in the release of drug was observed at the time between 7 to 9 days. The release percentage of about 57% was obtained within nine days. After this period, the release rate remained constant, and no drug was released from nanoparticles.
Figure 2. A; the release profile of nanoparticles at optimum conditions. B; the TGA thermograms of chitosan, DET, physical mixture, and drug-loaded nanoparticles. C; the TEM photograph of nanoparticles obtained at optimum condition.
3.4. Tga
The thermograms corresponding to chitosan, DET, physical mixture, and drug-loaded nanoparticles are represented in
The behavior of physical mixture was similar to that of chitosan due to the presence of high amount of chitosan, and the small weight loss was observed at temperatures below 100 °C. In the thermogram of high molecular weight chitosan, the second step started from 263 °C and continued to 308 °C whereas the degradation of the backbone of chitosan occurred with 41% weight loss. The degradation of DET started from 229 °C and continued to 263 °C.
The degradation of drug loaded nanoparticles started from 218 °C and continued to 287 °C with weight loss percentage up to 62%. The degradation of polymers in NPs happened at the temperature range of 70 °C, while the variation range of temperature was about 40 °C for the physical mixture, DET, and chitosan. This thought to be due to the energy needed for breaking the cross-links in nanoparticles. The third step in thermograms is related to the pyrolysis of monomers which are present in the structure of constituents of nanoparticles. The thermal behavior of physical mixture and chitosan was completely similar to the third step, and the sharp change was observed at this stage started from 398 °C for DET and MTX, and from 458 °C for the nanoparticles.
3.5. TEM morphological study
The morphology of obtained nanoparticles was observed by TEM microscope. The MTX loaded nanoparticles at optimum conditions were chosen for morphological study. The TEM photograph of samples is illustrated in . It is obvious in this figure that nanoparticles are spherical without any aggregation and adhesion. The size of nanoparticles measured using ImageJ software (322.1 ± 63 nm) was close to that obtained by DLS method (322.9 ± 26 nm) and the results of TEM and DLS were in good agreement.
3.6. In vitro cytotoxicity
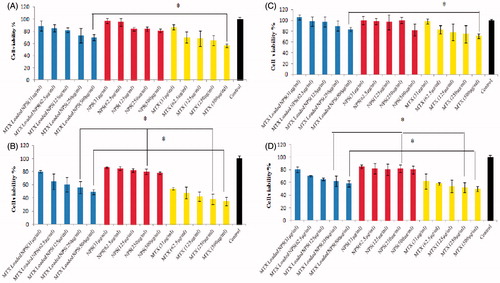
The cytotoxic activity of MTX loaded nanoparticles were evaluated by MTT assay on the HT-29 and MCF-7 cell lines after 24 and 72 h of exposure to different concentrations of MTX (31.25, 62.5, 125, 250, and 500 µg/mL) in the free or encapsulated form (). The curves of cell viability versus MTX concentration were generated, and the drug sensitivity to MTX was expressed as a drug concentration that caused 50% growth inhibition (IC50). The IC50 of MTX encapsulated nanoparticles was obtained by plotting the log 10 of the percentage of proliferation values versus drug concentrations. DET-CS nanoparticles at the concentration used for MTX loaded NPs were not toxic on the HT-29 and MCF-7 cell lines, and the cell viability was not decreased less than 20% at both of 24 and 72 h. The inhibition of cell viability by MTX loaded nanoparticles was clearly observed in a dose- and time-dependent manner. Neither free nor encapsulated MTX could reach to IC50 after 24 h in HT-29 and MCF-7 cell lines, but the cytotoxicity of MTX loaded DET-CS nanoparticles was much lower than free MTX. After 72 h, the IC50 value of MTX loaded DET-CS nanoparticles were 280 µg/mL in HT-29 cell line, and their cytotoxicity did not reach to IC50 in MCF-7 cell line, while the IC50 values of MTX were 31 and 280 µg/mL for HT-29 and MCF-7 cell lines, respectively.
Figure 3. A–D; relative cell viability of free methotrexate (MTX), MTX loaded nanoparticles (MTX loaded DET-CS NPs) evaluated on HT-29 (A and B) and MCF-7 (C and D) cells at 24 (A and C) and 72 h (B and D). Used concentrations were 31, 62.5, 125, 250 and 500 µg/mL for free MTX and MTX loaded NPs, and the concentration of blank nanoparticles was same as ones for the drug-loaded NPs. The relative cell viability read for the control (tissue culture polystyrene from culture plates) after 24, and 72 h of incubation was taken as the reference (100%). Data are expressed as the mean ± SEM of three separate experiments. Significance was calculated by ANOVA (*p ≤ .05).
3.7. Effects of MTX and MTX loaded nanoparticles on mitochondrial membrane depolarization (MMP)
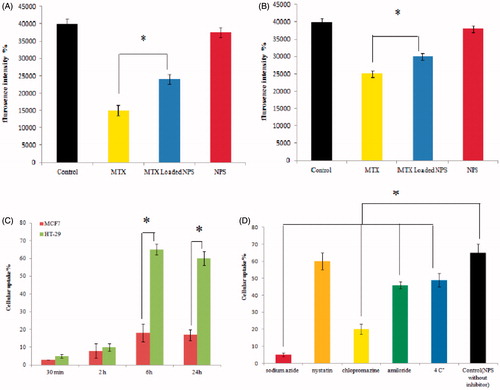
Mitochondrial membrane depolarization (MMP) was determined using a cell permeable cationic fluorescent dye. Depolarization of mitochondria membrane potential by the complexes-induced damage of the mitochondrial membrane resulted in the loss of the dye from the mitochondria and a decrease in intracellular fluorescence. As shown in , HT-29 was more sensitive than MCF-7. The HT-29 cells revealed a dramatic reduction in mitochondrial potential, while this effect was weaker in MCF-7 cells. No significant mitochondrial potential reduction was observed by blank NPs.
Figure 4. A & B; the Effect of MTX, MTX loaded DET-CS nanoparticles and blank nanoparticles at different concentration on mitochondrial membrane potential (MMP) collapse after 48 h, as detected by Rhodamine 123 using plate reader in HT-29 (A) and MCF-7 (B). C & D; the cellular uptake of DET-CS nanoparticles after 30 min, 2, 6 and 24 h on HT-29 and MCF-7 (C). The uptake of DET-CS nanoparticles after exposure to uptake inhibitors (sodium azide, nystatin, chlorpromazine, amiloride and at 4 °C) after six h (D). Data are expressed as the mean ± SEM of three separate experiments. Significance was calculated by ANOVA (*p ≤ .05).
3.8. Uptake study
Cellular uptake of DET-CS nanoparticles was evaluated on HT-29 and MCF-7 cells. FITC-g- nanoparticles were used to detect the uptake of nanoparticles. It is shown that there is a significant increase in accumulation of fluorescence intensity in the HT-29 cells treated with DET-CS nanoparticles compare to MCF-7, indicating that DET-CS nanoparticles internalization in HT-29 cells was higher than MCF-7 cells (). For a better understanding how the incubation time affects the internalization of the nanoparticles, DET-CS nanoparticles were incubated with cells in different time intervals. The cellular uptake of nanoparticles was very little after 30 min. The results show that fluorescence intensity increased with increasing incubation time from 2 to 6 h, but cellular uptake did not change with increased incubation time from 6 to 24 h (). The effect of temperature and different uptake inhibitors on the cellular entry process was also investigated. Incubating cells at 4 °C resulted in ∼25% decrease in cellular uptake (). After incubation with sodium azide, 90% reduction was observed in the cellular uptake. Five percent of the reduction in cellular uptake of nanoparticles was observed after treatment with nystatin, only 30% of the cellular uptake was decreased when was incubated with amiloride while 70% reduction was observed after incubation with chlorpromazine ().
4. Discussion
In this study, we applied the complex coacervation method to prepare the MTX loaded DET-chitosan nanoparticles. The process was controlled and optimized using Taguchi experimental design, and the effect of controllable parameters on the responses was examined. According to Taguchi method results, the molecular weight of chitosan had the highest effect on zeta potential. It can be related to the conformational orientation of polymer chains with different molecular weight in the nanoparticle. Goycoolea et al. had shown that in the degree of de-acetylation higher than 70%, high molecular weight chitosan exposed more amine on the surface of nanoparticles and it had a higher zeta potential in compare to low molecular weight chitosan [Citation20]. However, ANOVA study demonstrated that the molecular weight could not influence the zeta potential of nanoparticles significantly, and according to Fischer statistical results, zeta potential is certainly affected by other variables, which have not been examined in this study. The zeta deviation of nanoparticles was also significantly affected by the molecular weight of chitosan. At a constant concentration of chitosan, decreasing the molecular weight of preformed chitosan leads to increasing the number of chitosan molecules in the solution. Base on the collisional and Brownian mechanism of the coacervation method, the presence of larger number of chitosan molecules results in the production of more polydisperse nanoparticles with different zeta potentials, and the zeta deviation of nanoparticles increase, consequently.
Considering the size of nanoparticles, the concentration of DET solution had the most significant effect on the size of nanoparticles. At lower DET concentrations, the interaction between DET and MTX molecules causes the formation of smaller nuclei for nanoparticle formation and consequently obtaining smaller nanoparticles. It is important to note that no nucleus could be formed at very low concentrations, so the concentration of DET solution must be optimized. On the other hand, considering the positive charge of MTX, the MTX/DET ratio can affect the size of nanoparticles, and lower amount of MTX results in smaller nanoparticles because increasing MTX from the optimum value causes reducing the negative charge of DET and growing the size of DET-CS NPs.
According to the PDI results, all the three parameters possess no particular and significant effect on the PDI of nanoparticles. Due to the collisional mechanism of complex coacervation, it could be logical that both coacervate constituents cannot separately affect PDI of nanoparticles.
The release study indicated the sustained release of MTX from nanoparticles, which could be desirable for oral dosage form of MTX, whereas it has the 100% bioavailability in low doses and 20% in high doses, due to saturable intestinal active transport absorption [Citation8]. Also, the slow release pattern causes a decrease of side effects by reducing the drug release in blood, and the major amount of drug would be released after reaching the target site by EPR effect.
In the TGA thermograms, thermal degradation curves of all samples, the initial weight loss is due to expelling the absorbed water in the structure of samples. The second step with sharp weight loss is more important for the evaluation of the thermal behavior of samples. In this step, thermal stability of DET is lower than chitosan, and the degradation behavior of physical mixture is similar to that of chitosan. The higher weight percentage of chitosan in the physical mixture and lack of interaction between DET and CS in physical mixture can explain this phenomenon. Drug-loaded nanoparticles are similar to physical mixture considering the composition and the percentage of DET and chitosan in the structure, but due to cross-links between DET and chitosan, the degradation of these particles happened in the larger reng of tempreture. At third level, the degradation of nanoparticles occurred at a temperature higher than the degradation temperature of DET and lower than the degradation temperature of chitosan. It should be noticed that in the structure of nanoparticles DET and MTX form the inner portion of nanoparticles. The sustained and slow release profile and positive zeta potential of nanoparticles confirm this configuration of components in the structure of nanoparticles. At the second step of degradation, the outer layers of nanoparticles, which is mainly comprised of chitosan, starts to decompose and the absorbed heat at third step is consumed for the degradation of the inner portion (particularly DET and MTX). The weakened structure of an inner portion of nanoparticles, due to the presence of MTX and DET, causes degradation of nanoparticles at a temperature lower than the degradation temperature of chitosan. It should be noted that due to the presence of cross-links between MTX and DET, a portion of absorbed heat is consumed for breaking the cross-links and nanoparticles decomposed at a temperature higher than the degradation temperature of DET.
To evaluate anti-cancer potency of optimum NPs, their cytotoxicity was evaluated. MTX was more toxic towards two cell lines in compare to MTX loaded DET-CS nanoparticles, and the cytotoxicity of MTX loaded DET-CS nanoparticles had a direct relation to the time of incubation and was enhanced by increasing the time of incubation. This result could be attributed to the release kinetic of MTX from DET-DS nanoparticles, whereas MTX released slowly from the nanoparticle. According to the profile of release, total released MTX from DET-CS nanoparticles was very low after 72 h.
The MMP results indicated the apoptosis as a potential mechanism of both MTX and MTX loaded NPs, and similar to cytotoxicity result, the MMP showed that NPS were more effective on HT-29 that on MCF-7.
To show the role of uptake on this different behavior of HT-29 and MSF-7, we studied the uptake and the uptake mechanism of NPs. HT-29 cells produce a functional apically located asialoglycoprotein receptor and provide a model for receptor trafficking in the enterocyte which expresses asialoglycoprotein receptors [Citation21], and MCF-7 cells are devoid of these receptors [Citation22]. The existence of galactoside residues in the structure of tragacanth can result in a significant increase in the binding of nanoparticles to the -cells and enhance cellular uptake. Therefore, enhanced uptake of DET-CS nanoparticles was attributed to the involvement of galactose-receptor recognition. The results indicated no significant difference in the uptake percentage after 6 h, which may be attributed to the proliferation of cancer cell line, whereas the proliferation of cancer cell line is very fast.
To understand the mean mechanism of uptake, we evaluated the effect of different endocytosis inhibitors. The decrease in cellular uptake after incubating cells at 4 °C suggesting that an energy-dependent uptake process was involved in the internalization of the nanoparticles. Sodium azide is widely used for both in vivo and in vitro studies as an inhibitor of cellular respiration. After incubation with sodium azide, 90% reduction was observed in the cellular uptake confirming that the endocytosis was active and energy-dependent. Lower inhibition at 4 °C compared to inhibition by NaN3 suggested that the main uptake mechanism is the active endocytosis [Citation23]. Endocytosis can be divided into two broad categories: phagocytosis and pinocytosis. Phagocytosis is typically restricted to specialized cells whereas pinocytosis occurs in all cell types. Pinocytosis is subdivided into macropinocytosis, clathrin-dependent (CDE), and clathrin-independent (CIE) endocytosis. We employed two endocytosis inhibitors, namely, chlorpromazine and nystatin. Chlorpromazine is a cationic amphiphilic drug, which can inhibit clathrin-coated pit formation by a reversible translocation of clathrin endocytosis [Citation24], and nystatin can selectively interrupt caveola/lipid raft-dependent endocytosis without affecting on clathrin-mediated internalization. Nystatin can bind to sterol and disrupt the formation of caveolae [Citation25]. The low reduction in cellular uptake of nanoparticles was observed after treatment with nystatin, indicating that the caveola-associated pathway was the minor contributor involved in the internalization of the nanoparticle; caveolae are extremely abundant on the surface of endothelial cells in compare to the epithelial cell [Citation26]. Macropinocytosis can be found in almost all cells with few exceptions, e.g. macrophages and brain microvessel endothelial cells. This pathway is started with external stimulations, which activate the receptor tyrosine kinase [Citation24]. Amiloride has been used as a macropinocytosis blocker [Citation27]. The cellular uptake inhibition with amiloride was not significant while a significant inhibition was observed by chlorpromazine, and consequently clathrin-dependent endocytosis was a dominant endocytosis pathway of DET-CS NPs in HT-29. Clathrin pathway was a suitable route for drug delivery to the lysosome. Therefore, targeting nano-medicine complexes to the endolysosomal pathway have serious potential for improving drug delivery for the treatment of lysosomal storage diseases, cancer and Alzheimer’s disease [Citation28].
5. Conclusion
The aim of the present study was to prepare the MTX loaded DET-CS NPs using complex coacervation method. The process was controlled and optimized using Taguchi experimental design, and the effect of controllable parameters (chitosan molecular weight, DET concentration, and DET/MTX ratio) on the responses (size, PDI, zeta potential, and zeta deviation) was examined. It was observed that the size and zeta potential of drug loaded nanoparticles at optimum condition are 322.9 ± 26 nm and 17.3 ± 5.73 mV. The molecular weight of chitosan possessed the most effect on the zeta potential, PDI, and zeta deviation and the size of nanoparticles significantly affected by the DET concentration. The loading efficiency of nanoparticles was determined, and the average value was 20.32% for loading efficiency of nanoparticles. The release profile of MTX from nanoparticles occurred in different steps. The sustained and gradual release was observed within nine days, and the release percentage was found 57% after nine days. The thermal behavior of nanoparticles, MTX, physical mixture, and components were compared, and it was observed that nanoparticles need more energy to degrade due to the presence of cross-links between DET and chitosan and breakage of these cross-links consumed more energy. The MTT assay was performed to evaluate cytotoxic activity of MTX loaded nanoparticles on the HT-29 and MCF-7 cell lines after 24 and 72 h. The cytotoxicity of MTX loaded DET-CS nanoparticles was less than pure MTX, and both samples could not reach to IC50 after 24 h in both of HT-29 and MCF-7 cell lines. The IC50 of nanoparticles were 280 µg/mL after 72 h toward HT-29 cell line, but these nanoparticles could not reach to IC50 in MCF-7 cell line at a similar time. The IC50 values of MTX were 31 and 280 mg/mL for HT-29 and MCF-7 cell lines, after 72 h, respectively. The cytotoxicity of MTX loaded DET-CS nanoparticles increased with increasing the time of incubation. The cellular uptake was also performed using fluorescent spectroscopy method. The internalization of nanoparticles in the HT-29 cells, which have asialoglycoprotein receptors was higher than MCF-7 cells. In conclusion, these phenomena altogether make DET-CS a proper choice for targeted drug delivery to cells which have asialoglycoprotein receptors.
ANOVA_analysis__supplementary_.docx
Download MS Word (16.3 KB)Acknowledgement
The authors gratefully acknowledge the Research Council of Kermanshah University of Medical Sciences (Grant Number: 95062) for the financial support. This work was performed in partial fulfillment of the requirements for MSc of Komail Sadrjavadi.
Disclosure statement
The authors report no declarations of interest.
Related Research Data
References
- Albanna MZ, Bou-Akl TH, Blowytsky O, et al. Chitosan fibers with improved biological and mechanical properties for tissue engineering applications. Journal of the Mechanical Behavior of Biomedical Materials. 2013;20:217–226.
- Fattahi A, Petrini P, Munarin F, et al. Polysaccharides derived from tragacanth as biocompatible polymers and gels. J Appl Polym Sci. 2013;129:2092–2102.
- Azadi A, Hamidi M, Rouini M-R. Methotrexate-loaded chitosan nanogels as ‘Trojan Horses’ for drug delivery to brain: preparation and in vitro/in vivo characterization. International Journal of Biological Macromolecules. 2013;62:523–530.
- Chen J, Huang L, Lai H, et al. Methotrexate-loaded PEGylated chitosan nanoparticles: synthesis, characterization, and in vitroand in vivo antitumoral activity. Mol Pharmaceutics. 2013;11:2213–2223.
- Hamidi M, Azadi A, Rafiei P. Hydrogel nanoparticles in drug delivery. Adv Drug Deliv Rev. 2008;60:1638–1649.
- Fattahi A, Sadrjavadi K, Golozar MA, et al. Preparation and characterization of oligochitosan–tragacanth nanoparticles as a novel gene carrier. Carbohydrate Polymers. 2013;97:277–283.
- Garcia-Fuentes M, Alonso MJ. Chitosan-based drug nanocarriers: where do we stand? Journal of Controlled Release. 2012;161:496–504.
- Abolmaali SS, Tamaddon AM, Dinarvand R. A review of therapeutic challenges and achievements of methotrexate delivery systems for treatment of cancer and rheumatoid arthritis. Cancer Chemotherapy and Pharmacology 2013;71:1115–1130.
- Khan ZA, Tripathi R, Mishra B. (Methotrexate: a detailed review on drug delivery and clinical aspects. Expert Opin Drug Deliv. 2012;9:151–169.
- Li Y, Lin J, Wu H, et al. Novel methotrexate prodrug-targeted drug delivery system based on PEG–lipid–PLA hybrid nanoparticles for enhanced anticancer efficacy and reduced toxicity of mitomycin C. Journal of Materials Chemistry B. 2014;2:6534–6548.
- Dikmen G, Genç L, Güney G. Advantage and disadvantage in drug delivery systems. Journal of Materials Science and Engineering 2011;5:468.
- Kumar K, Dhawan N, Sharma H, et al. Bioadhesive polymers: novel tool for drug delivery. Artif Cells Nanomed Biotechnol. 2014;42:274–283.
- Farshbaf M, Davaran S, Zarebkohan A, et al. Significant role of cationic polymers in drug delivery systems. Artificial Cells, Nanomedicine, and Biotechnology. 2017;1–20.
- Shi J, Kantoff PW, Wooster R, et al. Cancer nanomedicine: progress, challenges and opportunities. Nat Rev Cancer. 2017;17:20–37.
- Shahbazi B, Taghipour M, Rahmani H, et al. Preparation and characterization of silk fibroin/oligochitosan nanoparticles for siRNA delivery. Colloids and Surfaces B: Biointerfaces. 2015;136:867–877.
- Abdolmaleki S, Ghadermazi M, Fattahi A, et al. Synthesis, crystallographic and spectroscopic studies, evaluation as antimicrobial and cytotoxic agents of a novel mixed-ligand nickel (II) complex. Journal of Coordination Chemistry. 2017;70:1406–1423.
- Huang M, Ma Z, Khor E, et al. Uptake of FITC-chitosan nanoparticles by A549 cells. Pharm Res. 2002;19:1488–1494.
- Zhou Z, Li H, Wang K, et al. Bioreducible Cross-Linked Hyaluronic Acid/Calcium Phosphate Hybrid Nanoparticles for Specific Delivery of siRNA in Melanoma Tumor Therapy. ACS Appl Mater Interfaces. 2017;9:14576–14589.
- Fattahi A, Sakvand T, Hajialyani M, et al. Preparation and Characterization of Pistacia khinjuk Gum Nanoparticles Using Response Surface Method: Evaluation of Its Anti-Bacterial Performance and Cytotoxicity. Adv Pharm Bull. 2017;7:159.
- Goycoolea F, El Gueddari N, Remuñán-López C, et al. Effect of molecular weight and degree of acetylation on the physicochemical characteristics of chitosan nanoparticles. In: Sevda Senel, editor. Advances in Chitin Science X: Proceedings of the 8 th international conference of the European chitin society; 2007 Sep 8; Antalya, Turkey: Tubitak Publications; 2007. p. 542–547.
- Mu JZ, Gordon M, Shao J, et al. Apical expression of functional asialoglycoprotein receptor in the human intestinal cell line HT-29. Gastroenterology 1997;113:1501–1509.
- Jain V, Nath B, Gupta GK, et al. Galactose‐grafted chylomicron‐mimicking emulsion: evaluation of specificity against HepG‐2 and MCF‐7 cell lines. j Pharm Pharmacol. 2009;61:303–310.
- Vranic S, Boggetto N, Contremoulins V, et al. Deciphering the mechanisms of cellular uptake of engineered nanoparticles by accurate evaluation of internalization using imaging flow cytometry. Part Fibre Toxicol. 2013;10:2–16.
- Sahay G, Alakhova DY, Kabanov AV. Endocytosis of nanomedicines. J Control Release. 2010;145:182–195.
- Breen MR, Camps M, Carvalho-Simoes F, et al. Cholesterol depletion in adipocytes causes caveolae collapse concomitant with proteosomal degradation of cavin-2 in a switch-like fashion. PLoS ONE. 2012;7:e34516.
- Voigt J, Christensen J, Shastri VP. Differential uptake of nanoparticles by endothelial cells through polyelectrolytes with affinity for caveolae. Proceedings of the National Academy of Sciences. 2014;111:2942–2947.
- Muro S, Mateescu M, Gajewski C, et al. Control of intracellular trafficking of ICAM-1-targeted nanocarriers by endothelial Na+/H + exchanger proteins. American Journal of Physiology-Lung Cellular and Molecular Physiology. 2006;290:L809–L817.
- Bareford LM, Swaan PW. Endocytic mechanisms for targeted drug delivery. Advanced Drug Delivery Reviews. 2007;59:748–758.