
Abstract
Early evaluation of iron overload (IO) and prompt iron-chelation therapy reduce the haematopoietic damage wrought by IO-induced reactive oxygen species (ROS). We examined whether MagA could simultaneously increase the sensitivity of magnetic resonance imaging (MRI) for iron measurement and attenuate oxidative damage to the haematopoietic microenvironment. After generation of a transgenic (Tg) mouse model, MRI, transmission electron microscopy and cytotoxicity assays were used to assess various parameters in mesenchymal stem cells (MSCs). Transverse relaxation rate (R2*) of MagA-expressing MSCs in the presence of iron supplement was higher compared with that of control cells. Besides, R2* value of liver from IO magA Tg mice was higher than that of wild type mice. Moreover, MagA contributed to reduce the cytotoxicity of iron against MSCs, reduce expression of p-p38 mitogen-activated protein kinase and ferritin, and reduce inhibition of the osteogenic differentiation caused by IO. These data support the use of magA as a reporter gene for cell tracking with MRI and indicate exciting new possibilities for use of MagA in the attenuation of injury due to oxidative stress caused by exogenous iron.
Introduction
Regular transfusion of suspended red blood cells is the main treatment for anaemic diseases. However, long-term transfusion and inefficient haematopoiesis of bone marrow lead to transfusion-dependent iron overload (IO). Excess irons deposit in tissue and critical organs, and ultimately result in dysfunction of visceral organs, such as cardiomyopathy, hepatic fibrosis and even haematological disorders. Numerous reports have stated that IO has a suppressive effect on the haematopoietic microenvironment [Citation1,Citation2], leading to poor survival of haematopoietic stem cells (HSCs) [Citation3,Citation4].
Mesenchymal stem cells (MSCs) are normally located in low-oxygenic bone marrow niche. Physiological level of reactive oxygen species (ROS) facilitates the stability of haematopoietic microenvironment. Excess amounts of reactive iron ions (Fe2+/Fe3+) induce large amounts of ROS via the Fenton and Haber–Weiss reactions, cause cellular senescence and MSCs apoptosis [Citation1,Citation5]. Increasing clinical evidence has proven that iron chelation therapy helps to improve haematopoiesis [Citation3] as well as patients’ quality of life [Citation6].
Accurate evaluation of IO is critical for chelation therapy. Some methods for estimating IO are available, such as measuring the level of serum ferritin (SF) and liver-biopsy specimens. However, SF is nonspecific and influenced by infection and inflammation [Citation7]. Although liver biopsy is the gold standard for quantifying hepatic iron contents, this technique is invasiveness and influenced by the sampling error [Citation8]. As liver is the major organ for iron storage and has the largest capacity to store excess iron [Citation9], a sensitive and noninvasive method to estimate hepatic iron concentration is critical for transfusion patients. Magnetic resonance imaging (MRI) has been investigated as a noninvasive method of detecting hepatic iron deposition. Detection of iron with MRI is based on local field inhomogeneity generated mostly by the paramagnetic effect of hemosiderin particles [Citation10]. Iron shortens T1, T2 and T2* relaxation times, with darkened images being observed if iron is present. Iron measurements by R2*-MRI (R2* = 1/T2*) in the liver have shown good correlations with hepatic iron concentration, which provides a rapid and accurate method for the diagnosis and management of transfusional IO [Citation11–13].
The iron concentration is expected to influence MRI signals, so several iron-related genes have been studied as “MRI markers”, including magA. In Magnetospirillum magneticum species AMB-1, magA was initially believed to participate in magnetosome synthesis [Citation14]. More recently, MagA has been recognized as a nonessential magnetosome protein [Citation15] located outside the magnetosome genomic island [Citation16,Citation17]. Typically, a magnetosome consists of a lipid bilayer surrounding a magnetite crystal (Fe3O4 in AMB-1). The magA gene encodes an integral membrane protein with homology to the bacterial H+/Fe2+ antiporter family of proteins coupled to ATPase [Citation18,Citation19]. With MagA expressed in the Escherichia coli, cells have been shown to transport Fe2+ in an energy-dependent manner, leading to accumulation of Fe2+ in the vesicle [Citation14,Citation18].
The sensitivity for detection of mammalian cells by MRI can be enhanced by iron uptake as well as the redistribution (e.g. aggregation) of existing intracellular iron due to MagA expression [Citation20–22]. The potential of MagA as an iron contrast agent has been reported in some cancer cells [Citation21,Citation23] and stem cells [Citation24]. Nevertheless, the advantages of using this magnetosome bacterial gene product to serve haematopoietic cells have not been explored fully.
MagA-expressed cells store considerable amounts of iron in magnetosome-like particles. However, whether these particles attenuate oxidative damage by reducing the excess iron in the cytoplasm is not known. Also, whether MagA increases the sensitivity of MRI to measure IO and attenuates the oxidative damage to the haematopoietic microenvironment simultaneously is not known.
In the present study, a magA plasmid was constructed and magA transgenic (Tg) mice were created by our research team. Transverse relaxation rate (R2*) of MagA-expressing MSCs (MagA-MSCs) in the presence of iron supplement was higher compared with that of control cells. Also, MagA could alleviate the oxidative-stress damage to MSCs caused by IO. These data support the use of magA as a reporter gene for cell tracking with MRI and provide an experimental basis for use of MagA in the attenuation of injury due to oxidative stress caused by exogenous iron.
Materials and methods
Generation of magA transgene mice (magA Tg mice)
The magA gene (GenBank: D32253.1) was synthesized and purchased from Genscript Corporation (Piscataway, NJ). Reverse transcription polymerase chain reaction (RT-PCR) was used to generate magA cDNA clone. magA cDNA was cloned into pRP.Des2d vector (Cyagen Biosciences, Guangzhou, China) and verified by sequencing. The resulting construct was linearized and gel-purified before injection into Friend leukaemia virus B (FVB) mouse embryos. magA Tg mice were generated using standard methods, as described previously [Citation25]. The magA gene of mice was detected by PCR amplification of a 1317-bp product using the forward primer 5’-ATG GAG CTG CAC CAT CCC GA-3’-3er and reverse primer 5’-TTT CAC GCC AGA ACC GAT CC-3’-3er The magA Tg mice used for this study were bred for six generations; they were healthy and fertile without a detectable phenotype. Mice were raised in the Animal Center of Sun Yat-sen University (Guangdong, China). The care and use of animals was in accordance with guidelines set by Sun Yat-sen University.
Cells
Isolation and identification of MagA-expressing MSCs
The genotyping of magA Tg mice was undertaken using genomic PCR. Genomic DNA isolated from 2-week-old mouse-tail lysates was used for genotype determination.
MSCs were isolated from 2-week-old magA Tg mice (half male and half female, detected by genomic PCR). The bone marrow was obtained from the femurs and flushed with a syringe needle with 1 ml of Dulbecco’s modified Eagle’s medium (GIBCO, Carlsbad, CA) with 10% foetal bovine serum (GIBCO, Carlsbad, CA) thoroughly. The cell clusters were scattered repeatedly and incubated at 37 °C in a humidified atmosphere (Thermo Scientific, Waltham, MA) containing 5% CO2 for seven days. The adherent cells were harvested and transferred into a new 25-cm2 plastic culture flask for another continuous culture of 4–7 days. Passages 1–3 cells were prepared for the following experiment. We also isolated MSCs from wild-type FVB mice (WT mice) as control (CTR-MSCs for short).
The cell surface antigen of MSCs was indentified by flow cytometry. These cells were positive for the mesenchymal markers CD29, CD44 and the stem cell marker Sca-1. It was negative for haematopoietic markers CD34 and CD45.
MagA protein expression in MSCs was detected by an immunofluorescence assay as reported previously [Citation26]. MagA polyclonal antibody as the primary antibody was prepared which can be referred to our published paper [Citation25]. The fluorescent antibody (AlexaFlor593 goat-anti-rabbit IgG) was purchased from Invitrogen (Waltham, MA).
Iron-supplemented cells
Cells were incubated with Fe from ferric ammonium citrate (FAC) in the following experiments. FAC was purchased from Sigma-Aldrich (St. Louis, MO).
Transmission electron microscopy (TEM)
After culture with 200 μM Fe or PBS for 24 h, cells were fixed with 2.5% glutaraldehyde followed by 2% osmium tetroxide in 0.1 mM cacodylate buffer for 2 h. Then, cells were dehydrated and embedded in EPONTM resin. Ultrathin sections (60–70 nm) were cut and observed on a JEM-1400 transmission electron microscope (JEOL, Tokyo, Japan).
MRI
MRI of cell pellets and animals was done on a 3-T MR scanner (Magnetom TIM Trio; Siemens Medical Solutions, Erlangen, Germany). R2* measurements were performed using custom-written software (MATLAB, The Mathworks, Natick, MA). The formula of R2* measurements: S = S0e–TE×R2* (S and S0 are the signal intensity at different TEs and its initial value at TE = 0, respectively, TE = echo time, R2* = transverse relaxation rate) [Citation27].
MRI of cell suspensions
Four types of cells were prepared: (a) MagA-MSCs; (b) CTR-MSCs; (c) IO MagA-MSCs; (d) IO CTR-MSCs. For the group of (c) and (d), cells were incubated with 200 μM Fe for 24 h. For the group of (a) and (b), phosphate-buffered saline (PBS) of the same volume was added into the medium. Cells of each type (2 × 10⁵) were collected into an eppendorf tube (0.2 ml) and centrifuged at 2000 rpm for 10 min at room temperature to form a compact pellet. The supernatant was removed and the cell pellet suspended in 20 μL of hot-melt agarose (0.2% in PBS, at least 90 °C) immediately to avoid bubble generation. The tubes were placed perpendicular to the MRI scanning table. We acquired T2* mapping images (slice thickness, 1 mm; spacing between slices, 1 mm; repetition time, 150 ms; eight echo times at 3–48 ms, pixel bandwidth, 287 Hz; percent phase field of view, 100 mm). Regions of interest (ROIs) were drawn in the same plane of each sample after scanning.
MRI in vivo
All magA Tg mice and WT mice, half male and half female, were used at approximately 4–8 weeks of age, and the average weight was 20 g. Four groups were prepared: (a) magA Tg mice; (b) WT mice; (c) IO magA Tg mice; (d) IO WT mice. Iron dextran was purchased from Sigma-Aldrich (St. Louis, MO). For the group of (c) and (d), mice were administered 0.2 ml iron dextran (200 mg/25 g body weight, i.p.) every three days for 4 weeks. The group of (a) and (b) were treated with normal saline of same. Before MR scanning, mice were anesthetized with sodium ketamine (12.5 mg/kg) and placed supine on the MRI scanning table. We acquired T2* mapping images (slice thickness, 2.5 mm; spacing between slices, 2.5 mm; repetition time, 150 ms; eight echo times at 3–48 ms, pixel bandwidth, 287 Hz; percent phase field of view, 100 mm). After coronal MR scanning, ROIs were drawn in a homogeneous area of liver in the same plane, avoiding blood vessels and obvious bile ducts.
Inductively coupled plasma mass spectrometry (ICP-MS) measurement
After MR scanning, MSCs and the livers of mice were weighed, respectively. Then, they were soaked in 5.0 ml of concentrated nitric acid respectively and heated until the samples were completely digested. The residue was dissolved in 2% nitric acid for ICP-MS (Thermo Electron, Winsford, UK) analyses.
Cytotoxicity assays
Cell viability
For (3-(4,5-dimethylthiazol-2-yl)-5-(3-carboxymethoxyphenyl)-2-(4-sulfophenyl)-2H-tetrazolium) (MTS) assay, cells were plated in a 96-well plate (5 × 10³ cells per well) and incubated for 24 h. Then cells were incubated in the medium supplemented with different concentrations of Fe (100–1000 μM) for 24 h. After that, the medium was changed and cells were incubated for another 1–5 days in complete medium. Five wells per condition were measured according to the manufacturer instructions (Promega, Madison, WI).
Integrity of cell membranes
Lactate dehydrogenase (LDH) leakage was assessed for membrane integrality. Cells were treated as described in MTS assay, incubated in the medium with a final concentration of Fe (10–200 μM) for 24 h, and incubated for six days in complete medium. The supernatant (50 μL) was collected and transferred to a new 96-well plate. After adding the fresh reaction mixture (50 μL) to each microplate well, the samples were incubated for 30 min at 37 °C in the dark. Then, the terminator (50 μL) was added into each well to stop the reaction. Five wells per condition were measured according to the manufacturer instructions (Promega, Madison, WI).
ROS
Cells were treated as described in MTS assay, incubated with Fe (10–200 μM) for 24 h, and incubated for an additional six days. Then, cells were incubated with DCFH-DA 100 μM (Beyotime, Shanghai, China) for 1 h and serum-free medium for another 30 min in a dark and humidified atmosphere of 5% CO2 in air at 37 °C. Samples were washed thrice with PBS between each steps. The fluorescence intensity of samples was measured at 490 nm (excitation) and 520 nm (emission) on a microplate reader (Bio-Rad Laboratories, Hercules, CA).
Western blotting
Cells were incubated with Fe (20–200 μM) for 24 h. Then cells (5 × 10⁶) of each type were washed with ice-cold PBS and harvested, followed by centrifugation at 2000 revolutions per minute and 4 °C for 10 min. The supernatants were removed and the cell samples were treated with radioimmunoprecipitation assay lysis buffer (Beyotime, Shanghai, China) containing 4% protease inhibitor (Roche, Basel, Switzerland). Cells in the mixture were broken by sonifier cell disruptor and the homogenate was centrifuged (12,000 revolutions per minute, 20 min, 4 °C). Then, the supernatant was collected and mixed with loading buffer for denaturation (10 min, 100 °C). Protein concentration was assayed by BCA Protein Assay Kit (bicinchoninic acid) in accordance with the manufacturer instructions (Thermo Fisher Scientific, Waltham, MA).
Equal amounts of proteins (20 μg) were separated by sodium dodecyl sulphate polyacrylamide gel electrophoresis (10% separating gel, 30 mA, 90 min). Then gels were blotted onto polyvinylidene fluoride membranes by a wet transfer method (300 mA, 150 min). After being blocked in 5% milk/Tris–HCl buffered saline for 30 min, membranes were incubated with primary antibody at 4 °C overnight. The dilution of MagA polyclonal antibody, rabbit monoclonal anti-ferritin antibody (Epitomics, Cambridge, MA) and rabbit monoclonal anti p-p 38 MAPK antibody (Cell Signaling Technology, Danvers, MA) was 1:1000, whereas that of goat monoclonal anti-glyceraldehyde 3-phosphate dehydrogenase antibody (Cell Signaling Technology, Danvers, MA) was 1:2000. After washing five times in TBST (0.5% Tween 20 in Tris-buffered saline), membranes were incubated with corresponding horseradish peroxidase-conjugated secondary antibodies (Lianke Biotechnology, Hangzhou, China). Bands were visualized by enhanced chemiluminescence and captured by a gel-documentation system (ChemiDoc Touch, Bio-Rad, Hercules, CA).
Osteogenic differentiation and enzyme-linked immunosorbent assay (ELISA)
Cells were seeded in a 24-well plate and incubated with 200 μM Fe or PBS for 24 h. When cells had reached 70% confluence, osteogenic induction was carried out using osteoblast-inducing conditional media for 15 days according to the manufacturer instructions (R&D Systems, Minnesota, MN). Cellular staining of alkaline phosphatase (ALP) was assayed using Fast Blue RR Salt kit according to the manufacturer instructions (Sigma-Aldrich, Saint Louis, MO).
For measurement of ALP activity, cells were plated in a 96-well plate (5000 cells per well) and incubated with Fe (10–200 μM) for 24 h. Then cells were cultured under osteogenic differentiation medium for 13 days. ALP is a secretory protein and mainly present in the medium. The cell culture supernatant and cells’ precipitation were collected. ALP activity was measured with an ALP ELISA kit (Cusabio, Wuhan, China) according to the manufacturer instructions.
Statistical analyses
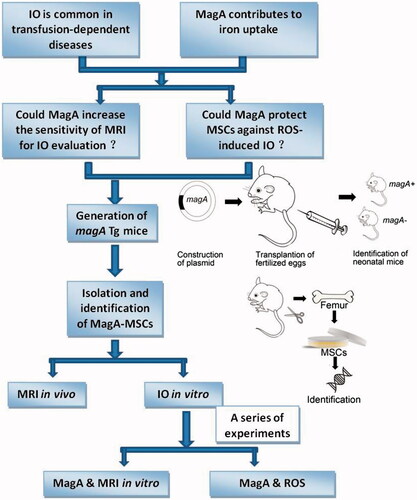
SPSS v16.0 (IBM, Armonk, NY) was used for data analyses. Student’s t-test was used for comparison between two groups. p < .05 was considered significant. All experiments were repeated at least three times. The schematic drawing that explains the concept of this study was made as a figure ().
Figure 1. The schematic drawing of this study.
Results
Generation of magA Tg mice and MagA expression in MSCs
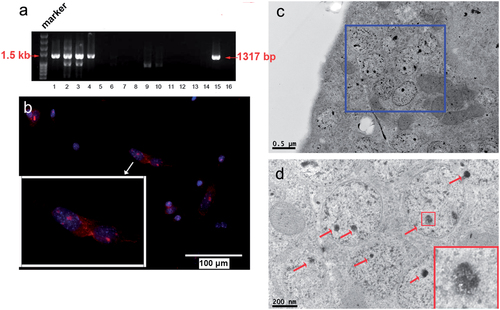
The gene sequence of the pRP.EF1A-MagA-F2A vector was consistent with the magA sequence in Gene Bank (Figure S1(b)); the gene map is shown in Figure S1(a). The PCR product (1317 bp) specific to the magA transgene could be detected in magA Tg mice (). We obtained four magA Tg mice of generation zero. The prevalence of magA Tg mice after the fifth generation was ≈20%. MSCs isolated from magA Tg mice had MagA-positive staining (red fluorescence) by the immunofluorescence assay ().
Figure 2. Magnetosome-like particles in MagA-MSCs with iron supplement. (a) The genotyping result of some magA Tg mice was undertaken by genomic PCR. The specific positive bands (1317 bp) at lanes 1–4 and lane 15 represented magA Tg mice, whereas lanes 5–14 and lane 16 represented wild type mice. (b) MagA protein (red fluorescence) expressed in the MSCs of magA Tg mice was identified by an immunofluorescence assay. The cell nuclei were observed by Hoechst33342 (blue fluorescence). (c, d) Nanoparticles with a high electron density of 30 nm in diameter were observed within the membrane-enclosed vesicles of MagA-MSCs by TEM. Finer aggregates (3–5 nm) were found in these nanoparticles.
Nanoparticles with high electron density in MagA-MSCs
TEM revealed nanoparticles with high electron density of 30 nm in diameter within the membrane-enclosed vesicles of MagA-MSCs (). Finer aggregates (3–5 nm) were found in these nanoparticles ().
MagA increases the cellular sensitivity of MRI
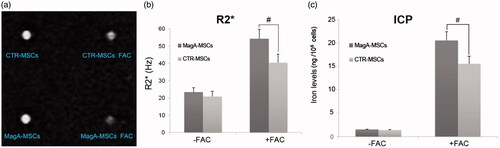
MagA-MSCs exhibited a significant increase in R2* upon iron supplementation. R2* value of MagA-MSCs (54.23 ± 5.46 Hz) in the presence of iron supplement was higher compared with those of CTR-MSCs (40.34 ± 4.96 Hz) (, #p < .01, n = 5).
Figure 3. In vitro MRI analysis of MagA-MSCs and CTR-MSCs. (a) MR image of MSCs. (b) R2* value of MagA-MSCs in the presence of iron supplement was higher compared with those of CTR-MSCs. (c) The iron concentration of MagA-MSCs in the presence of iron supplement was greater than those of CTR-MSCs. Date are the mean ± SEM (#p < .01, n = 5).
MagA increases the sensitivity of MRI in vivo
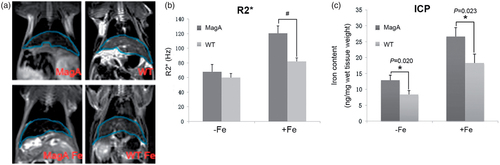
A model of IO in mice was established by intraperitoneal injection with iron dextran. shows that R2* value of liver from IO magA Tg mice (120.47 ± 10.20 Hz) was higher than IO WT mice (82.07 ± 4.66 Hz, #p < .01, n = 3).
Figure 4. In vivo MRI analysis of the livers of magA Tg mice and wild-type (WT) mice. (a) MR image of mice. The liver of each type of mouse was outlined with blue line. (b) R2* value was higher in the liver from iron overloaded magA Tg mice. (c) The iron concentration in the liver of iron overloaded magA Tg mice was greater than those of iron overloaded WT mice. Date are the mean ± SEM (*p < .05, #p < .01, n = 3).
Iron content in MSCs and the liver of mice
After MR scanning, we measured iron content of cell samples () and the liver of mice () by ICP-MS. The iron content of MagA-MSCs in the presence of iron supplement (205.36 ± 19.28 ng/106 cells) was higher compared with those of CTR-MSCs (155.53 ± 16.19 ng/106 cells, #p < .01, n = 5). The iron concentration in the liver of IO magA Tg mice (26.56 ± 2.88 ng/mg wet tissue weight) was greater than those of IO WT mice (18.32 ± 2.76 ng/mg wet tissue weight, *p < .05, n = 3).
MagA reduces the cytotoxicity of MSCs upon IO
MTS assay
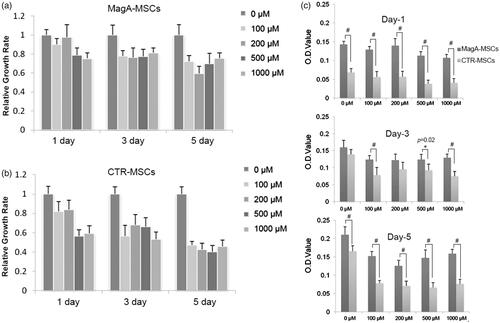
Cell activity on different days with different iron concentrations was measured by MTS assay (). MagA-MSCs appeared to grow slightly slow relative to CTR-MSCs without iron supplementation. Perhaps magA, as an exogenous gene, had a slight influence on cell proliferation. Excess amounts of iron weaken the proliferation of MSCs, but MagA reduces this damage partially. Taking 100-μM groups as examples, on day 1 and day 3, a reduction in viability ≤20% and ≤45% was observed in CTR-MSCs, whereas MagA-MSCs experienced reductions of 8% and 22%, respectively. After five days, the viability of CTR-MSCs decreased to 45% compared with 75% in MagA-MSCs (*p < .05, #p < .01, n = 5).
Figure 5. The viability of MSCs by MTT assays. (a, b) The relative growth rate (compared to iron-free group) of MagA-MSCs and control cells on different days with different iron concentrations (100–1000 μM). (c) The detailed growth rate of MagA-MSCs and control cells on day 1, day 3 and day 5, respectively. The x axis of (c) is the concentration of extracellular iron supplement. Date are the mean ± SEM (*p < .05, #p < .01, n = 5).
LDH assay
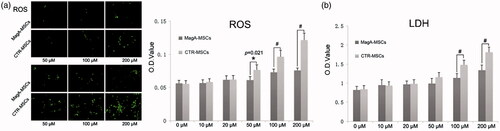
Lipid peroxidation induced by ROS can disrupt phospholipid bilayer membranes as a result of intracellular stress from production of hydrogen peroxide. Hence, we measured cell-membrane integrity via quantification of LDH leakage from cells upon IO. Upon addition of 100 or 200 μM Fe, a significant increase in LDH leakage was observed in CTR-MSCs compared with that in MagA-MSCs (, #p < .01, n = 5).
Figure 6. ROS and LDH assays of MSCs. (a) The significant difference in ROS levels of MagA-MSCs compared to the control cells if the extracellular iron supplement was >50 μM. (b) The significant difference of LDH in the supernatant of MagA-MSCs compared to that of the control cells was noted if the extracellular iron supplement was >100 μM. The x axis is the concentration of extracellular iron supplement. Date are the mean ± SEM (*p < .05, #p < .01, n = 5).
ROS assay
Iron is the main catalyst of ROS, which would damage lipid membranes, proteins and nucleic acids. As shown in , there was a significant difference in ROS levels of MagA-MSCs compared to the control group when IO was >50 μM. It was inferred that MagA might mediate sustained increases in ROS production in IO of MagA-MSCs (*p < .05, #p < .01, n = 5).
MagA contributes to reduced expression of p-p38 MAPK
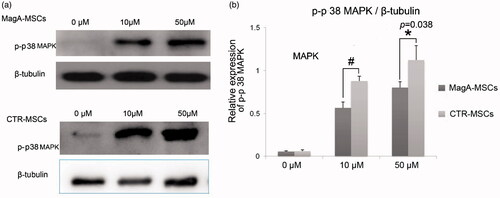
p38 MAPK has critical roles in the DNA damage resulting from genotoxic and oxidative stresses. The protein levels of p-p38 MAPK increased with increasing Fe concentration. The relative expression level of p-p38 MAPK of MagA-MSCs upon iron supplement was lower than that of CTR-MSCs (, *p < .05, #p < .01, n = 5). This finding further confirmed that IO may be closely related to oxidative stress, and that MagA attenuate (at least in part) such injury to MSCs.
Figure 7. The expression of p-p38 MAPK of MSCs. (a) Immunoblot analyses of p-p38 MAPK in MagA-MSCs and control cells. (b) The relative expression level of p-p38 MAPK. The x axis of (b) is the concentration of extracellular iron supplement. Date are the mean ± SEM (*p < .05, #p < .01, n = 5).
MagA contributes to reduced ferritin expression
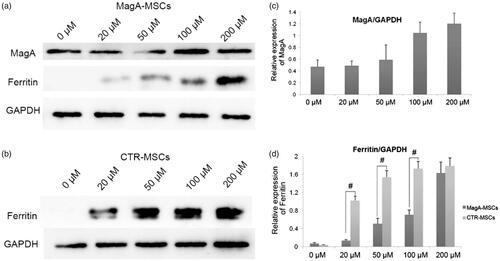
Based on the findings stated above, we undertook western blotting to further evaluate the iron metabolism of MagA-MSCs (). Ferritin as an iron-storage protein is response to variations in iron content. We found that even at a low concentration of iron (20 μM), ferritin expression in control cells was upregulated, and was increased steadily in an iron-dependent manner. Increased expression of ferritin in MagA-MSCs was obviously weaker than that of control cells (, #p < .01, n = 5), whereas a marked increase in expression of MagA protein was observed (). Nevertheless, the viability of MagA-MSCs was higher according to MTS assay, which inferred that MagA may help MSCs attenuate the injury caused by IO.
Figure 8. The expression of MagA and ferritin of MSCs. (a) Marked increase in expression of MagA protein but relatively low expression of ferritin was detected in MagA-MSCs. (b) Relatively high expression of ferritin with the concentration of Fe increase in control cells. (c) The relative expression level of MagA. (d) The relative expression level of ferritin in MagA-MSCs and control cells. The x axis of (c) and (d) is the concentration of extracellular iron supplement. Date are the mean ± SEM (#p < .01, n = 5).
MagA reduces inhibition of the osteogenic differentiation caused by IO
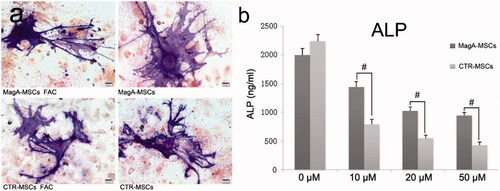
MagA-MSCs and CTR-MSCs co-cultured with 200 μM Fe could differentiate to osteoblast cells (). On day 13, we examined the ALP level in cell culture supernatant. ALP content was reduced to different degrees in a Fe concentration-dependent manner (10–50 μM iron supplement), which showed that ROS induced by excess iron influences osteogenic differentiation. However, the reduction in ALP level in MagA-MSCs was below than that of CTR-MSCs (, #p < .01, n = 5), suggesting that MagA-MSCs could reduce the inhibition of osteogenic differentiation induced by excess iron.
Figure 9. ALP staining and the content measurement of ALP after osteogenic differentiation. (a) MagA-MSCs and control cells with or without iron co-culture could induce differentiation to osteoblasts (ALP staining by fast blue RR salt). Scale bars: 100 µm. (b) ALP content in the two types of cells decreased with increasing iron concentration, but the decrease in ALP level of MagA-MSCs was lower than that of CTR-MSCs. The x axis is the concentration of extracellular iron supplement. Date are the mean ± SEM (#p < .01, n = 5).
Discussion
magA can be a MRI reporter gene for IO evaluation
Excess irons lead to various toxic effects such as cardiomyopathy, hepatic fibrosis and even haematologic disorders. The detection and evaluation of IO should be carried out in a timely manner. R2*-MRI can be used to estimate iron concentrations with high specificity and is a more accurate measure of IO compared with ferritin [Citation11].
magA has been reported to encode a protein with significant sequence homology to KefC (a K+-translocation protein in Escherichia coli) and NapA (a putative Na+/H+ antiporter from Enterococcus hirae) in Magnetospirillum species strain AMB-1 [Citation14,Citation18]. In mammalian cells, MagA expression can incorporate more iron and in response to increases in extracellular iron, leading to increased relaxation of MRI signals [Citation20,Citation21,Citation24]. Hence, we generated magA Tg mice and explored the role of magA on R2*-MRI.
Several vesicles of high electron density that resembled phagosomes in the cytoplasm of MagA-MSCs under IO were noted (). Zurkiya et al. [Citation20] reported similar particles in MagA-expressed 293 FT packaging cells. In vitro MRI results revealed that R2* value of MagA-MSCs in the presence of iron supplement was higher compared with those of CTR-MSCs (). Besides, the iron content of the former was higher than the latter (). Combining the TEM image and ICP-MS data with the R2* value, we hypothesized that magA participated in magnetosome-like particle formation in MSCs, which contributed to the intake and redistribution of iron, leading to larger magnetic particles and improvement in MRI sensitivity.
In vivo MRI results also showed a significant increase in R2* in the livers of magA Tg mice. The iron concentration in the liver of magA Tg mice in the presence or absence of iron supplement was greater than those of WT mice. The R2*-MRI results supported the use of magA as an MRI reporter gene and provided an experimental data for further study on quantitatively evaluating IO.
MagA could protect MSCs against ROS-induced IO
An excess of free reactive iron is toxic. Some reports have suggested that intracellular MRI labelling methods utilizing superparamagnetic iron oxide agents affect cell differentiation [Citation28–30]. Besides, excess amounts of iron injured bone-marrow stromal cells and disrupted haematopoiesis presumably by increasing ROS [Citation2]. Iron-chelation therapy attenuates (at least in part) MSC injury in turn [Citation1]. Whether MagA-labelled MSCs would suffer oxidative damage is not known. Considering the potential adverse effects on cell viability, we undertook a series of proliferation and cytotoxicity assays. Results showed that MagA attenuates the negative effects of ROS induced by IO in MSCs.
Free irons in the cytoplasm increase the ROS levels and cause iron cytotoxicity. MagA protein has been reported to be an H+/Fe2+ antiporter that may aid uptake of free irons into magnetosomes in mammalian cells. The MTS assay showed that excess amounts of iron weaken MSC proliferation, but that MagA can (at least in part) reduce this damage. The free radicals induced by Fe2+/Fe3+ cause lipid peroxidation [Citation31,Citation32], leading to disruption of phospholipid bilayer membranes [Citation32,Citation33]. Cell-membrane integrity measured by LDH leakage and ROS assay also indicate that the superiority of MagA in reducing cellular free-radical damage to MSCs caused by IO.
Sengupta et al. [Citation21] reported that MagA activity can elicit the same homeostatic response as expected of an increase in ferritin storage. Hence, the expression of MagA protein and ferritin was analysed by western blotting. The increased expression of ferritin in MagA-MSCs was obviously weaker than that of control cells, whereas a marked increase in expression of MagA protein occurred. Nevertheless, the viability of MagA-MSCs was higher according to MTS assay. The observed difference suggests that MagA-modified MSCs can compensate for increased exogenous iron by inducing expression of MagA and ferritin. The role of MagA protein is to detoxify free iron by its sequestration, which is expected to produce less undesirable physiologic effects in MSCs.
Hypoxia and oxidative stress may destroy the haematopoietic microenvironment of bone marrow [Citation2] and intracellular ROS retard osteogenic differentiation [Citation35]. Circumstantial evidence suggests that the antioxidant [Citation34] and antioxidant enzymes [Citation35] reduce ROS damage to during osteogenic differentiation of human MSCs. With this in mind, we assessed the change in differentiation capacity of MagA-MSCs upon IO. An unexpected reduction in ALP levels became apparent with an increase in iron concentration during osteogenic differentiation in both types of MSCs. The ALP activity of MagA-MSCs was higher than that of control cells, suggesting that MagA protein contributes to iron uptake, which reduces the generation and undesirable physiologic effects of intracellular ROS during osteogenic differentiation.
p38 MAPK activated by ROS has critical roles in the DNA damage resulting from genotoxic and oxidative stress [Citation36]. Chai et al. demonstrated that IO increases the ROS levels of HSCs through the NOX4/ROS/p38 MAPK signalling pathway [Citation4]. We found that p-p38 MAPK increased with increasing iron concentration, but MagA could reduce (at least in part) p-p38 MAPK expression. This finding further confirmed that IO may be closely related to oxidative stress, and that MagA could attenuate this injury to MSCs.
Conclusions
We demonstrated that use of magA as a magnetic reporter gene in MRI is feasible. MagA protein also attenuated undesirable injury of MSCs due to oxidative stress by increased levels of exogenous iron. We concluded that MagA could simultaneously increase the sensitivity of R2*-MRI for iron measurement and attenuate oxidative damage to the haematopoietic microenvironment. Hopefully, we will see wider use of magA Tg mice in therapeutic studies of transfusion-dependent haematologic diseases.
Disclosure statement
No potential conflict of interest was reported by the authors.
Additional information
Funding
References
- Zhang Y, Zhai W, Zhao M, et al. Effects of iron overload on the bone marrow microenvironment in mice. PLoS One. 2015;10:e0120219.
- Okabe H, Suzuki T, Uehara E, et al. The bone marrow hematopoietic microenvironment is impaired in iron-overloaded mice. Eur J Haematol. 2014;93:118–128.
- Oliva EN, Ronco F, Marino A, et al. Iron chelation therapy associated with improvement of hematopoiesis in transfusion-dependent patients. Transfusion. 2010;50:1568–1570.
- Chai X, Li D, Cao X, et al. ROS-mediated iron overload injures the hematopoiesis of bone marrow by damaging hematopoietic stem/progenitor cells in mice. Sci Rep. 2015;5:10181.
- Ghaffari S. Oxidative stress in the regulation of normal and neoplastic hematopoiesis. Antioxid Redox Signal. 2008;10:1923–1940.
- Lu W, Zhao M, Rajbhandary S, et al. Free iron catalyzes oxidative damage to hematopoietic cells/mesenchymal stem cells in vitro and suppresses hematopoiesis in iron overload patients. Eur J Haematol. 2013;91:249–261.
- Ozment CP, Turi JL. Iron overload following red blood cell transfusion and its impact on disease severity. Biochim Biophys Acta. 2009;1790:694–701.
- Crisponi G, Ambu R, Cristiani F, et al. Does iron concentration in a liver needle biopsy accurately reflect hepatic iron burden in beta-thalassemia? Clin Chem. 2000;46:1185–1188.
- Kohgo Y, Ikuta K, Ohtake T, et al. Body iron metabolism and pathophysiology of iron overload. Int J Hematol. 2008;88:7–15.
- Chandarana H, Lim RP, Jensen JH, et al. Hepatic iron deposition in patients with liver disease: preliminary experience with breath-hold multiecho T2*-weighted sequence. AJR Am J Roentgenol. 2009;193:1261–1267.
- Wood JC, Enriquez C, Ghugre N, et al. MRI R2 and R2* mapping accurately estimates hepatic iron concentration in transfusion-dependent thalassemia and sickle cell disease patients. Blood. 2005;106:1460–1465.
- Aessopos A, Fragodimitri C, Karabatsos F, et al. Cardiac magnetic resonance imaging R2* assessments and analysis of historical parameters in patients with transfusion-dependent thalassemia. Haematologica. 2007;92:131–132.
- Hankins JS, McCarville MB, Loeffler RB, et al. R2* magnetic resonance imaging of the liver in patients with iron overload. Blood. 2009;113:4853–4855.
- Nakamura C, Burgess JG, Sode K, et al. An iron-regulated gene, magA, encoding an iron transport protein of Magnetospirillum sp. strain AMB-1. J Biol Chem. 1995;270:28392–28396.
- Uebe R, Henn V, Schuler D. The MagA protein of Magnetospirilla is not involved in bacterial magnetite biomineralization. J Bacteriol. 2012;194:1018–1023.
- Komeili A. Molecular mechanisms of compartmentalization and biomineralization in magnetotactic bacteria. FEMS Microbiol Rev. 2012;36:232–255.
- Uebe R, Schüler D. Magnetosome biogenesis in magnetotactic bacteria. Nat Rev Microbiol. 2016;14:621–637.
- Nakamura C, Kikuchi T, Burgess JG, et al. Iron-regulated expression and membrane localization of the magA protein in Magnetospirillum sp. strain AMB-1. J Biochem. 1995;118:23–27.
- Bazylinski DA, Frankel RB. Magnetosome formation in prokaryotes. Nat Rev Microbiol. 2004;2:217–230.
- Zurkiya O, Chan AW, Hu X. MagA is sufficient for producing magnetic nanoparticles in mammalian cells, making it an MRI reporter. Magn Reson Med. 2008;59:1225–1231.
- Sengupta A, Quiaoit K, Thompson RT, et al. Biophysical features of MagA expression in mammalian cells: implications for MRI contrast. Front Microbiol. 2014;5:29.
- Goldhawk DE, Lemaire C, McCreary CR, et al. Magnetic resonance imaging of cells overexpressing MagA, an endogenous contrast agent for live cell imaging. Mol Imaging. 2009;8:129–139.
- Rohani R, Figueredo R, Bureau Y, et al. Imaging tumor growth non-invasively using expression of MagA or modified ferritin subunits to augment intracellular contrast for repetitive MRI. Mol Imaging Biol. 2014;16:63–73.
- Cho IK, Moran SP, Paudyal R, et al. Longitudinal monitoring of stem cell grafts in vivo using magnetic resonance imaging with inducible MagA as a genetic reporter. Theranostics. 2014;4:972–989.
- Guan X, Jiang X, Yang C, et al. The MRI marker gene MagA attenuates the oxidative damage induced by iron overload in transgenic mice. Nanotoxicology. 2016;10:531–541.
- Shen Y, Shao Y, He H, et al. Gadolinium(3+)-doped mesoporous silica nanoparticles as a potential magnetic resonance tracer for monitoring the migration of stem cells in vivo. Int J Nanomedicine. 2013;8:119–127.
- Ghugre NR, Enriquez CM, Coates TD, et al. Improved R2* measurements in myocardial iron overload. J Magn Reson Imaging. 2006;23:9–16.
- Kostura L, Kraitchman DL, Mackay AM, et al. Feridex labeling of mesenchymal stem cells inhibits chondrogenesis but not adipogenesis or osteogenesis. NMR Biomed. 2004;17:513–517.
- Bulte JW, Kraitchman DL, Mackay AM, et al. Chondrogenic differentiation of mesenchymal stem cells is inhibited after magnetic labeling with ferumoxides. Blood. 2004;104:3410–3413.
- Chen YC, Hsiao JK, Liu HM, et al. The inhibitory effect of superparamagnetic iron oxide nanoparticle (Ferucarbotran) on osteogenic differentiation and its signaling mechanism in human mesenchymal stem cells. Toxicol Appl Pharmacol. 2010;245:272–279.
- Zhu MT, Feng WY, Wang B, et al. Comparative study of pulmonary responses to nano- and submicron-sized ferric oxide in rats. Toxicology. 2008;247:102–111.
- Hoskins C, Cuschieri A, Wang L. The cytotoxicity of polycationic iron oxide nanoparticles: common endpoint assays and alternative approaches for improved understanding of cellular response mechanism. J Nanobiotechnol. 2012;10:15.
- Jain TK, Reddy MK, Morales MA, et al. Biodistribution, clearance, and biocompatibility of iron oxide magnetic nanoparticles in rats. Mol Pharm. 2008;5:316–327.
- Dai Z, Li Y, Quarles LD, et al. Resveratrol enhances proliferation and osteoblastic differentiation in human mesenchymal stem cells via ER-dependent ERK1/2 activation. Phytomedicine. 2007;14:806–814.
- Chen CT, Shih YR, Kuo TK, et al. Coordinated changes of mitochondrial biogenesis and antioxidant enzymes during osteogenic differentiation of human mesenchymal stem cells. Stem Cells. 2008;26:960–968.
- Emerling BM, Platanias LC, Black E, et al. Mitochondrial reactive oxygen species activation of p38 mitogen-activated protein kinase is required for hypoxia signaling. Mol Cell Biol. 2005;25:4853–4862.