
 ?Mathematical formulae have been encoded as MathML and are displayed in this HTML version using MathJax in order to improve their display. Uncheck the box to turn MathJax off. This feature requires Javascript. Click on a formula to zoom.
Abstract
A novel drug carrier was designed based on a new biomaterial, that is, graphene oxide (GO), to improve the efficiency and specificity of anticancer drug. In this study, GO was successively modified with polyetheramine (PEA) and hyaluronic acid (HA). The carrier was utilized to load an antitumor component, that is, quercetin (Que), which was derived from traditional Chinese medicine, namely the pagoda tree flower bud. This drug delivery system (DDS) exhibited pH sensibility under subacid condition and good biocompatibility even when GO concentration reached 350 μg/mL. Moreover, the antitumor efficacy was doubly improved and more long-acting compared with Que alone. Results show that the GO-based material has potential clinical applications for antitumor drug delivery.
Graphical Abstract
Introduction
Many novel drug carriers have been reported in the biomedical field to circumvent drawbacks associated with anticancer drugs in chemotherapy. Although such modified carriers have exhibited numerous advantages, such as drug solubilization and prolonged blood circulation, their efficacy is largely constrained by their lack of targeted delivery and controlled drug release capabilities. Moreover, insufficient cell uptake further decreases therapeutic efficacy and non-specific accumulation in normal tissues leads to serious side effects, thereby limiting the clinical use of these modified carriers.
The discovery of graphene, which is a notable achievement in the field of novel carbon nanomaterials, has triggered the worldwide exploration of the biomedical applications of this material since 2004 because of its unique properties [Citation1]. The 2 D planar structure, large surface area, satisfactory chemical stability, excellent mechanical stability and good biocompatibility of graphene are promising for applications in drug delivery systems (DDSs) [Citation2–5]. However, disadvantages, such as sharp edges and reactive oxygen species (ROS) generation, are difficult to avoid when pristine graphene oxide (GO) is used as a drug carrier [Citation6]. Polymers, such as protein, [Citation7] chitosan, [Citation8] sodium alginate, [Citation9,Citation10] polyethylene glycol, [Citation11] and poly(N-isopropylacrylamide), [Citation12] have been utilized to modify GO to overcome these disadvantages. Meanwhile, the large 2 D plane of GO provides a large specific surface area that can be modified using various polymers via surface adsorption, [Citation13] hydrogen bonding, [Citation14] and other types of interactions [Citation15]. Thus, the development of GO-based DDSs has rapidly increased.
Quercetin (Que), which is a type of flavonoid, exhibits several pharmacological activities, such as antitumour, anti-oxidation, anti-inflammation and anti-ageing [Citation16,Citation17]. Numerous researchers have found that Que expresses an anti-breast cancer effect via the following routes. (1) Que can increase Bax protein (a type of pro-apoptotic protein) expression but decrease Bcl-2 protein (a type of anti-apoptotic protein) expression [Citation18]. (2) Que can suppress COX-2 expression by inhibiting p300 signalling and blocking the binding of multiple trans-activators to the COX-2 promoter, and then, it can control the cell cycle and induce apoptosis [Citation19]. (3) Que can inhibits Akt signaling, induces cell cycle arrest and inhibits breast cancer cell and tumour growth [Citation20,Citation21].
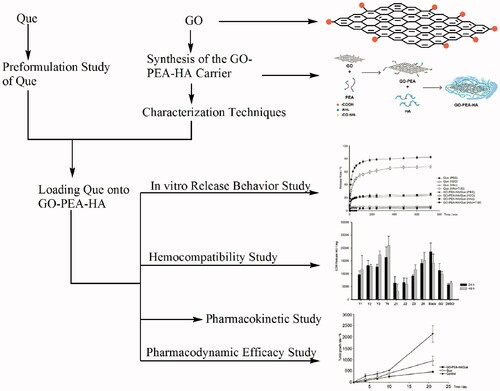
In the present study, GO was used as the matrix to prepare a pH-sensitive DDS, with Que as the pH-sensitive drug, and hyaluronic acid (HA) and polyetheramine (PEA) as the mediators. Furthermore, we characterized GO–PEA–HA/Que to confirm the synthetic procedure. Afterward, we evaluated the release profile, biocompatibility, cytotoxicity, pharmacokinetics and pharmacodynamics of GO–PEA–HA/Que DDS.
Experimental section
Materials
1–(3-Dimethylaminopropyl)-3-ethylcarbodiimide hydrochloride (EDC) was purchased from Shanghai Spectrum Biotechnology Co., Ltd. (Shanghai, China). PEA (MW = 230 Da), HA (MW =110 kDa), and dialysis membranes (diameter = 34 mm), which had molecular weight cutoffs of 8000–14,000 and 100,000, were purchased from Shanghai Yuanye Biotechnology Co., Ltd. (Shanghai, China). Que was purchased from Shanghai Nature Standard Biotechnology Co., Ltd. (Shanghai, China). Sulfamethoxazole was purchased from China National Institute for Drug and Biological Products (Shanghai, China). Amplite (LDH) Assay Kit, eBioscience Human Bcl-2 Platinum ELISA Kit, and Cellbio In Vitro ROS/RNS Assay Kit were purchased from Shanghai BioTNT Co. (Shanghai, China). Graphite flakes, sodium nitrate (NaNO3), potassium persulphate (K2S2O8), potassium permanganate (KMnO4), phosphorus pentoxide (P2O5), hydrogen peroxide (H2O2, 30%), hydrochloric acid (HCl), concentrated sulphuric acid, N-hydroxysuccinimide (NHS), and other analytical grade reagents were purchased from Sinopharm Chemical Reagent Co., Ltd. (Shanghai, China).
Preformulation study of que
Before proceeding with the design and preparation, we must first identify the characteristics of the target drug. Therefore, we determined the metabolic stability of liver microsomes, plasma protein binding rate, and kinetic solubility of Que.
Metabolic stability of liver microsomes
The metabolic stability of liver microsomes was determined according to the method used by Jenkins et al. [Citation22]. In this method, 2 μL drug solutions (omeprazole, dextromethorphan, and Que; the concentrations of all the solutions were 0.25 mM) were added into a 96-well plate that contained 398 μL rat or human liver microsome diluent. The 96-well plate was incubated at 37 °C, with a rotation rate of 100 rpm. The concentrations were 1 μM. Subsequently, 100 μL reaction liquid was removed from each well at 0, 10, 30 and 90 min for sample analysis. Furthermore, preheated fresh regeneration media of equal volume were added for compensation at every withdrawal. After centrifugation at 5000×g for 15 min at 4 °C, the supernatants were diluted and determined using a liquid chromatography–tandem mass spectrometry (LC–MS/MS) system. Each compound was determined in duplicate.
The equations for T1/2 and protein concentration are expressed as follows:
(1)
(1)
(2)
(2)
where k is the slope and V/M is the 1/(protein concentration).
Plasma protein binding rate
The plasma protein binding rate is a crucial parameter used to determine the extent and duration of the therapeutic action of a drug; it is useful in the design of optimal drug delivery schemes and the estimation of safe doses [Citation23]. The plasma protein binding rate was determined according to the method used by Zhang et al., as reported with slight modifications [Citation24]. In this method, 1.6 ml rat or human blood plasma solutions were prepared separately with Que (2 μM), propranolol (2 μM), and diclofenac (2 μM). Then, 300 μL of the aforementioned solutions were added into the sample chamber (A) of the equilibrium dialysis tubes and 500 μL phosphate-buffered saline (PBS) was added into the dialysate chamber (B). After the chambers were incubated for 4 h at 37 °C with a rotation rate of 100 rpm, the samples were transferred into a 96-well plate. Subsequently, 50 μL of sample A was added to 50 μL PBS and 50 μL of sample B was added to 50 μL relevant blank plasma. Then, these samples were determined using the LC–MS/MS system. Each compound was determined in duplicate.
The equation of the plasma protein binding rate is expressed as follows:
(3)
(3)
(4)
(4)
where C is the drug concentration.
Kinetic solubility test
A kinetic solubility assay is the method of choice for determining the maximum solubility of a compound under most reaction or assay conditions [Citation25]. Each compound was dissolved in dimethyl sulphoxide (DMSO) as a stock solution with a concentration of 10 mg/mL. Then, each solution was further diluted in PBS (100 mM, pH 7.4). The final DMSO concentration was 1% (v/v). The samples were incubated for 120 min at 37 °C and centrifuged at 4000×g for 15 min. The supernatants were reacted at room temperature for 120 min. Then, these samples were diluted and determined using the LC–MS/MS system [Citation26]. Each compound was determined in duplicate.
Synthesis of the GO–PEA–HA carrier
GO was prepared from purified graphite flakes according to the modified Hummers’ method [Citation27]. In detail, graphite flakes (2 g), K2S2O8 (3 g), and P2O5 (3 g) were vigorously stirred in concentrated H2SO4 (75 ml) at 80 °C for 24 h. After the reaction, graphite oxide was washed repeatedly with distilled water until the pH of the supernatant became neutral and then dried under vacuum. Afterward, KMnO4 (4 g) was gradually added to the mixed solution, which contained graphite oxide (1 g), NaNO3 (1 g) and concentrated H2SO4 (50 ml) with the aid of an ice bath. Then, the mixture was stirred at room temperature for 48 h. After ultrasonication for 2 h, the mixture was heated at 98 °C, and 5 wt.% H2SO4 (100 ml) was gradually added to the mixture and maintained at 98 °C for 2 h. Subsequently, the mixture was cooled to 60 °C and 30% H2O2 (3.2 ml) was added. After magnetic stirring at 400 rpm for 2 h, the mixture was centrifuged at 12,000 rpm for 15 min and the supernatant was removed. The precipitate was sequentially washed with 5% H2SO4/0.5% H2O2 (10 times) and 5% HCl solution (5 times) and repeatedly washed with distilled water until the pH of the supernatant became neutral. Finally, the material was lyophilized to obtain loose GO powder.
PEA, as a mediator, was modified into GO to form GO–PEA [Citation8]. In detail, GO (50 mg) was dispersed adequately in distilled water (40 ml). EDC (50 mg) and NHS (25 mg) co-dissolved in distilled water (10 ml) were added dropwise to the GO solution under magnetic stirring at 200 rpm at room temperature to activate the carboxyl of GO. After 3 h of activation, PEA solution (50 ml, 1 mg/mL) was added dropwise, and the mixture was further stirred at 200 rpm at room temperature for 24 h. After the reaction, the dialysis membranes (MW = 8,000–14,000) were used to remove excess reagents, and GO–PEA was obtained.
The carrier, that is, GO–PEA–HA, was synthesized using the same method [Citation8]. First, EDC (50 mg) and NHS (25 mg) were added to the HA solution (50 ml, 1 mg/mL) and stirred at 200 rpm for 3 h to activate the carboxyl of HA. Then, the GO–PEA solution (50 ml, 1 mg/mL) was added dropwise to the activated HA solution, and the mixture was further stirred at 200 rpm at room temperature for 24 h. Finally, the GO–PEA–HA carrier was obtained after dialysis (MW = 100,000) and lyophilization.
Characterization techniques
Fourier transform infrared (FTIR) analysis was conducted on a Nicolet iS50 spectrometer (Thermo Fisher Scientific, Waltham, MA) over the range of 4000–500 cm−1 and with a resolution of 2 cm−1. Samples were prepared using the KBr disk method (5 mg sample in 200 mg KBr). Quanta 250 scanning electron microscope (FEI, Hillsboro, OR) with an EM SCD050 ion sputter plating instrument (Leica, Wetzlar, Germany) and H-600 transmission electron microscope (Hitachi Ltd., Tokyo, Japan) were used to characterize the morphology of the GO–PEA–HA carrier. A solution of the sample (5 mg/mL) was dropped onto a carbon-coated copper grid and air-dried before transmission electron microscopy (TEM) analysis.
Loading que onto GO–PEA–HA
Que was loaded through π–π stacking [Citation28]. GO–PEA–HA was dispersed adequately in distilled water at room temperature, and excess Que was added to the solution under magnetic stirring at 200 rpm for 48 h. Then, the mixture was dialyzed to remove the unconnected Que. Finally, the resulting precipitate was lyophilized to obtain the GO–PEA–HA/Que DDS. The extent of Que loading onto GO–PEA–HA/Que was determined with a high-performance liquid chromatography (HPLC) system at the wavelength of 360 nm [Citation29].
In vitro release behaviour study
The in vitro release behaviour studies of Que and GO–PEA–HA/Que were performed using the Chinese Pharmacopoeia (2015) type-III dissolution apparatus [Citation30]. The dissolution media were 200 ml distilled water, PBS (pH 7.21), acetate buffer (pH 5.56), and acetate buffer containing 0.25% Tween 80 (pH 5.56) at 37 ± 0.5 °C. The stirring speed was 100 rpm. Que and GO–PEA–HA/Que, which contained approximately equivalent amounts of 5 mg Que, were immersed in the dissolution media. Sample solutions of 2.0 ml were withdrawn at specific time intervals and filtered with a 0.22-μm membrane for sample analysis. Furthermore, preheated fresh media of equal volume were added for compensation at every withdrawal. Que concentration in the samples was determined using the HPLC system, as described previously, and the cumulative drug dissolution rate at each time point was profiled. Each experiment was performed in triplicate.
Hemocompatibility study
Fresh rat whole blood was obtained from healthy rats to evaluate the haemolysis ratio of GO and GO–PEA–HA [Citation31,Citation32]. In detail, 4 ml fresh rat whole blood was diluted in 5 ml physiological saline to obtain the diluent plasma. Different concentrations (i.e., 350, 300, 250, 200, 150, 100, 50, 10, 5, 2.5 and 1 µg/mL) of GO and GO–PEA–HA solutions were prepared with physiological saline to obtain the material solutions. Then, every 10 ml material solution was added 200 μL diluent plasma, and the mixture was incubated for 60 min at 37 °C with a rotation rate of 100 rpm. Afterward, the mixture was centrifuged at 10,000 rpm for 10 min, and 200 μL of the supernatant was transferred to a 96-well plate to measure the optical density (OD) at 545 nm. Each experiment was performed in triplicate. In addition, 200 μL diluent plasma was added to 10 ml distilled water as the positive control, and 200 μL diluent plasma was added to 10 ml physiological saline as the negative control. The equation for the haemolysis ratio is expressed as follows:
(5)
(5)
where ODs is the optical density of the sample, ODn is the optical density of the negative control, and ODp is the optical density of the positive control.
Cytotoxicity measurement
The in vitro cytotoxicity investigation was conducted via ROS and LDH assays. [Citation6,Citation33,Citation34] MDA-MB-231 was used and cultured in DMEM supplemented with streptomycin (100 g/mL) and 10% heat-inactivated FBS. For cell safety measurements, 1 ml cells were seeded into 6-well plates at a density of 1 × 10⁶ cells per well. After overnight incubation at 37 °C in a humidified 5% CO2-containing atmosphere, the medium was removed and fresh medium with different concentrations of Que (i.e., 50, 100, 200 and 400 μM), GO–PEA–HA/Que (with an equivalent concentration of Que), and GO–PEA–HA (with a concentration equal to a 200 μM concentration of GO–PEA–HA in GO–PEA–HA/Que) were added into each well. GO and HA were added into each well by following the same operation. After incubation for another 24 h or 48 h, as described previously, the cells were immediately rinsed twice with PBS prewarmed to 37 °C. The cells were treated according to the instructions of the manufacturer.
Before being rinsed with PBS, 100 μL of each cell-free supernatant was transferred to a new 96-well plate and mixed with 100 μL LDH reagent. After incubation for 3 h under standard conditions, OD was determined at 570 nm using a microplate reader.
In addition, after being rinsed with PBS, the cells were supplemented with 20 μM DCFH–DA and incubated for another 30 min at 37 °C. The cells were rinsed with PBS, and 2 ml PBS was added into each well. Then, fluorescence intensity was determined with excitation at 480 nm and emission at 530 nm.
Pharmacokinetic study
Male Sprague–Dawley (SD) rats weighing 180–220 g were obtained from Shanghai SIPPR-Bk Laboratory Animal Co. Ltd. and allowed to acclimate for five days before analysis. The experiment was conducted according to the standards of the Animal Ethics Committee of Shanghai University of Traditional Chinese Medicine.
For the kinetic study of Que and GO–PEA–HA/Que, the SD rats were injected intravenously (i.v.) with 600 μg/kg of each compound (five rats per group). Blood was collected via orbital venous plexus puncture at 2 min, 5 min, 15 min, 30 min, 45 min, 1 h, 2 h, 4 h, 6 h and 8 h post-injection to assess its circulation levels (CLs). The samples were placed in heparin sodium (20%, 2 μL) anticoagulative tubes and centrifuged at 6000 rpm for 8 min to obtain plasma, after which plasma samples were stored at −20 °C [Citation35]. All plasma samples were determined using the LC–MS/MS system.
HPLC was performed on a Waters ACQUITY UPLC™ HSS C18 (100 mm × 2.1 mm, 1.8 µm). The mobile phase consisted of A 0.05% formic acid and B acetonitrile, and the elution program is shown in . The flow rate was 0.4 mL/min, and the injection volume was 5 µL. LC–MS/MS with electrospray ionization in negative mode was performed using an Agilent Technologies 6490 instrument. Source conditions constituted of a capillary voltage of 3500 V, a sheath gas temperature of 100 °C, a gas temperature of 350 °C, a gas flow of 12 L/min, and a nebulizer gas pressure of 40.0 psi. The reaction was conducted in a multireaction selective ion mode, and the tapered voltages of different substances were measured separately. The specific parameters are provided in .
Table 1. Elution program of the plasma samples.
Table 2. Parameters of mass spectrometry.
Pharmacodynamic efficacy study
Female BALB/c athymic nude mice that weighed 14–16 g were obtained from Shanghai SIPPR-Bk Laboratory Animal Co. Ltd. and allowed to acclimate for five days before analysis. The experiment was conducted according to the standards of the Animal Ethics Committee of Shanghai University of Traditional Chinese Medicine.
The tumour-bearing mice model and the experimental process were performed as follows. MDA-MB-231 cells were grown in DMEM supplemented with 10% heat-inactivated FBS. Then, 3 × 10⁶ cells per animal were initially injected subcutaneously (s.c.) into the right axilla of nude mice. For the in vivo pharmacodynamic efficacy experiment, tumours (larger than 800 mm3) were excised and non-necrotic areas were cut into fragments that measured 2 mm × 2 mm × 2 mm. The tumour fragments were washed with sterile PBS and one tumour fragment per animal was transplanted s.c. into the right axilla. Tumour volumes (length × width × width/2) and body weights were measured thrice weekly until the tumour volumes were larger than 100 mm3 [Citation36]. On Day 1, the GO–PEA–HA/Que and Que groups were injected i.v. with the same dosage of 40 μg Que per animal and the control group was injected i.v. with the same volume of physiological saline. The injection was administered every three days until Day 13, and the experiment was terminated at Day 21. The antitumor activity was calculated using the following equation:
(6)
(6)
where
is the tumour volume on Day n and
is the tumour volume on Day 0.
Results
Preformulation study of que
The results of the preformulation study of Que are presented in . The results showed that the T1/2 of the metabolic stability of Que in humans and rats was 243.2 min and 21.5 min, respectively; and the CLs in humans and rats were 5.7 µL/min/mg and 64.5 µL/min/mg, respectively. The plasma protein binding rates exceeded 95% in human and rat plasma. Moreover, the solubility of Que was 3.96 µg/mL in PBS.
Table 3. Results of the preformulation study of que.
Synthesis and characterization of GO–PEA–HA/que
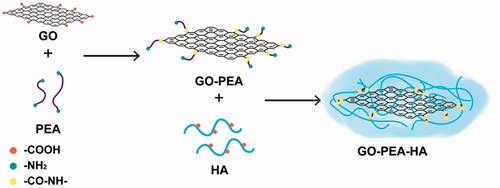
The preparation of GO–PEA–HA/Que is shown in . First, GO was prepared using the improved Hummers’ method. Then, PEA was used to modify GO. In detail, the carboxyl group on GO and the amino group on PEA reacted with the aid of EDC and NHS to form an amide bond. Subsequently, the obtained GO–PEA was modified with HA via the previously presented theory. Finally, Que was loaded onto the GO–PEA–HA carrier by π–π stacking. A high drug loading of 46.06% was measured using the HPLC method.
Figure 1. Diagram of the synthesis of GO–PEA–HA/Que.
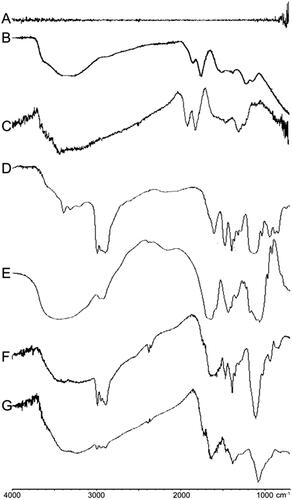
GO, GO–PEA, GO–PEA–HA, and GO–PEA–HA/Que were characterized via FTIR analysis, scanning electron microscopy (SEM), and TEM. The synthesis of GO and the formation of the GO–PEA–HA carrier were confirmed via FTIR analysis. shows the spectrogram of graphite, which indicates that graphite has no characteristic absorption peak. illustrates the synthetic GO. illustrates the commercially available GO. The synthetic GO exhibits the same characteristic absorption peaks, including carboxyl groups, which have a C=O stretching vibration peak at 1,718 cm−1 and a C–O stretching vibration peak at 1,224 cm−1; epoxy group, which has a C–O stretching vibration peak at 1,056 cm−1; and hydroxyl group, which has vibration and deformation peaks of O–H groups at 3,227 cm−1 and 1,363 cm−1, respectively [Citation37,Citation38]. These findings indicate the successful synthesis of GO. show the characteristic absorption peaks of PEA and HA, respectively. show that the characteristic absorption peaks of PEA and HA can be observed on the corresponding site. also show the reduction of the characteristic absorption peaks of the carboxyl group (1,718 cm−1) on GO and HA and the characteristic absorption peaks of the amino group (2,970 cm−1) on PEA [Citation39]. These findings indicate the successful synthesis of GO–PEA–HA.
Figure 2. FTIR spectra of graphite (A), synthetic GO (B), commercially available GO (C), PEA (D), HA (E), GO–PEA (F), and GO–PEA–HA (G).
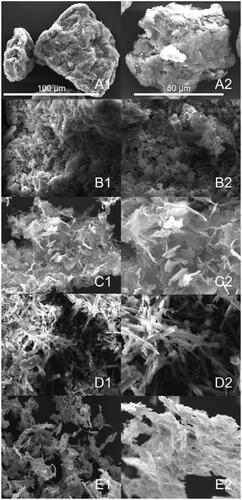
In addition, the morphologies of GO, HA, GO–PEA–HA, Que, and GO–PEA–HA/Que were characterized via SEM, as shown in . Compared with GO, GO–PEA–HA retained a lamellar structure and HA was modified with GO. In , the characteristic crystal structure of Que (columnar) can be observed clearly [Citation40].
Figure 3. SEM images of GO (A), HA (B), GO–PEA–HA (C), Que (D), and GO–PEA–HA/Que (E).
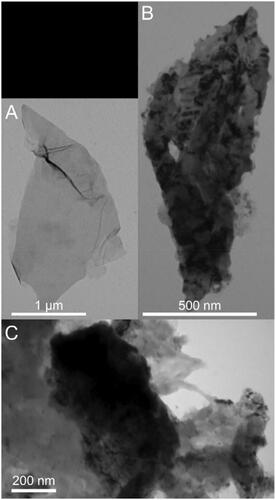
Furthermore, the morphologies of GO and GO–PEA–HA/Que were characterized via TEM, as shown in . shows that GO possesses a translucent lamellar structure with a sharp edge. For GO–PEA–HA/Que, shows the retained lamellar structure of GO, and Que was dispersed on the surface of GO. shows the state of HA grafted onto GO–PEA–HA/Que, in which HA coated the edge of GO to passivate the sharp edge [Citation41].
Figure 4. TEM images of GO (A) and GO–PEA–HA/Que (B and C).
Release behaviour of GO–PEA–HA/que
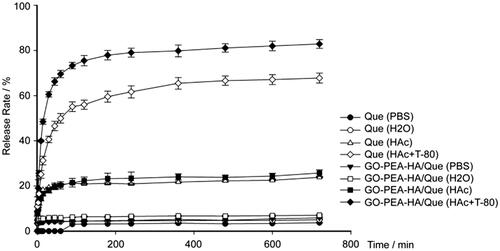
Drug release from a carrier depends on different factors, such as pH values, carrier materials, particle sizes, and interactions between the drug and the carrier. In this study, the in vitro release behaviour of Que from GO–PEA–HA/Que was determined under different pH values [Citation42]. shows the low release profiles of Que and GO–PEA–HA/Que despite being rinsed with distilled water or PBS and the high release profiles of Que and GO–PEA–HA/Que under subacid condition. Moreover, Tween 80 in dissolution media was used to prove that the GO–PEA–HA carrier exerted no inhibiting effect on Que release, and the release profile was higher than that of Que because of the existence of the GO–PEA–HA carrier.
Figure 5. Release profiles of Que and GO–PEA–HA/Que under different pH conditions.
Hemocompatibility study
The results of the hemocompatibility study are provided in . Infaust interface interaction between red blood cells and biomaterials in physiological saline has the opportunity to cause the leakage of intercellular haemoglobin, which indicates the occurrence of haemolysis. Therefore, when the haemolysis ratio is less than 5%, a material can be identified as a biosafety material according to the IOS 10993–4 standard [Citation32,Citation43]. The results showed that all the haemolysis ratios were below 5% even when the material concentration reached 350 μg/mL.
Table 4. Haemolysis ratios of GO and GO–PEA–HA (n = 3).
Cytotoxicity measurement
The cytotoxicity of GO to cells was investigated via LDH and ROS assays. MDA-MB-231 cells were used; and Que, GO, GO–PEA–HA and GO–PEA–HA/Que were incubated with MDA-MB-231 for 24 h or 48 h, followed by LDH and ROS assays. shows the positive correlativity between LDH release and drug concentration within the same group. Moreover, under the same drug concentration, GO–PEA–HA/Que exerted less influence on LDH release than Que and GO [Citation6]. shows the positive correlativity between ROS generation and drug concentration within the same group. Moreover, under the same drug concentration, GO–PEA–HA/Que exerted less influence on ROS generation than Que and GO [Citation34].
Figure 6. Result of LDH assay.
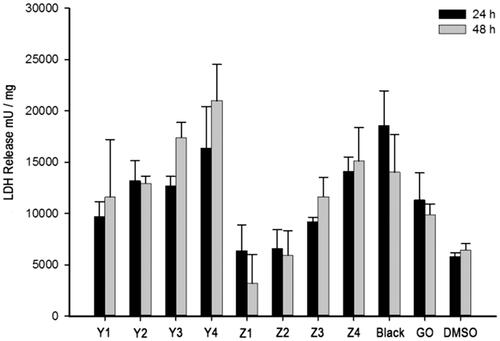
Figure 7. Result of ROS assay.
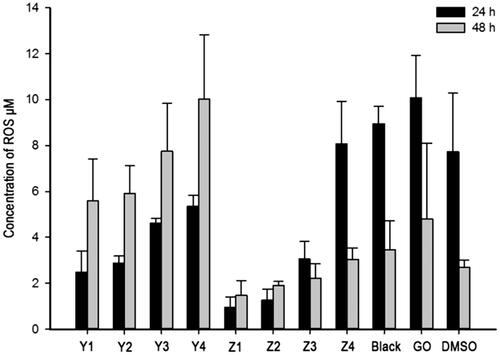
In and , Y1 to Y4 denote the Que group with concentrations of 50, 100, 200 and 400 μmol/L; Z1 to Z4 denote the GO–PEA–HA/Que group with concentrations of 50, 100, 200 and 400 μmol/L; Black denotes the GO–PEA–HA group with the same GO concentration as Z3; GO denotes the GO group with the same GO concentration as Z3; and DMSO denotes the DMSO group without any material or drug.
Pharmacokinetic study
shows the analysis results of the pharmacokinetic study via DAS 3.2 software. GO–PEA–HA/Que achieved a higher Cmax and AUC0–∞ and a lower CL than Que, which ensure that Que reached the therapeutic concentration. However, no improvement in MRT0–∞ and T1/2 was observed, which indicates that GO–PEA–HA/Que is not characterized by a prolonged blood circulation.
Table 5. Results of the pharmacokinetic study (n = 5).
Pharmacodynamic efficacy study
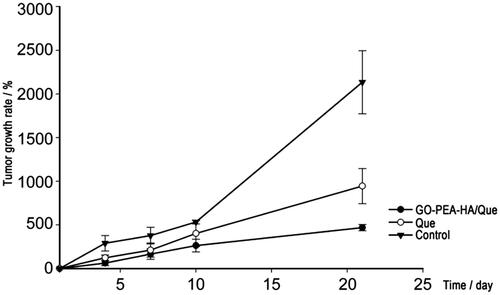
shows the results of the pharmacodynamic efficacy study in 21 days. Compared with the control group (2,135% growth rate), the Que group (944.6% growth rate) and the GO–PEA–HA/Que group (469.0% growth rate) were better for tumour growth. Compared with the Que group, the GO–PEA–HA/Que group exhibited twofold improvement and a more stable inhibiting effect. After the medicine pause (Day 10), the inhibiting effect of the GO–PEA–HA/Que group did not change, whereas the inhibiting effect of the Que group slightly decreased.
Figure 8. Results of the pharmacodynamic efficacy study (n = 7).
Discussion
As a tyrosine kinase inhibitor, quercetin is able to modulate multiple signalling pathways that would have considerable implications in the therapeutic and prophylactic values for diseases such as cancer [Citation44]. Quercetin is an ideal candidate for targeting breast cancer tumours because of their unique expression of tyrosinase. Tyrosinase is able to activate quercetin, which can form a reactive o-quinone. This o-quinone can then trigger p53-dependent apoptosis and cell cycle arrest [Citation45].
In the experiments, we used MDA-MB-231 cells for cytotoxicity measurement experiments. And in pharmacodynamic studies, the tumour-bearing mouse model was obtained by s.c. of MDA-MB-231 cells into the right axilla of nude mice. Numerous studies have demonstrated that at the molecular level, quercetin can achieve its antitumour activity through a number of possible mechanisms: (1) Quercetin markedly inhibited the caseinolytic activity of Stromelysin 1 (matrix metalloproteinase 3) and significantly inhibited the in vitro invasion of MDA-MB-231 cells in a concentration-dependent manner [Citation46]. (2) Quercetin increase connexin 43 and suppress MDA-MB-231 cell proliferation at physiologically relevant concentrations [Citation47]. (3) Quercetin results in human breast cancer MDA-MB-231 cell death through mitochondrial- and caspase-3-dependent pathways [Citation18].
In this research, we first determined the characteristics of the target drug. The results showed that Que had an ordinary metabolism speed in human liver microsomes and a slow metabolism speed in rat liver microsomes. However, Que had high plasma protein binding rates in human and rat plasma. Furthermore, Que had a relatively low solubility in PBS.
GO was synthesized using the modified Hummers’ method. Then, amidation was performed to synthesize the GO–PEA–HA carrier. Finally, Que was loaded onto the GO–PEA–HA carrier to prepare the GO–PEA–HA DDS through π–π stacking. The FTIR, SEM, and TEM results show that GO and GO–PEA–HA/Que were successfully prepared. The TEM result showed the pattern of GO–PEA–HA/Que in water, in which HA coated the edge of GO to passivate the sharp edge. In addition, due to the targeting characteristics of HA, GO–PEA–HA/Que had potential tumour-targeting characteristics.
The release behaviour results showed that Que exhibited pH sensibility regardless of whether it is loaded onto the GO–PEA–HA carrier. However, when it was loaded onto the carrier, Que exhibited a high release behaviour under different pH conditions, particularly under subacid condition, but showed a low release behaviour under neutral conditions. The pH sensibility of Que qualified the GO–PEA–HA/Que targeting characteristics for the sub-acid tumour microenvironment and reduced the release in normal tissue or body fluid to enhance the safety of the formulation.
The hemocompatibility results showed that the biocompatibility of GO and GO–PEA–HA conformed to the regulations of biomaterials. The haemolysis ratio of GO–PEA–HA was lower than that of GO under the same conditions. This phenomenon may be attributed to the HA coating that passivated the sharp edge of GO.
Many researchers reported that graphene derivatives can induce the leakage of intracellular LDH molecules into the culture medium, which is an important factor for determining membrane integrity, [Citation48] and the generation of oxidative stress, which is one of the important factors involved in triggering cell death, because of the sharp edge and the special planar structure of GO [Citation49]. The results showed that GO–PEA–HA/Que exhibited a dose- and time-dependent manner. Moreover, the plasma membrane damage and the induction of oxidative stress effects were lower than that of Que. Therefore, GO–PEA–HA/Que can reduce cytotoxicity and improve biocompatibility.
The pharmacokinetic study and pharmacodynamic efficacy study results showed that, although the GO–PEA–HA carrier cannot increase the residence time of Que, GO–PEA–HA can improve effective concentration to ensure that the therapeutic concentration is achieved. The antitumor effect exhibited a substantial improvement when using GO–PEA–HA/Que compared with using Que alone.
All these results indicate that GO–PEA–HA is an ideal drug carrier for the targeted delivery and controlled release of anticancer drugs. This study can be used as a guide by future scholars in formulating novel ideas and as research support.
Conclusions
In this study, we prepared a Que-loading DDS based on GO, which possessed pH sensibility and potential tumour-targeting characteristics. The formulation exhibited high drug loading, excellent biosafety and biocompatibility, and good efficacy, which could inspire novel ideas for the development of GO DDS and the antitumor application of traditional Chinese medicine with low toxicity.
Disclosure statement
The authors report no conflicts of interest in this work.
Additional information
Funding
References
- Novoselov K, Geim A, Morozov S, et al. Electric field effect in atomically thin carbon films. Science. 2004;306:666–669.
- Chen D, Zhang H, Liu Y, et al. Graphene and its derivatives for the development of solar cells, photoelectrochemical, and photocatalytic applications. Energy Environ Sci. 2013;6:1362.
- Geim AK. Graphene: Status and prospects. Science. 2009;324:1530–1534.
- Wang X, Sun G, Routh P, et al. Heteroatom-doped graphene materials: syntheses, properties and applications. Chem Soc Rev. 2014;43:7067–7098.
- Yang Y, Asiri AM, Tang Z, et al. Graphene based materials for biomedical applications. Materials Today. 2013;16:365–373.
- Lammel T, Boisseaux P, Fernandez-Cruz M-L, et al. Internalization and cytotoxicity of graphene oxide and carboxyl graphene nanoplatelets in the human hepatocellular carcinoma cell line Hep G2. Part Fibre Toxicol. 2013;10:27.
- Liu G, Shen H, Mao J, et al. Transferrin modified graphene oxide for glioma-targeted drug delivery: in vitro and in vivo evaluations. ACS Appl Mater Interfaces. 2013;5:6909–6914.
- Yang H, Bremner DH, Tao L, et al. Carboxymethyl chitosan-mediated synthesis of hyaluronic acid-targeted graphene oxide for cancer drug delivery. Carbohyd Polym. 2016;135:72–78.
- Zheng H, Yang J, Han S. The synthesis and characteristics of sodium alginate/graphene oxide composite films crosslinked with multivalent cations. J Appl Polym Sci. 2016;133
- Wang J, Liu C, Shuai Y, et al. Controlled release of anticancer drug using graphene oxide as a drug-binding effector in konjac glucomannan/sodium alginate hydrogels. Colloid Surfaces B. 2014;113:223–229.
- Diez-Pascual AM, Diez-Vicente AL. Poly(propylene fumarate)/polyethylene glycol-modified graphene oxide nanocomposites for tissue engineering. ACS Appl Mater Interfaces. 2016;8:17902–17914.
- Fan X, Chung JY, Lim YX, et al. Review of adaptive programmable materials and their bioapplications. ACS Appl Mater Interfaces. 2016;8:33351–33370.
- Yang Y, Zhang YM, Chen Y, et al. Construction of a graphene oxide based noncovalent multiple nanosupramolecular assembly as a scaffold for drug delivery. Chem Eur J. 2012;18:4208–4215.
- Compton OC, Cranford SW, Putz KW, et al. Tuning the mechanical properties of graphene oxide paper and its associated polymer nanocomposites by controlling cooperative intersheet hydrogen bonding. ACS Nano. 2012;6:2008–2019.
- Duch MC, Budinger GR, Liang YT, et al. Minimizing oxidation and stable nanoscale dispersion improves the biocompatibility of graphene in the lung. Nano Lett. 2011;11:5201–5207.
- Wang P, Henning SM, Magyar CE, et al. Green tea and quercetin sensitize PC-3 xenograft prostate tumors to docetaxel chemotherapy. J Exp Clin Cancer Res. 2016;35:73.
- Srivastava S, Somasagara RR, Hegde M, et al. Quercetin, a natural flavonoid interacts with DNA, arrests cell cycle and causes tumor regression by activating mitochondrial pathway of apoptosis. Sci Rep. 2016;6:24049.
- Chien SY, Wu YC, Chung JG, et al. Quercetin-induced apoptosis acts through mitochondrial- and caspase-3-dependent pathways in human breast cancer MDA-MB-231 cells. Hum Exp Toxicol. 2009;28:493–503.
- Xiao X, Shi D, Liu L, et al. Quercetin suppresses cyclooxygenase-2 expression and angiogenesis through inactivation of p300 signaling. .PLoS One. 2011;6:e22934.
- Tan M, Rivera Rivera A, Castillo-Pichardo L, et al. Anti-breast cancer potential of quercetin via the Akt/AMPK/mammalian target of rapamycin (mTOR) signaling cascade. PLoS One. 2016;11:e0157251.
- Sarkar A, Ghosh S, Chowdhury S, et al. Targeted delivery of quercetin loaded mesoporous silica nanoparticles to the breast cancer cells. Biochimica Et Biophysica Acta (BBA) - General Subjects. 2016;1860:2065–2075.
- Jenkins KM, Angeles R, Quintos MT, et al. Automated high throughput ADME assays for metabolic stability and cytochrome P450 inhibition profiling of combinatorial libraries. J Pharmaceu Biomed Anal. 2004;34:989–1004.
- Wang Y, Xie G, Liu Q, et al. Pharmacokinetics, tissue distribution, and plasma protein binding study of chicoric acid by HPLC-MS/MS. J Chromatogr B Analyt Technol Biomed Life Sci. 2016;1031:139–145.
- Zhang M, Li Q, Ji W, et al. Three-phase solvent bar microextraction combined with HPLC for extraction and determination of plasma protein binding of bisoprolol. Chromatographia 2011;73:897–903.
- Drewes G, Bantscheff M. Chemical proteomics-methods and protocols. Germany: University of Hertfordshire; 2012.
- Thomas S, Brightman F, Gill H, et al. Simulation modelling of human intestinal absorption using Caco-2 permeability and kinetic solubility data for early drug discovery. J Pharm Sci. 2008;97:4557–4574.
- Hummers WS, Offeman RE. Preparation of graphitic oxide. J Am Chem Soc. 1958;80:1339.
- Wang J, Chen Z, Chen B. Adsorption of polycyclic aromatic hydrocarbons by graphene and graphene oxide nanosheets. Environ Sci Technol. 2014;48:4817–4825.
- Liu HP, Shi XF, Zhang YC, et al. Quantitative analysis of quercetin in Euphorbia helioscopia L by RP-HPLC. Cell Biochem Biophys. 2011;61:59–64.
- Xia HJ, Zhang ZH, Jin X, et al. A novel drug-phospholipid complex enriched with micelles: preparation and evaluation in vitro and in vivo. Int J Nanomedicine. 2013;8:545.
- Geng H, Dai J, Li J, et al. Antibacterial ability and hemocompatibility of graphene functionalized germanium. Sci Rep. 2016;6:37474.
- Li Z, Chee PL, Owh C, et al. Safe and efficient membrane permeabilizing polymers based on PLLA for antibacterial applications. RSC Adv. 2016;6:28947–28955.
- Zhang L, Xia J, Zhao Q, et al. Functional graphene oxide as a nanocarrier for controlled loading and targeted delivery of mixed anticancer drugs. Small. 2010;6:537–544.
- Li Y, Liu Y, Fu Y, et al. The triggering of apoptosis in macrophages by pristine graphene through the MAPK and TGF-beta signaling pathways. Biomaterials. 2012;33:402–411.
- Lewis Phillips GD, Li G, Dugger DL, et al. Targeting HER2-positive breast cancer with trastuzumab-DM1, an antibody-cytotoxic drug conjugate. Cancer Res. 2008;68:9280–9290.
- Garcia-Echeverria C, Pearson M, Marti A, et al. In vivo antitumor activity of NVP-AEW541-A novel, potent, and selective inhibitor of the IGF-IR kinase. Cancer Cell. 2004;5:231–239.
- Yazid SN, Isa IM, Hashim N. Novel alkaline-reduced cuprous oxide/graphene nanocomposites for non-enzymatic amperometric glucose sensor application. Materials Sci Eng C, Mater Biol Appl. 2016;68:465–473.
- He H, Klinowski J, Forster M, et al. A new structural model for graphite oxide. Chem Phys Lett.1998;287:53–56.
- Kazemi SH, Ghodsi E, Abdollahi S, et al. Porous graphene oxide nanostructure as an excellent scaffold for label-free electrochemical biosensor: detection of cardiac troponin I. Mater Sci Eng C, Mater Biol Appl. 2016;69:447–452.
- Wang Q, Zhu N, Liu E, et al. Fabrication of visible-light active Fe2O3-GQDs/NF-TiO2 composite film with highly enhanced photoelectrocatalytic performance. Appl Catal B: Environ. 2017;205:347–356.
- Wang Z, Zhao C, Han T, et al. High-performance reduced graphene oxide-based room-temperature NO2 sensors: a combined surface modification of SnO2 nanoparticles and nitrogen doping approach. Sensors Actuat B: Chemical. 2017;242:269–279.
- Song E, Han W, Li C, et al. Hyaluronic acid-decorated graphene oxide nanohybrids as nanocarriers for targeted and pH-responsive anticancer drug delivery. ACS Appl Mater Interfaces. 2014;6:11882–11890.
- Liao KH, Lin YS, Macosko CW, et al. Cytotoxicity of graphene oxide and graphene in human erythrocytes and skin fibroblasts. ACS Appl Mater Interfaces. 2011;3:2607–2615.
- Tan BJ, Liu Y, Chang KL, Lim BK, Chiu GN. Perorally active nanomicellar formulation of quercetin in the treatment of lung cancer. Int J Nanomed. 2012;7:651–661.
- Vargas AJ, Sittadjody S, Thangasamy T, et al. Exploiting tyrosinase expression and activity in melanocytic tumors: quercetin and the central role of p53. Integr Cancer Ther. 2011;10:328–340.
- Phromnoi K, Yodkeeree S, Anuchapreeda S, et al. Inhibition of MMP-3 activity and invasion of the MDA-MB-231 human invasive breast carcinoma cell line by bioflavonoids. Acta Pharmacol Sin. 2009;30:1169–1176.
- Conklin CMJ, Bechberger JF, MacFabe D, et al. Genistein and quercetin increase connexin43 and suppress growth of breast cancer cells. Carcinogenesis. 2007;28:93–100.
- Hu W, Peng C, Luo W, et al. Graphene-based antibacterial paper. ACS Nano. 2010;4:4317–4323.
- Sanchez VC, Jachak A, Hurt RH, et al. Biological interactions of graphene-family nanomaterials: an interdisciplinary review. Chem Res Toxicol. 2012;25:15–34.