
 ?Mathematical formulae have been encoded as MathML and are displayed in this HTML version using MathJax in order to improve their display. Uncheck the box to turn MathJax off. This feature requires Javascript. Click on a formula to zoom.
Abstract
Fighting of current antibiotics against multidrug-resistant (MDR) bacteria has not been completely successful. In this study, the bio-synthesized Ag–TiO2, TiO2–Ag, Ag–Cu and Cu–Ag nanocomposites (NCs) were used against MDR bacteria including Escherichia coli ATCC 25922, Pseudomonas aeruginosa ATCC 27853 (gram negative) and Staphylococcus aureus ATCC 43300 (gram positive). Antiplanktonic, antibiofilm, antiswarming motility and antiquorum sensing activities of these four NCs were measured by assays of agar well diffusion, minimum inhibition/minimum bactericidal concentrations (MIC/MBC), biofilm formation, biofilm morphology and pyocyanin amounts. Agar well diffusion method illustrated higher inhibition zone diameter (IZD) of Ag-TiO2 NCs with 13 ± 1, 16 ± 1.73 and 21.66 ± 1.52 mm against E. coli ATCC 25922, S. aureus ATCC 43300 and P. aeruginosa ATCC 27853 respectively. Swarming motility of P. aeruginosa at presence of NCs demonstrated lower density than control samples. Ordering of antibiofilm strength for these NCs was Ag–TiO2 > TiO2–Ag > Cu–Ag > Ag–Cu. In addition, biofilm roughness and also pyocyanin synthesis as virulence factor related to quorum sensing mechanisms of P. aeruginosa ATCC 27853 was decreased under Ag–TiO2 NCs. In total, the present investigation illustrated eco-friendly and one-pot way to synthesize metal NCs with having significant antibacterial, antibiofilm and antiquorum sensing abilities.
Introduction
Microbial infections are augmenting by emerging multi drug resistant (MDR) microbes in bacteria, fungi, viruses and parasites groups. Among these microorganisms, bacteria can block antibiotic agents by using several strategies including R plasmids, integrons, transposons, multidrug efflux pumps and type IV secretion system. In fact, some strains such as Staphylococcus aureus (MRSA; methicillin-resistant Staphylococcus aureus) have resistant to specific antibacterial agents [Citation1]. Although, synthesis of new antibiotics are increasing but this performance has been slightly successful. In recent years, nanotechnology applications have been one alternative to overcome this problem. In this way, synthesis of organic and inorganic nanoparticles (NPs) has opened innovative insight in treatment of many diseases containing cancers and infectious diseases [Citation2]. Antibacterial effects of metal NPs (MNPs) including Ag, Cu, TiO2, Au, ZnO, Fe3O4 and MgO were proved by many investigators [Citation3,Citation4].
Other problem related to bacterial infections is biofilm formation by microorganisms from planktonic form which increases bacterial resistance to harsh conditions such as starvation and desiccation [Citation5]. Bacteria in biofilms can be protected from antibiotic treatments by producing extracellular matrix containing of polysaccharides, proteins, pili, flagella, extracellular DNA and other macromolecules with hydrophilic properties. In addition, quorum sensing (QS) mechanisms make antibacterial therapy more complicated. These systems contribute in both pathogenicity and biofilm formation simultaneously. One of the virulence factor resulted from QS mechanisms is pyocyanin as secondary metabolite which can be produced by opportunistic pathogen of Pseudomonas aeruginosa [Citation6]. In this instance, many chemical compounds have been screened for finding of the suitable antibiofilm and anti-QS agents. Among them, noble metal ions specifically silver ions and NPs have antibacterial, antibiofilm and anti-QS activities. MNPs have unique properties compared to bulk materials, which can penetrate and damage biofilm by release of ions [Citation7]. Also, bimetallic NPs including NCs have been obtained more attention than single metallic NPs due to various applications in electronic, optic, catalysts, biomedicine and other industrial fields. These applications can be resulted from multiple advantages such as enhanced surface plasmon resonance (SPR) of their core and shell parts. In association with biomedical applications, NCs have been used specifically as antimicrobial, drug delivery, bio-imaging and biosensors agents. In the case of antimicrobial activities of core-shell NPs, several studies have been reported that Ag@TiO2 NPs have antibacterial effects on E. coli (gram negative) and S. aureus (gram positive) bacteria [Citation8]. Also, antibacterial activity as minimum inhibition concentration (MIC) of Ag/Cu alloys against E scherichia. coli and S. aureus illustrated excellent antibacterial results at concentrations as low as 0.3 mg/L [Citation9].
There are several published review papers related to Ag–Cu and Ag–TiO2 NCs synthesis by top-down (size reduction of bulk materials mechanically) and bottom-up (building up NPs via assembly of atoms or molecules) approaches [Citation10–12]. The bottom-up approach such as chemical reduction and green syntheses were used abundantly than up-down methods. Various shapes and sizes of NPs can be prepared through chemical reduction and green synthesis. Comparatively, green synthesis methods have several advantages than chemical reduction way. In these methods, biological materials from plants, bacteria, and fungi organisms with biocompatibility and eco-friendly properties than expensive precursor substances in chemical approach can be used [Citation13,Citation14]. Therefore, in present study, we applied flower aqueous extract of Artemisia haussknechtii plant species as green synthesis one-pot method for preparing of Ag–Cu, Cu–Ag, Ag–TiO2 and TiO2–Ag NCs.
The objective of this study was green synthesis of NCs with antibacterial activities against MDR bacteria: E. coli ATCC 25922, P. aeruginosa ATCC 27853 and S. aureus ATCC 43300. UV–visible spectroscopy, transform infrared spectroscopy (FT-IR) analysis, energy dispersive X-ray spectroscopy (EDX), field emission scanning electron microscope (FESEM), transmission electron microscope (TEM), zeta potential analysis, X-ray diffraction (XRD) were used for NCs characterization. In the case of antibacterial assay, disc diffusion, minimum inhibitory concentration (MIC), minimum bactericidal concentration (MBC), bacterial growth and biofilm formation analysis of three MDR bacteria were measured.
Materials and methods
Preparation of plant flower extract and metal salts
Flower aqueous extract of A. haussknechtii was used for green synthesis of NCs. Firstly, the flowers’ surface were cleaned with running tap water, followed by distilled water and air dried on a paper towel for 6 days. Dried flowers (10 g) were ground in a tissue grinder to obtain fine powder, and added to 100 ml of double distilled water followed by stirring for 1 h at 55 °C temperature. Mixture was filtered with Whatman No. 40 filter paper. The filtered suspension was collected and stored at 4 °C until next usage. This resulted extract was utilized as both reducing as well as stabilization/capping agents. For preparation of metal salts of Ag, Cu, and TiO2; 0.1 M concentration of AgNO3, CuSO4 and TiO(OH)2 aqueous solutions (100 ml) were stirred for 2 h at 25 °C. Afterwards, these solutions were kept at 4 °C for next stages.
Ag–TiO2 and Ag–Cu NCs synthesis
In order to carry out Ag–TiO2 and Ag–Cu NCs green synthesis, plant flower extract (1 ml) was added to AgNO3 solution (9 ml) under stirring for 5 h at 60 °C. Then, 9 ml of TiO(OH)2 and CuSO4 solutions were added separately to the previous mixtures, within 5 min, 1 ml plant extract was added to each solutions. The resulted mixtures were stirred for 1 h at 60 °C and due to purity of NCs, solutions were centrifuged at 4000 rpm for 30 min at 25 °C. In order to UV–Vis spectroscopy analysis; the supernatants of each solutions were transferred to the clean dry beakers and stored at 4 °C in the dark.
TiO2–Ag and Cu–Ag NCs synthesis
Green synthesis of Ag–Cu NCs was carried out first by the addition of flower aqueous extract (1 ml) to TiO(OH)2 and CuSO4 solutions (9 ml) under stirring for 5 h at 60 °C, followed by the addition of 9 ml AgNO3 solution to the prepared mixtures. Then, similar to previous synthesis, within 5 min, 1 ml of plant extract was added separately to the solutions. After 1 h stirring of mixtures at 60 °C, centrifugation was carried out at 4000 rpm for 30 min. Finally, the supernatants were transferred to beakers followed by storing at 4 °C and in the dark condition due to UV–Vis spectroscopy analysis [Citation15].
NCs physicochemical characterization
The prepared annealed samples were analyzed by UV–Vis spectroscopy, XRD, FT-IR, FE-SEM, and TEM techniques for the determination of structure, morphology and elemental composition. Zeta potential analyzer (Zetasizer nano ZS, Malvern Instruments Ltd., UK) at 25 °C with 90° detection angle was utilized to measure electrokinetic potential of NCs in colloidal dispersions. XRD was applied by EQUNIOX 3000, diffractometer in the scanning range of 20°–70°, 10°–80° and 10°–70°(2θ) using Cu-Kα radiations of wavelength 1.5406 Å for identification of the crystal phases and determination of the average crystal size of Ag, Cu and TiO2 NPs respectively. FE-SEM (Model: XL30, Philips, Eindhoven) was used to study the morphology of the NPs and the elemental compositions. The intensity of absorption peaks and peak absorbance of NCs was examined by UV–Vis spectrophotometer (Model: Tomas, UV 331) from 300 to 800 nm. FT-IR measurements were done by spectrophotometer (Model: ALPHA, Bruker, Germany).
Microorganisms
Reprehensive multidrug-resistant bacteria of gram negative (E. coli ATCC 25922 and P. aeruginosa ATCC 27853) and gram positive (S. aureus ATCC 43300) were used to determine the antimicrobial effects of Ag–TiO2, TiO2–Ag, Ag–Cu and Cu–Ag NCs. These strains were gained from bacterial archive of microbiology laboratory, Razi University of Kermanshah. In order to following evaluation, bacterial strains were maintained on nutrient agar slants at 4 °C.
Agar well diffusion assay
Actively growing broth cultures (approximately cell density of 1.5 × 10⁸ CFU/mL: standardized by 0.5 McFarland standard) of E. coli ATCC 25922 and P. aeruginosa ATCC 27853 and S. aureus ATCC 43300 were prepared in Luria broth followed by incubation at 37 °C for 24 h. The MDR pathogen bacteria were swabbed on Luria agar plate. Wells were made with sterile micropipettes tip on the surface of the agar plates. MIC concentrations of Ag–TiO2, TiO2–Ag, Ag–Cu and Cu–Ag NCs were pipetted in each well and antimicrobial activity as zone diameter of inhibition was determined after 48 h of incubation at 37 °C [Citation16].
Evaluation of minimum inhibitory/bactericidal concentration (MIC/MBC)
Ag–TiO2, TiO2–Ag, Ag–Cu and Cu–Ag NCs were analyzed in the case of antibacterial activities by the minimum inhibitory/bactericidal concentration (MIC/MBC) assays. Volume by 20 μL of bacteria in MHB were added to suspensions of NCs. Concentrations were varied via serial twofold dilution from 100, 50, 25, 12.5, 6.25 and 3.12 μg/mL. The samples were monitored for turbidity as growth and non-turbidity as no growth followed by incubation of medium for 24 h at 37 °C. The MIC values were presented as the lowest concentrations of the sample which illustrated clear fluid with no sign of turbidity. For testing, 10 μL of the samples from each tube without growth of bacteria were sub cultured onto a MHA. The minimum bactericidal concentration (MBC) was indicated as the highest dilution of the NCs that did not show a single bacterial colony on the MHA after 24 h incubation period [Citation3].
Swarming mobility of P. aeruginosa
Two concentrations of NCs (3.12 and 6.25 μg/mL) as resulted MIC values were applied to evaluate swarming motility of P. aeruginosa ATCC 27853. Semi-solid agar was prepared by adding 0.8 g of nutrient broth and 3 g of Muller Hinton agar to 100 ml of distilled water. Then, filtered and sterilized d-glucose (10% w/v) was combined with final sample. 5 μL of P. aeruginosa was co-incubated by different concentrations of NCs on center of prepared agar for 48 h at 37 °C [Citation17]. Swarm size and density of plaque were measured in the case of treatments as well as control as free-NCs.
Biofilm formation assay
In order to evaluate biofilm formation under NCs stress, 96-well polystyrene plates were utilized [Citation18]. At first, overnight cultures of bacteria were adjusted to an OD600 of 0.08–0.1 (0.5 McFarland standard) in LB medium and co-cultured by different concentrations (100, 50, 25, 12.5, 6.25, 3.12 and 0 μg/mL) of green synthesized NCs as treatments and without NCs as control for 24 h at 37 °C without shaking. Bacterial growth was indicated by measuring of absorbance at OD600 by Visible Spectroscopy. In order to remove planktonic bacteria, plates were rinsed by water for three times. Biofilms were stained by 100 μL of crystal violet (0.1%, w/v) for 30 min at 25 °C. Then, plates were emptied, washed by water, blotted onto tissue paper towels. Dried crystal violet was extracted with ethanol (95%, v/v), and total biofilm formation was then assayed at OD570. Analyses were performed as three replicate tests independently. Also, results were presented as the averages with standard deviations (average ± SD) of three replicate cultures. The meaningful inhibition of biofilm was determined by Student’s t-test (p ≤ .05).
AFM and SEM analyses of biofilm morphology
Effect of four NCs on roughness and morphology properties of biofilm formation by P. aeruginosa strain was evaluated via AFM technique. Moreover, in order to prove results of this technique, changes of biofilm morphology under stress of selected NCs (Ag–TiO2) were surveyed by SEM analysis. In this way, 3% glutaraldehyde in phosphate buffer serum (PBS) was used for 5 h due to fixation of P. aeruginosa biofilms on the slides. Before storage of samples in desiccators, biofilms were dehydrated through an ethanol gradient (25%, 50%, 70%, 90% and 99%). AFM images were prepared with a resolution of 2 × 2 μm under non-contact mode (dynamic force) by Nanosurf Mobile S instrument, Switzerland. In the case of SEM analysis, prior to observation, the slides were coated with gold at a voltage of 30 mV for 100 s. A Phenom ProX scanning electron microscope (SEM) with 15 kV beam voltage was applied to observe the morphology of the biofilms as control (without NCs effect) and treatment with MIC of Ag–TiO2 NCs (3.12 μg/mL). The magnifications of ×500, ×1000 and ×2000 were applied for imaging. Twenty-four hours of incubation period was determined for both AFM and SEM analyses.
Pyocyanin measurement
Pyocyanin as secondary metabolites of quorum sensing mechanisms of P. aeruginosa under Ag–TiO2 NCs was determined by culture supernatant method with some modifications [Citation19]. Bacterial cells removal and extraction of pyocyanin were carried out respectively by centrifugation at 5000 rpm/min and mixing 5 ml supernatant with 3 ml of chloroform. Afterwards, 1 ml of acidified water (0.2 mol/l HCl) was utilized for re-extraction of pyocyanin followed by absorbance indication of supernatant at 520 nm. Optical densities (ODs) were multiplied by 17.072 in order to obtain concentration of pyocyanin as μg/mL.
Total antioxidant capacity (TAC) and DPPH free radical scavenging assays
Total antioxidant capacity (TAC) of the green synthesized NCs and flower aqueous extract were carried out spectrophotometrically at OD695 nm by phosphomolybdenum assay [Citation3]. All steps were performed based on previous study and ascorbic acid was utilized for comparison assay.
Also, the 1,1-diphenyl-2-picryl-hydrazyl (DPPH) assay was applied to measure the antioxidant ability of the flower extract and NCs at OD517nm. Process of assay was similar to previous study and the ability of the samples to scavenge DPPH free radical was assessed by below formula:
Statistical analysis
SPSS version16 software (SPSS Inc., Chicago, IL) and one way ANOVA (Tukey’s test) were applied respectively to carry out statistical analysis and evaluating of results. All experiments were presented in triplicates and averages plus standard errors were assessed as p ≤ .05 of significant value.
Results and discussions
UV–Vis spectroscopy analysis
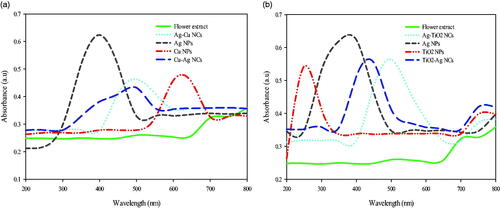
In order to evaluate UV–Vis spectra analysis based on surface plasmon resonance (SPR), absorbance peaks of Ag–TiO2, TiO2–Ag, Ag–Cu and Cu–Ag NCs were compared to plant flower extract, Ag, TiO2 and Cu NPs. For this purpose, in each step of bimetallic biosynthesis (from preparation of flower aqueous extract to NCs formation), absorbance peaks were determined. As illustrated in , there are obvious differences between NCs with flower extract and each MNPs alone. Results showed peaks at 382 and 397 nm for Ag NPs and also peaks at 253 and 619 nm for TiO2 and Cu NPs respectively. Ag–TiO2 and TiO2–Ag NCs were respectively shifted to 496 and 440 nm. Also, shift of peaks was observed for Ag–Cu (493 nm) and Cu–Ag (496 nm) NCs. However, there were no clear peaks in the case of flower extract. It is obvious that shell of each NCs indicates absorbance peak. Similar study showed red shift from 407 nm (related to Ag NPs) to 454 nm (related to TiO2 NPs) by increasing of TiO2 in shell part of Ag–TiO2 [Citation20]. Also, Au–TiO2 compared to Au NPs had red shift from 521 nm to 565 nm indicating the presence of TiO2 as shell part [Citation21]. Ag–Cu bimetallic NPs illustrated absorption peak at 415–440 nm than to Cu NPs by peak at 560 nm which was approximately similar to our result (Ag–Cu with absorption at 493 nm than to Cu NPs with 619 nm absorption peak) [Citation22].
Figure 1. UV–Vis spectra of Ag, Cu and TiO2 NPs; Ag–TiO2, TiO2–Ag, Ag–Cu, and Cu–Ag NCs prepared by flower aqueous extract of A. haussknechtii.
XRD analysis
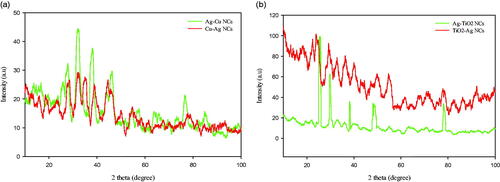
As shown in , XRD analysis was performed for crystalline structure and particle size indication of Ag–Cu, Cu–Ag, Ag–TiO2 and TiO2 NCs. Peaks at 2θ values of 27° (Ag–Cu), 28° (Cu–Ag), 32°, 38°, 46°, 49°, 63°, 73°, and 76° corresponding to Bragg’s planes Cu(101), Cu(002), Ag(111), Cu(111), Cu(200), Ag(220), Ag(220), and Ag(311) were related to cubic crystal shape of Ag–Cu and Cu–Ag NCs [Citation23]. Cu part of Ag–Cu nanostructure had more peak values indicating Ag NPs coating by Cu atoms. Also, there are a few unmarked peaks in the vicinity of this characteristic peaks. These peaks may be caused by the existing of stabilizers as capping agent on the surface of NPs [Citation24]. As illustrated in , the diffracted intensity for Ag–TiO2 and TiO2–Ag NCs was recorded at 10–80°. Four prominent peaks were observed in these samples at 24° (TiO2–Ag), - 30° (Ag–TiO2), 38°, 49°, and 78° corresponding to planes of TiO2(101), Ag(111) and TiO2(004), TiO2(200), and Ag(311) which can be indexed according to the cubic crystal structure of Ag and anatase form of TiO2 NPs [Citation25]. The crystal sizes of synthesized Ag–Cu, Cu–Ag, Ag–TiO2 and TiO2-Ag NCs were estimated respectively to be in the range of 67, 64, 72 and 70 nm and via Debye–Scherer EquationEquation (1)(1)
(1) :
(1)
(1)
where k, known as Scherer’s constant, ranges from 0.9 to 1.0, λ is 1.5418 Å, which is the wavelength of the X-Ray radiation source, β1/2 is the full width of the XRD peak at half height and θ is the Bragg angle (.
Figure 2. XRD analysis of green synthesized Ag–Cu and Cu–Ag (a); Ag–TiO2 and TiO2–Ag (b) NCs.
FT-IR spectroscopy analysis
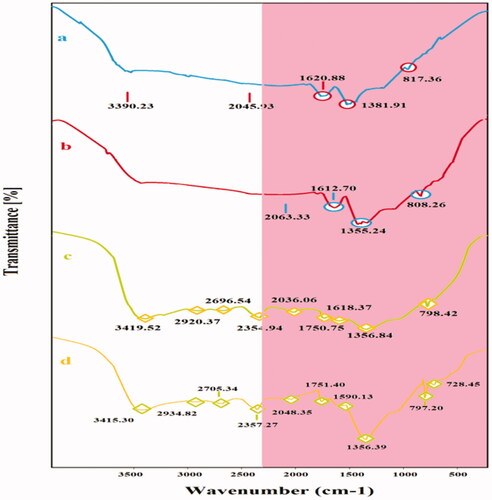
Secondary metabolites of A. haussknechtii flower including flavonoids can contribute in two-step biosynthesis of NCs [Citation26]. First step is synthesis of core and second step is shell synthesis around core part. FT-IR analysis was used in order to indicate the last layer of secondary metabolites around NCs (). For Ag–Cu NCs, IR peaks at 817.36, 1381.91 and 1620.88 cm−1 represent respectively =C–H (alkene), –C–H (alkane) and C=C (alkene) functional groups. Similar to Ag–Cu NCs, there were functional groups of =C–H (alkene), –C–H (alkane) and C=C (alkene) which indicates role of similar secondary metabolites in biosynthesis of two NCs. Ag–TiO2 NCs illustrated several peaks at 798.42, 1356.84, 1618.37, 1750.75, 2696.54 and 3419.52 cm−1 indicating of =C–H (alkene), –C–H (alkane), C=C (alkene), C=O (carbonyl), O–H (acid), and N–H (amide) which were approximately similar to TiO2–Ag NCs. These functional groups can prove contribution of secondary metabolite and also proteins with amide groups in NPs green synthesis [Citation27].
Figure 3. FT-IR spectra of Ag–Cu (a); Cu–Ag (b); Ag–TiO2 (c) and TiO2–Ag NCs (d) with their main peaks.
FESEM analysis
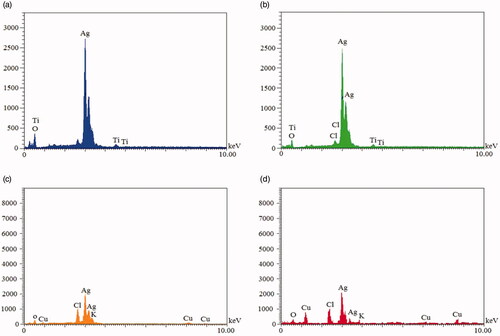
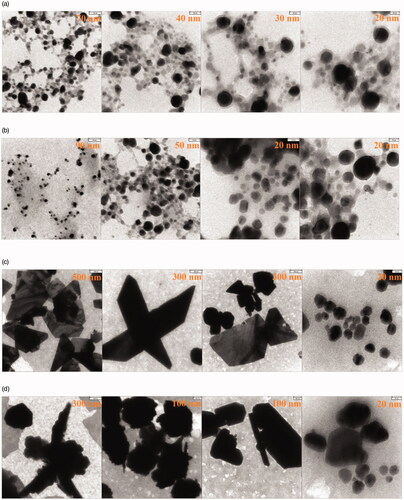
Shape and morphology properties of NCs were surveyed by SEM. In this instance, there were different structures based on type of constitutes of NCs (). Ag–TiO2 NCs showed spherical (, worm like (), and aggregated structures (). Spherical () and berries like () shapes were observed in the case of TiO2–Ag NCs. Needle with spherical shapes was observed for Ag–Cu NCs (). Also, Cu–Ag CNs illustrated semi-spherical morphology (). He and his coworkers showed arrays of tilted nanorods under SEM technique in the case of Ag–TiO2 NCs [Citation28]. Energy dispersive X-ray (EDX) analysis for four NCs is presented in . Elemental traits for each NCs were determined by this analysis. In all NCs, amount of silver element was higher than other elements. This value was higher for Ag–TiO2 and TiO2–Ag NCs than Ag–Cu and Cu–Ag NCs which can be resulted from more combinatorial affinity of Ag and Ti elements. Cl and O elements were common for four NCs, but potassium (K) atom was observed in the case of Ag–Cu and Cu–Ag NCs. These results may show higher affinity of Ag and Cu atoms to combine with K (. Weaker signal of Cl and O elements was indicated in green synthesis of Ag NPs by leaf extract of Pteris tripartite. In previous study, atoms of S, O, Si and Cl were with TiO2, Cu, and Ag NPs [Citation3].
Figure 4. SEM images of Ag–TiO2 (a, b, c, d); TiO2–Ag (e, f, g, h); Ag–Cu (i, j, k, l) and Cu–Ag (m, n, o, p) NCs.
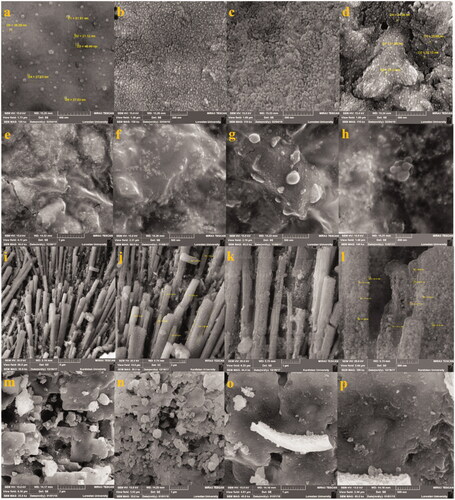
Figure 5. EDX analysis of Ag–TiO2 (a); TiO2–Ag (b); Ag–Cu (c) and Cu–Ag (d) NCs.
TEM images and zeta potential of NCs
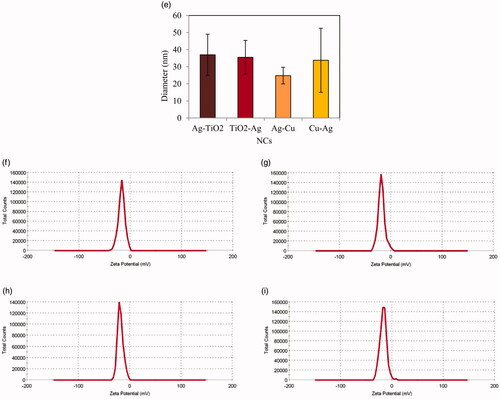
Images of TEM showed spherical, cubic, berries like, and needle shape with average diameter size of 36.99 ± 12.03, 35.55 ± 9.88, 24.82 ± 4.85 and 33.79 ± 18.73 nm respectively for Ag–TiO2, TiO2–Ag, Ag–Cu and Cu–Ag NCs (). Shapes of NCs in colloidal suspension were approximately similar with their powders which were resulted from SEM images. The electric potentials in the slipping plane of NCs were measured as zeta potentials. As shown in , this parameter had –17 ± 6.45, –18.2 ± 6.52, –18.3 ± 5.59, and –16.9 ± 6.62 mV for Ag–TiO2, TiO2–Ag, Ag–Cu and Cu–Ag NCs respectively. These results demonstrate good stability of these nanostructures in colloidal medium.
Figure 6. TEM images of Ag–TiO2 (a); TiO2–Ag (b); Ag–Cu (c) and Cu–Ag (d) NCs with average diameter size (e). zeta potentials are presented for Ag–TiO2 (f); TiO2–Ag (g); Ag–Cu (h) and Cu–Ag (i) NCs.
Agar well diffusion assay
Antibacterial effects of four NCs were measured by agar well diffusion assay (). As shown in this Figure, P. aeruginosa had less resistance than E. coli and S. aureus species. In the case of P. aeruginosa, inhibition zone diameters (IZDs) for Ag–TiO2, TiO2–Ag, Ag–Cu, and Cu–Ag were respectively 21.66 ± 1.52, 21 ± 1, 15.33 ± 0.57 and 19 ± 1 mm (). As it is obvious from these results, ordering of antibacterial activity of these NPs was Ag–TiO2 > TiO2–Ag > Cu–Ag > Ag–Cu. In comparison, E. coli had more resistance than S. aureus. For E. coli, IZD values of 12.5 ± 1.32 (Ag–TiO2), 12.66 ± 1.52 (TiO2–Ag), 12.33 ± 0.57 (Ag–Cu) and 12 ± 1 (Cu–Ag) was observed. In addition, S. aureus showed 16 ± 1.73, 15.66 ± 1.54, 15 ± 1.73, and 15.33 ± 0.57 mm of IZDs for respectively Ag–TiO2, TiO2–Ag, Ag–Cu and Cu–Ag. Therefore, from this test it can be concluded that the sensitivity level for these types of NCs was P. aeruginosa > S.aereus > E. coli.
Figure 7. Agar well diffusion assay of Ag–TiO2 (a); TiO2–Ag (b); Ag–Cu (c) and Cu–Ag NCs (d) on three MDR bacterial species: E. coli, S. aureus and P. aeruginosa.
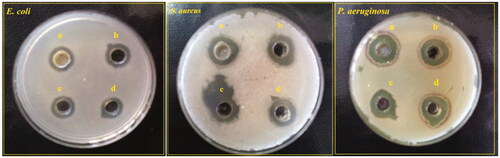
Table 1. Antibacterial activity of Ag–TiO2, TiO2–Ag, Ag–Cu and Cu–Ag NCs as values of obtained IZD by agar well diffusion assay.
Biosynthesized Ag NPs via Streptacidiphilus durhamensis strain had antibacterial activity against E. coli ATCC 8739, S. aureus ATCC 6338, and P. aeruginosa ATCC 10145 as IZDs values of 6 ± 0.86, 10 ± 1 and 10 ± 0.86 mm [Citation29]. Ag/TiO2 NCs powders illustrated 98.8% and 100% bacterial growth inhibition respectively at 1.2 μg/mL and 2.4 μg/mL concentrations of Ag NPs part [Citation30]. IZDs of Ag@TiO2 core-shell NPs biosynthesized with surfactant of sodium alginate against S. aureus were 28, 29 and 27 mm [Citation8]. Moreover, 12.1 ± 0.39 and 14.9 ± 0.65 of viability percentages were observed respectively for E. coli and S. aureus under stress of ZnO/CuO (10%) metal NCs [Citation31].
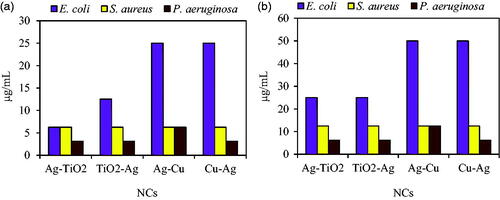
Evaluation of minimum inhibitory/bactericidal concentration (MIC/MBC)
MIC and MBC results showed similar antibacterial activity with agar diffusion assay. As demonstrated in , Ag–TiO2 and TiO2–Ag NCs had higher bacteriostatic and bactericidal effects than Ag–Cu and Cu–Ag NPs against E. coli. MIC values for Ag–TiO2, TiO2–Ag, Ag–Cu, and Cu–Ag NCs against E. coli were 6.25, 12.5, 25 and 25 μg/mL. Also, in the case of MBC, Ag–TiO2, TiO2–Ag, Ag–Cu, and Cu–Ag illustrated concentrations by 25, 25, 50 and 50 μg/mL respectively. Higher sensitivity to NCs was observed for P. aeruginosa. Also, bacteriostatic and bactericidal strength of NCs against S. aureus was more than E. coli. Ag/TiO2-impregnated bamboo charcoal (AgTBC) composite with different electro-deposition (10, 30 and 60 min) demonstrated respectively >16, 16, and 2 mg/mL values of MBC against E. coli which these values were less for S. aureus by 8, 2 and 1 mg/mL [Citation32]. Prepared Ag/TiO2 NCs by different concentrations of AgNO3 (0, 0.2, 1, 5 and 10 wt%) had respectively minimum bactericidal values of >3200, 300, 60, 30, and 20 mg/mL for E. coli ATCC 25922 as well as >4800, 2400, 320, 120 and 80 mg/mL for S. aureus ATCC 6538 [Citation33].
Figure 8. MIC (a) and MBC (b) of four NCs against E. coli ATCC 25922, S. aureus ATCC 43300 and P. aeruginosa ATCC 27853.
In fact, there is no clear description about toxicity mechanisms of NPs against bacteria. In this way, unique properties of NPs such as high surface area to volume ratio and also type of bacterial species (gram positive and gram negative) are important factors [Citation34]. Electrostatic interaction of NPs with membrane is first effect of NPs to attach to bacterial surface which resulted in the membrane disruption of gram negative bacteria specifically. Other toxicity mechanism of NPs is production of reactive oxygen species (ROS) including superoxide radical (O2•), hydroxyl radical (HO•) and singlet oxygen (1O2) [Citation35].
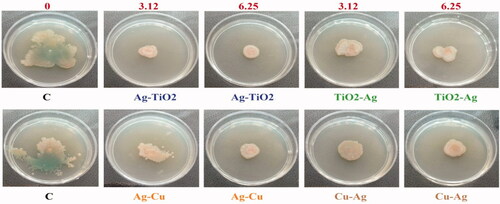
Swarming mobility
One of the important aspects of bacterial dynamic on solid surface is swarming mobility which is caused by rotating movement of flagella. MIC concentrations (3.12 and 6.25 μg/mL) of four NCs were used to survey motiliy function of P. aeruginosa pathogen (). Prominent swaming form in this assay was bull’s eye as swarming by cyclic and regular waves [Citation36]. As observable in , there was reduction in swarming motility in two contentrations with substantially at 6.25 μg/mL amount. This result was concorrent with disappear of blue-green pyocyanin pigment in treatments compared to control samples which was approved by pyocyanin reduction assay in this study (). Inhibition of quorum sensing-mediated swarming motility via rhamnolipid genes suppression in P. aeruginosa was indicated by mycosynthesized silver NPs at 25 μg/mL concentration [Citation37].
Figure 9. Reduction of swarming mobility in P. aeruginosa ATCC 27853 under two concentrations (3.12 and 6.25 μg/mL) of four NCs compared to control samples.
Biofilm formation assay
Biofilm formation of three bacteria E. coli ATCC 25922, P. aeruginosa ATCC 27853, and S. aureus ATCC 43300 under stress of different concentrations (0, 3.12, 6.25, 12.5, 25, 50 and 100 μg/mL) of NCs was determined by crystal violet assay. Higher antibiofilm effect was observed at higher concentrations (100 μg/mL) of all NCs. As obvious from , Ag–TO2 NCs had higher antibiofilm activity than other NCs on three MDR bacteria. Biofilm of E. coli, S. aureus and P. aeruginosa showed sensitivity to Ag–TiO2 NCs as values of 0.314 ± 0.035, 0.272 ± 0.04 and 0.201 ± 0.048 (p ≤ .05). Also, there was significant difference between control with biofilm formation at 25 and 50 μg/mL for P. aeruginosa. Antibiofilm activity of TiO2–Ag NCs on S. aureus at 100 μg/mL and P. aeruginosa at 50 and 100 μg/mL was meaningful. Cu–Ag NCs had significant amounts at concentrations of 50 and 100 μg/mL for P. aeruginosa and 100 μg/mL for S. aureus. Also, P. aeruginosa showed sensitivity to Ag–Cu NCs only at concentration of 100 μg/mL. In total, ordering of antibiofilm strength for these NCs was Ag–TiO2>TiO2–Ag > Cu–Ag > Ag–Cu.
Figure 10. Effects of different concentrations of (a) Ag–TiO2; (b) TiO2–Ag; (c) Ag–Cu and (d) Cu–Ag NCs on the biofilm formation by E. coli ATCC 25922, S. aureus ATCC 43300 and P. aeruginosa ATCC 27853 after 24 h incubation without shaking at 37 °C. Data are presented as Mean ± SD and (*) sign is p ≤ .05 value versus control samples.
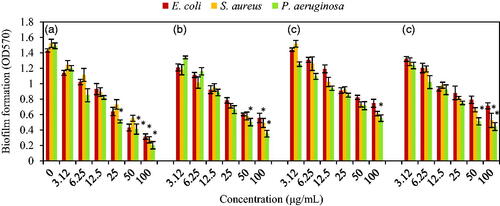
Higher biofilm inhibition of S. epidermidis was observed by 1.5 h incubation of immobilization of silver NPs on titanium as values of 92.6%–94.4% [Citation38]. Sol-gel coated glass slides surface by AgCl–TiO2 NCs as concentrations of 125 μg/cm2, 125 μg/cm2, and 500 μg/cm2 were illustrated respectively, antibiofilm activity against E. coli, S. epidermidis and P. aeruginosa without any bacterial growth after a period of 10 days [Citation39]. Ointment with having 1 wt% of zinc–copper oxide NCs dwindled biofilm biomass of S. aureus, P. aeruginosa, and S. epiderimids as amounts of 84.3%, 90.6 and 89.8% [Citation38]. In this study, biofilm of E. coli, S. aureus, and P. aeruginosa demonstrated higher sensitivity to Ag–TiO2 NCs by 78.05%, 82.15% and 86.52% at value of 100 μg/mL. As shown by other reports, antibiofilm ability of NPs can be resulted from disrupting of biofilm structure and penetration of metal ions into under layers of bacterial colony which is not accessible for common antibiotics [Citation40,Citation41].
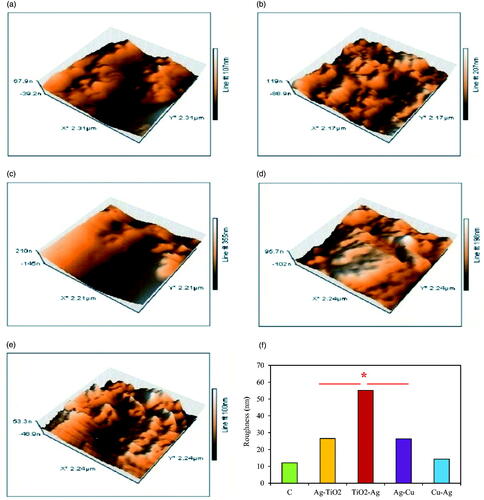
AFM and SEM analysis of biofilm formation
Roughness and morphology of biofilm formation by P. aeruginosa was indicated via AFM analysis as important decisive features of NCs interaction with bacterial membrane. 3D images of AFM showed increasing of roughness or uniformity in treatments than control with highest value in TiO2–Ag and lowest in control sample (). TiO2–Ag > Ag–TiO2>Ag–Cu > Cu–Ag NCs were ordering of roughness amounts in NCs which can be approximately compared to antibacterial results of previous assays (). Hereon, the most reliable conclusion of these results is interaction increment of NCs with cell membrane compared with control. Similarly, treatment of Staphylococcus pseudintermedius by cell wall disturbing antibiotic (fosfomycin) illustrated synchronously cell shape changing with increasing of roughness than control samples [Citation42]. In contrast to this study, biofilm roughness of Acinetobacter baumannii, E. coli, and S. aureus strains decreased than that of control sample, which may be due to the difference in surface type [Citation43] because, in this study, silicon surface was applied to survey biofilm formation instead of glass slide. Interaction of MNPs or NCs with bacterial membrane can be effected from three prominent reasons including electrostatic interaction between MNPs/NCs with negative charge of bacterial membrane resulted from existing of positive ions in outer surface of MNPs/NCs, high reactivity because of large surface area to volume (SA:V) ratio as well as shape type of MNPs/NCs [Citation3]. According to previous results of XRD and SEM in this study, all of these reasons can be effective.
Figure 11. AFM 3-D images of biofilm formation after 24 h of NCs incubation; control (a); Ag–TiO2 (b); TiO2–Ag (c); Ag–Cu (d) and Cu–Ag NCs (e) with changing of roughness values (f). Significant difference is at *p ≤ .05.
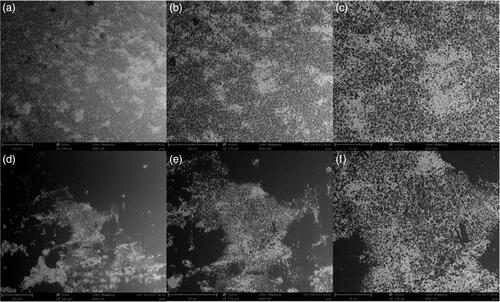
Specifically, ability of P. aeruginosa to biofilm formation in patients with cystic fibrosis is a major obstacle in treatment of this bacterial infection [Citation6]. In this way, morphology perspective of biofilm formation of MDR P. aeruginosa ATCC 27853 was analyzed via SEM technique. Ag–TiO2 NCs was selected as sample of NCs due to their more antibacterial properties than to other NCs. As shown in , reduction of biofilm surface area and density of P. aeruginosa was observed after 24 h of biofilm formation under treatment of Ag–TiO2 NCs. In , comparing of black section to white/black section indicate lack of biofilm formation. In contrast, there is no such condition in .
Figure 12. Changing of typical biofilm morphology of P. aeruginosa as reduction in biofilm surface area and density after 24 h without NCs as control (a, b, c) and under Ag–TiO2 NCs as treatment (d, e, f). Imaging is based on the magnifications of ×500 (a, d), ×1000 (b, e) and ×2000 (c, f).
95% prevention in biofilm formation of P. aeruginosa and S. epidermidis during 24 h treatment by Ag NPs illustrated high antibiofilm aspect of this NP [Citation44]. Inhibition of P. aeruginosa biofilm formation was reported as a dose dependent manner of Ag NPs [Citation45]. Immobilization of Ag NPs on titanium square plates impeded adhesion and proliferation of S. epidemidis from 6 to 24 h during biofilm formation [Citation38]. SEM analysis showed inhibition of biofilm growth over a period of 10 days under treatment of AgCl–TiO2 nanocomposite. Also, antibiofilm activity at 100 μg/mL of green synthesized Au@Ag NPs via Dioscorea bulbifera medicinal plant against Acinetobacter baumannii was observed by SEM analysis [Citation46].
Pyocyanin measurement
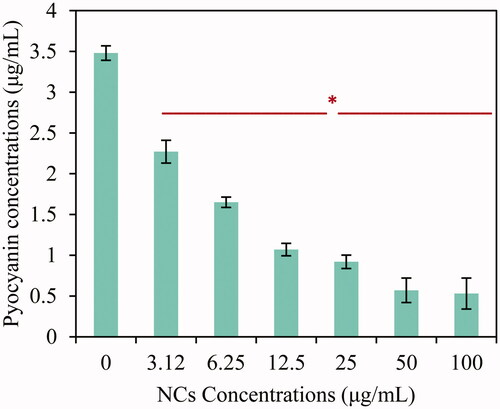
Psuedomonas aeruginosa pathogens synthesize several virulence factors related to QS mechanism such as pyocyanin. In this way, pyocyanin concentration was measured at a presence of various amounts of Ag–TiO2 NCs. This analysis illustrated higher inhibition activity of new biosynthesized Ag–TiO2 NCs on pyocyanin generation by P. aeruginosa ATCC 27853 strain. As demonstrated in , significant difference (p ≤ .05) was observed in all concentrations with exception of 3.12 μg/mL. Reduction percentages for 6.25, 12.5, 25, 50, and 100 μg/mL were respectively 53%, 70%, 74%, 84% and 85% (). Therefore, these results prove anti-biofilm, anti-QS as well as anti-virulent ability of Ag–TiO2 NCs. Previous investigation showed inhibitor effect of ZnO NPs on pyocyanin synthesis via CzcR regulator gene [Citation47]. Also, the pyocyanin signal was significantly suppressed in the presence of 5% phosphate and polyphosphate cross-linked poly(ethylene) glycol hydrogel NPs [Citation48].
Figure 13. Reduction of pyocyanin amount as virulence factor of P. aeruginosa ATCC 27853 under treatment by different concentrations of Ag–TiO2 NCs. (significant difference, ANOVA (Tukey’s test), *p ≤ .05). Data were presented as mean values of three replicates ± error bars of standard deviation.
Total antioxidant capacity (TAC) and DPPH free radical scavenging assays
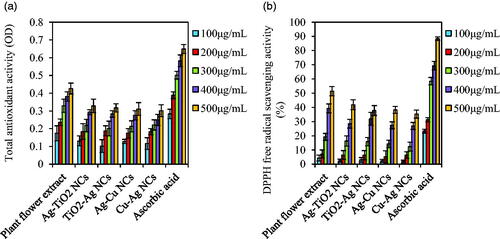
Antioxidant activity of plant flower extract and NCs were compared with ascorbic acid as control by total antioxidant and DPPH free radical scavenging assays. Total antioxidant values of all samples were increased by increasing their concentrations. Ordering of activities was ascorbic acid > plant flower extract > NCs (). Among NCs, Ag–TiO2 had higher total antioxidant activity with 0.328 ± 0.038 value than other NCs (TiO2–Ag: 0.317 ± 0.024, Ag–Cu: 0.311 ± 0.036 and Cu–Ag: 0.301 ± 0.034) at 500 μg/mL concentration. In previous study, green synthesized Ag and Cu NPs via A. haussknechtii leaf extract showed higher TAC than TiO2 NPs [Citation3]. Similar results were observed in the case of DPPH free radical scavenging activity (). These assays demonstrated approximate biosafety of green synthesized NCs which can be further tested by other antioxidant and cytotoxicity methods. Antioxidant activity of NCs can be resulted from stabilizer agents derived flower extract of A. haussknechtii plant species [Citation49]. It is worth noting that TAC assay assesses frequently metal binding proteins and antioxidant enzymes with low molecular weight. Therefore, many compounds with antioxidant activities may not be considered by this method and various assays are needed to evaluate TAC accurately in biological systems [Citation50].
Figure 14. TAC and DPPH free radical scavenging activity of flower extract and four NCs. Ascorbic acid was used as standard solution. Values are means of three independent analyses ± standard deviation (n = 3).
Conclusions
Finding new antibiotic strategy against MDR bacteria involving E. coli ATCC 25922, P. aeruginosa ATCC 27853 (gram negative), and S. aureus ATCC 43300 (gram positive) are problematic issue in bacterial infections therapy. This study illustrated significant antiplanktonic, antiquorum sensing, antibiofilm activities, and antioxidant activities of biosynthesized Ag–TiO2, TiO2–Ag, Ag–Cu and Cu-Ag NCs against MDR bacteria. Roles of secondary metabolites of A. haussknechtii flower extract as reducing and stabilizing agents are important, specifically in antioxidant activities of NCs which are negligible in chemical and physical synthesis of NCs. Moreover, secondary metabolites had effect on size and shapes of NCs which resulted in different antibacterial activities. In the case of biofilm roughness, NCs increased roughness by interaction with cell membrane of P. aeruginosa. Also, antiquorum sensing property of NCs was indicated indirectly by measurement of pyocyanin concentrations in samples. It can be concluded that reduction of pyocyanin in treatments as one of the virulence factors (with cytotoxicity via oxidative effect) of P. aeruginosa, an opportunistic pathogen is another efficient aspect of these NCs. As a suggestion, other assays of cytotoxicity in biological conditions such as in vivo methods can help in the determination of biocompatibility traits in green synthesized NCs.
Acknowledgements
The authors wish to appreciate graduate school plant physiology and microbiology laboratory of Razi University for providing necessary facilities to carry out this work.
Disclosure statement
No potential conflict of interest was reported by the authors.
Related Research Data
References
- Parmar KM, Hathi ZJ, Dafale NA. Control of multidrug-resistant gene flow in the environment through bacteriophage intervention. Appl Biochem Biotechnol. 2017;181:1007–1029.
- Alavi M, Karimi N, Safaei M. Application of various types of liposomes in drug delivery systems. Adv Pharm Bull. 2017;7:3.
- Alavi M, Karimi N. Characterization, antibacterial, total antioxidant, scavenging, reducing power and ion chelating activities of green synthesized silver, copper and titanium dioxide nanoparticles using Artemisia haussknechtii leaf extract. Artif Cell Nanomed B. 2017;1–16.
- Vijayan R, Joseph S, Mathew B. Indigofera tinctoria leaf extract mediated green synthesis of silver and gold nanoparticles and assessment of their anticancer, antimicrobial, antioxidant and catalytic properties. Artif Cell Nanomed B. 2018;46:861–871.
- de la Fuente-Núñez C, Reffuveille F, Fernández L, et al. Bacterial biofilm development as a multicellular adaptation: antibiotic resistance and new therapeutic strategies. Curr Opin Microbiol. 2013;16:580–589.
- Kasper SH, Bonocora RP, Wade JT, et al. Chemical inhibition of kynureninase reduces Pseudomonas aeruginosa quorum sensing and virulence factor expression. ACS Chem Biol. 2016;12:1–16. doi: 10.1080/21691401.2017.1408121.
- Qayyum S, Khan AU. Nanoparticles vs. biofilms: a battle against another paradigm of antibiotic resistance [10.1039/C6MD00124F]. Med Chem Commun. 2016;7:1479–1498.
- Nithyadevi D, Kumar PS, Mangalaraj D, et al. Improved microbial growth inhibition activity of bio-surfactant induced Ag–TiO2 core shell nanoparticles. Appl Surf Sci. 2015;327:504–516.
- Valodkar M, Modi S, Pal A, et al. Synthesis and anti-bacterial activity of Cu, Ag and Cu–Ag alloy nanoparticles: a green approach. Mater Res Bull. 2011;46:384–389.
- Gamerith S, Klug A, Scheiber H, et al. Direct ink‐jet printing of Ag–Cu nanoparticle and Ag‐precursor based electrodes for OFET applications. Adv Funct Mater. 2007;11(4):1106–1117. doi: 10.1021/acschembio.5b01082. Epub 2016 Feb 10.
- Li M, Noriega-Trevino ME, Nino-Martinez N, et al. Synergistic bactericidal activity of Ag–TiO2 nanoparticles in both light and dark conditions. Environ Sci Technol. 2011;45:8989–8995.
- Tan KS, Cheong KY. Advances of Ag, Cu, and Ag–Cu alloy nanoparticles synthesized via chemical reduction route. J Nanopart Res. 2013;15:1537.
- Taran M, Rad M, Alavi M. Biological synthesis of copper nanoparticles by using Halomonas elongata IBRC-M 10214/Sinteza biologica a nanoparticulelor de cupru prin utilizarea Halomonas elongata IBRC-M 10214. Ind Textila. 2016;67:351.
- Arya G, Kumari RM, Gupta N, et al. Green synthesis of silver nanoparticles using Prosopis juliflora bark extract: reaction optimization, antimicrobial and catalytic activities. Artif Cells Nanomed B. 2018;46(5)1–9.
- Rocha-Rocha O, Cortez-Valadez M, Hernández-Martínez AR, et al. Green synthesis of Ag–Cu nanoalloys using opuntia ficus-indica. Journal of Elec Materi. 2017;46:802–807.
- Amato DN, Amato DV, Mavrodi OV, et al. Destruction of opportunistic pathogens via polymer nanoparticle‐mediated release of plant‐based antimicrobial payloads. Adv Healthcare Mater. 2016;5:1094–1103.
- O'May C, Tufenkji N. The swarming motility of Pseudomonas aeruginosa is blocked by cranberry proanthocyanidins and other tannin-containing, aterials [10.1128/AEM.02677-10]. Appl Environ Microbiol. 2011;77:3061–3067.
- Hoffman LR, D’Argenio DA, MacCoss MJ, et al. Aminoglycoside antibiotics induce bacterial biofilm formation. Nature. 2005;436:1171.
- Vinckx T, Wei Q, Matthijs S, et al. The Pseudomonas aeruginosa oxidative stress regulator OxyR influences production of pyocyanin and rhamnolipids: protective role of pyocyanin. Microbiology (Reading, England). 2010;156:678–686.
- Karimipour M, Ebrahimi M, Abafat Z, et al. Synthesis of Ag@TiO2 core-shells using a rapid microwave irradiation and study of their nonlinear optical properties. Opt Mater. 2016;57:257–263.
- Kim Y-S, Rai P, Yu Y-T. Microwave assisted hydrothermal synthesis of Au@TiO2 core–shell nanoparticles for high temperature CO sensing applications. Sensor Actuat B-Chem. 2013;186:633–639.
- Rout L, Kumar A, Dhaka RS, et al. Bimetallic Ag–Cu alloy nanoparticles as a highly active catalyst for the enamination of 1,3-dicarbonyl compounds [10.1039/C6RA04569C]. RSC Adv. 2016;6:49923–49940.
- Kim SJ, Stach EA, Handwerker CA. Fabrication of conductive interconnects by Ag migration in Cu–Ag core-shell nanoparticles. Appl Phys Lett. 2010;96:144101.
- Vasileva P, Donkova B, Karadjova I, et al. Synthesis of starch-stabilized silver nanoparticles and their application as a surface plasmon resonance-based sensor of hydrogen peroxide. Colloids Surf A Physicochem Eng Asp. 2011;382:203–210.
- Yang XH, Fu HT, Wong K, et al. Hybrid Ag@TiO2 core–shell nanostructures with highly enhanced photocatalytic performance. Nanotechnology. 2013;24:415601.
- Kalaiselvi A, Roopan SM, Madhumitha G, et al. Synthesis and characterization of palladium nanoparticles using Catharanthus roseus leaf extract and its application in the photo-catalytic degradation. Spectrochim Acta A Mol Biomol Spectrosc. 2015;135:116–119.
- Li S, Shen Y, Xie A, et al. Green synthesis of silver nanoparticles using Capsicum annuum L. extract. Green Chem. 2007;9:852–858.
- He Y, Basnet P, Murph SEH, et al. Ag nanoparticle embedded TiO2 composite nanorod arrays fabricated by oblique angle deposition: toward plasmonic photocatalysis. ACS Appl Mater Interfaces. 2013;5:11818–11827.
- Buszewski B, Railean-Plugaru V, Pomastowski P, et al. Antimicrobial activity of biosilver nanoparticles produced by a novel Streptacidiphilus durhamensis strain. J Microbiol Immunol Infect. 2016;54:45–54.
- Zhang H, Chen G. Potent antibacterial activities of Ag/TiO2 nanocomposite powders synthesized by a one-pot sol − gel method. Environ Sci Technol. 2009;43:2905–2910.
- Mohammadi-Aloucheh R, Habibi-Yangjeh A, Bayrami A, et al. Enhanced anti-bacterial activities of ZnO nanoparticles and ZnO/CuO nanocomposites synthesized using Vaccinium arctostaphylos L. fruit extract. Artif Cells Nanomed Biotechnol. 2018;11:1–10.
- Laohhasurayotin K, Pookboonmee S. Multifunctional properties of Ag/TiO2/bamboo charcoal composites: preparation and examination through several characterization methods. Appl Surf Sci. 2013;282:236–244.
- Chen Y, Deng Y, Pu Y, et al. One pot preparation of silver nanoparticles decorated TiO2 mesoporous microspheres with enhanced antibacterial activity. Mater Sci Eng C Mater Biol Appl. 2016;65:27–32.
- Gurunathan S, Han JW, Kwon D-N, et al. Enhanced antibacterial and anti-biofilm activities of silver nanoparticles against gram-negative and gram-positive bacteria. Nanoscale Res Lett. 2014;319:373.
- Li Y, Zhang W, Niu J, et al. Mechanism of photogenerated reactive oxygen species and correlation with the antibacterial properties of engineered metal-oxide nanoparticles. ACS Nano. 2012;266:5164–5173.
- Abdouchakour F, Aujoulat F, Licznar-Fajardo P, et al. Intraclonal variations of resistance and phenotype in Pseudomonas aeruginosa epidemic high-risk clone ST308: a key to success within a hospital? Int J Med Microbiol. 2018;308:279–289.
- Singh BR, Singh BN, Singh A, et al. Mycofabricated biosilver nanoparticles interrupt Pseudomonas aeruginosa quorum sensing systems. Sci Rep. 2015;5:13719.
- Qin H, Cao H, Zhao Y, et al. In vitro and in vivo anti-biofilm effects of silver nanoparticles immobilized on titanium. Biomaterials. 2014;35:9114–9125.
- Naik K, Kowshik M. Anti-biofilm efficacy of low temperature processed AgCl–TiO2 nanocomposite coating. Mat Sci Eng C-Mater. 2014;34:62–68.
- Singh P, Kim YJ, Wang C, et al. Biogenic silver and gold nanoparticles synthesized using red ginseng root extract, and their applications. Artif Cells Nanomed B. 2015;44:1–816.
- Velusamy P, Su C-H, Kumar GV, et al. Biopolymers regulate silver nanoparticle under microwave irradiation for effective antibacterial and antibiofilm activities. PLoS One. 2016;11:e0157612.
- Neethirajan S, DiCicco M. Atomic force microscopy study of the antibacterial effect of fosfomycin on methicillin-resistant Staphylococcus pseudintermedius. Appl Nanosci. 2014;4:703–709.
- Salunke GR, Ghosh S, Kumar RJS, et al. Rapid efficient synthesis and characterization of silver, gold, and bimetallic nanoparticles from the medicinal plant Plumbago zeylanica and their application in biofilm control. Int J Nanomedicine. 2014;9:2635.
- Kalishwaralal K, BarathManiKanth S, Pandian SRK, et al. Silver nanoparticles impede the biofilm formation by Pseudomonas aeruginosa and Staphylococcus epidermidis. Colloids Surf B Biointerfaces. 2010;79:340–344.
- Martinez-Gutierrez F, Boegli L, Agostinho A, et al. Anti-biofilm activity of silver nanoparticles against different microorganisms. Biofouling. 2013;29:651–660.
- Ghosh S, Jagtap S, More P, et al. Dioscorea bulbifera mediated synthesis of novel Au core Ag shell nanoparticles with potent antibiofilm and antileishmanial activity. J Nanomater. 2015;2015:1–161.
- Lee J-H, Kim Y-G, Cho MH, et al. ZnO nanoparticles inhibit Pseudomonas aeruginosa biofilm formation and virulence factor production. Microbiol Res. 2014;169:888–896.
- Yin Y, Papavasiliou G, Zaborina OY, et al. De novo synthesis and functional analysis of polyphosphate-loaded poly(ethylene) glycol hydrogel nanoparticles targeting pyocyanin and pyoverdin production in pseudomonas aeruginosa as a model intestinal pathogen. Ann Biomed Eng. 2017;45:1058–1068.
- Moteriya P, Chanda S. Synthesis and characterization of silver nanoparticles using Caesalpinia pulcherrima flower extract and assessment of their in vitro antimicrobial, antioxidant, cytotoxic, and genotoxic activities. Artif Cells Nanomed B. 2017;45:1556–1567.
- Apak R, Özyürek M, Güçlü K, et al. Antioxidant activity/capacity measurement. 1. classification, physicochemical principles, mechanisms, and electron transfer (ET)-based assays. J Agric Food Chem. 2016;1064:997–1027.