
Abstract
Bacterial biofilm represents a major problem in medicine. They colonize and damage medical devices and implants and, in many cases, foster development of multidrug-resistant microorganisms. Biofilm development starts by bacterial attachment to the surface and the production of extracellular polymeric substances (EPS). The EPS forms a structural scaffold for dividing bacterial cells. The EPS layers also play a protective role, preventing the access of antibiotics to biofilm-associated microorganisms. The aim of this work was to investigate the production nanoparticles that could be used to inhibit biofilm formation. The applied production procedure from rhizome extracts of Rhodiola rosea is simple and environmentally friendly, as it requires no additional reducing, stabilizing and capping agents. The produced nanoparticles were stable and crystalline in nature with an average diameter of 13–17 nm for gold nanoparticles (AuNPs) and 15–30 nm for silver nanoparticles (AgNPs). Inductively coupled plasma mass spectrometry analysis revealed the concentration of synthesized nanoparticles as 3.3 and 5.3 mg/ml for AuNPs and AgNPs, respectively. Fourier-transform infrared spectroscopy detected the presence of flavonoids, terpenes and phenols on the nanoparticle surface, which could be responsible for reducing the Au and Ag salts to nanoparticles and further stabilizing them. Furthermore, we explored the AgNPs for inhibition of Pseudomonas aeruginosa and Escherichia coli biofilms. AgNPs exhibited minimum inhibitory concentrations of 50 and 100 µg/ml, against P. aeruginosa and E. coli, respectively. The respective minimum bactericidal concentrations were 100 and 200 µg/ml. These results suggest that using the rhizome extracts of the medicinal plant R. rosea represents a viable route for green production of nanoparticles with anti-biofilm effects.
Graphical Abstract
A schematic representation of the green synthesis, characterization and biofilm inhibition application of nanoparticles produced by extracts of R. rosea.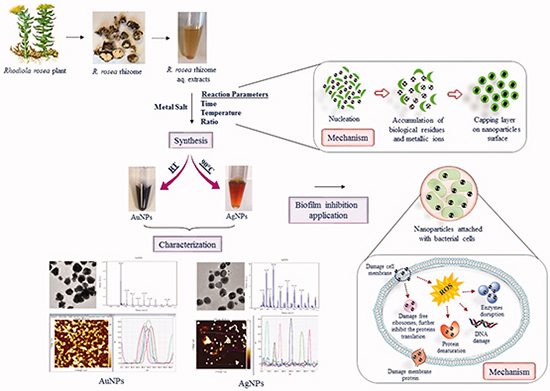
Introduction
Bacterial biofilms represent a significant problem in medicine. They are the cause of several human diseases, such as the native valve endocarditis, pneumonia in cystic fibrosis patients, and infection of chronic wounds and chronic otitis media. Bacterial biofilms colonize and damage a wide variety of medical implants and devices. Inside biofilms, bacteria often become highly resistant to antibiotics [Citation1,Citation2]. A variety of microorganisms have been found to play a crucial role in developing biofilms such as Pseudomonas aeruginosa, Staphylococcus epidermidis, Staphylococcus aureus, and Escherichia coli [Citation3]. The exact mechanism by which biofilm-associated microorganisms elicit disease are poorly understood; however, the literature suggests that detachment of cells or cell aggregates, endotoxin production and resistance against the host immune system contribute to these processes [Citation4].
Most of the currently used antibiotics are becoming inefficient against the biofilm-associated multidrug-resistant microorganisms. Therefore, it has become necessary to search for alternative approaches to mitigate biofilm associated problems [Citation5]. Recently, many organic and inorganic nanoparticles have been explored for biofilm inhibition [Citation6]. Nanoparticles exhibit antimicrobial properties due to their unique parameters, such as ultra-fine size, specific morphology, high surface area to volume ratio and presence of biochemical moieties on their surface (functional groups or surface coatings). These parameters define the therapeutic or adverse effects of nanoparticles [Citation7], for instance, Ramasamy et al. demonstrated that cinnamaldehyde immobilized gold nanoparticles (AuNPs) exhibit effective biofilm inhibition of up to >80% against Gram-positive bacteria (methicillin-sensitive and -resistant strains of S. aureus, MSSA and MRSA, respectively), Gram-negative bacteria (E. coli and P. aeruginosa) and the fungus Candida albicans [Citation5,8,9]. Rajkumari et al. showed that anisotropic AuNPs reduce the biofilm formation by P. aeruginosa by over 78% [Citation9], Shafreen et al. reported for silver nanoparticles (AgNPs) an inhibitory concentration of 300 ng/ml against a biofilm formed by E. coli [Citation10]. The antimicrobial effects of AgNPs have been more widely established against a broad range of multidrug resistant microorganisms [Citation11,12]. AgNPs not only kills the microorganisms but also play an important role in disintegrating biofilms [Citation13].
The medicinal plant Rhodiola rosea (Roseroot, golden root or arctic root) belongs to the Rhodiola genus, Crassulaceae family, and it grows on mountains in the northern regions of Asia, North America and Europe. Multiple uses of R. rosea in traditional medicine of different regions have been reported, such as treating mental and physical fatigue, stress-induced depression, anxiety and high-altitude sickness [Citation14–16]. In this study, for the first time, we examined the potential of aqueous rhizome extracts of R. rosea for synthesizing AuNPs and AgNPs. We demonstrate that the nanoparticles can be produced in an environmentally friendly setup, and that they can be used effectively to inhibit biofilms of infectious bacteria.
Materials and methods
Materials
Analytical grade gold (III) chloride trihydrate (HAuCl4·3H2O) and silver nitrate (AgNO3) were purchased from Sigma-Aldrich Chemicals.
Plant material
Rhodiola rosea seeds of Russian origin (Strictly Medicinal, Williams, OR, US) were sterilized following standard protocols for sterilization of Arabidopsis seeds and sown in vitro. The medium (MS) consisted of 2.2 g l−1 including vitamins (Dushefa Biochemie BV, Haarlem, The Netherlands), 0.5 g 2-(N-morpholino)ethanesulfonic acid (MES) (Dushefa Biochemie) l−1, 15 g sucrose l−1 and 4 g Gelrite (Dushefa Biochemie) l−1, adjusted to pH 6.3 with 5 M KOH. After 6 months, plants were transferred to soil. The plants were subsequently grown in 2 l pots (Teku VCC13, Pöppelmann GmbH & Co. KG, Lohne, Germany). The substrate used for all in vivo grown plants was a soil-peat mixture (Plugg och Såljord Kron Mull, Weibulls Horto AB, Hammenhög, Sweden). All in vivo plants were kept in a greenhouse at 23 °C under natural and supplementary light, which was provided when necessary from 7:00 to 23:00. After 1-year growth in the greenhouse, the plants were transferred to outdoor conditions where they grew for 2 years before analyses [Citation17].
Green synthesis of AuNPs and AgNPs
For the green synthesis of nanoparticles, a previously reported methodology was followed [Citation18]. The rhizome of R. rosea was harvested and washed thoroughly with distilled water. 10 g of rhizome was ground and boiled for 30 min with sterile water, maintaining a total volume of 100 ml [Citation19]. Particulates were removed from this aqueous extract by filtration. The aqueous extract was further centrifuged at 8000 rpm for 3 min to remove any fine suspended particulates [Citation20]. The crude extract was further diluted in water at different ratios of extract to water in order to synthesize AuNPs and AgNPs. For the nanoparticles synthesis, the optimized concentration of the filter-sterilized metal salt solution (HAuCl4·3H2O and AgNO3) was used, under optimal conditions. The synthesis was first monitored by the visual color change in the reaction mixture, followed by the spectral analysis [Citation18]. After the complete reduction in metal salts to nanoparticles, the nanoparticles were purified by centrifugation, first at 2000 rpm for 5 min, which allowed removing the large particulates, followed by a second round of centrifugation at 14,000 rpm for 15 min to collect the nanoparticles [Citation18,Citation21]. The obtained nanoparticles were washed thoroughly with distilled water to remove the unconverted metal ions or any other reaction constituents. Finally, the nanoparticles were collected in the form of a pellet and re-suspended in water for subsequent characterization and testing.
Characterization of nanoparticles
Ultraviolet-visible spectrophotometry
Ultraviolet-visible spectrophotometer (UV-vis) (6705 UV/Vis. Spectrophotometer, JENWAY) was used to confirm the reduction in metal ions into metal nanoparticles by scanning the reaction suspension in a 300–700 nm range. The optimization studies were also conducted using UV-vis by scanning the optimizing samples at 300–700 nm [Citation22].
Matrix-assisted laser desorption/ionization time-of-flight mass spectrometry
The presence and composition of clusters on nanoparticles surface were studied by using matrix-assisted laser desorption/ionization time-of-flight mass spectrometry (MALDI-TOF). Purified nanoparticles (1 μl) were loaded onto an AnchorChip™ target plate (Bruker-Daltonics, Bremen, Germany), covered by 1 μl of the matrix solution (0.5 μg/μl 2,5-dihydroxybenzoic acid in 90% (v/v) acetonitrile, 0.1% (v/v) trifluoroacetic acid (TFA) and washed with 0.5% (v/v) TFA. All analyses were performed on the MALDI-TOF mass spectrometer (Ultraflex II, Bruker-Daltonics, Bremen, Germany) in a positive ion reflector mode with 1000 laser shots per spectrum using Flex Control v3.4. Spectra were processed using Flex Analysis v3.0 (Bruker-Daltonics, Bremen, Germany), and mass calibration was performed using protein standards (tryptic digest of β-lactoglobulin, 5 pmol/μl) [Citation23].
Transmission electron microscopy
Transmission electron microscopy (TEM) by FEI Tecnai T20 G2, operated at 200 kV was used to characterize the shape and size of nanoparticles. TEM was further used for analyzing the selected area electron diffraction (SAED) pattern of nanoparticles [Citation24]. The sample preparation involved liquid spotting on carbon-coated copper grids, and subsequent air drying before the samples were transferred to the microscope.
Atomic force microscopy
The atomic force microscopy (AFM) measurements (Park NX20 from www.parkafm.com) were carried out in the intermittent contact mode using standard probes of single crystal highly doped silicon with a radius of curvature of less than 30 nm (PointProbe Plus™ or SuperSharpSilicon™ Non-Contact AFM probes from Nanosensors). The standard uncertainty u(d) of the measured diameter was u(d) < 0.05 × d for the measured particles.
Particles size and zeta potential analysis
The particle size distribution and zeta potential of the nanoparticles were studied by dynamic light scattering (DLS) (Zetasizer Nano ZS, Japan). Hydrodynamic diameters and polydispersity index (PDI) were analyzed at 25 °C. As a reference, a dispersive medium of pure water with a refractive index of 1.330, viscosity of 0.8872 and dielectric constant of 78.5 was used [Citation25].
Fourier Transform-Infrared spectroscopy
The Fourier-transform infrared spectroscopy (FT-IR) measurements were conducted on FTIR, Nicolet iS50, Thermo Scientific. The samples were prepared by air-drying the purified nanoparticles and scanning on the FT-IR instrument over the range of 4000–450 cm−1 at a resolution of 4 cm−1. The FT-IR analysis was done to study the interactions between the functional groups present as a source of reducing, catalytic and capping agents on the surface of synthesized nanoparticles. The spectra recorded were plotted as transmittance (%) versus wavenumber (cm−1) [Citation26].
Single-particle inductively coupled plasma-mass spectrometry
Single-particle inductively coupled plasma-mass spectrometry (sp-ICP-MS) was used for size fractionation and quantification of synthesized nanoparticles. Nanoparticles were measured in single particle mode (time-resolved analysis), sp-ICP-MS (NexION 350 D, PerkinElmer). The dwell time was set to 100 µs and the scan time to 100 s. The particle size calculations were based on the calibration curve of the dissolved metal, which was matrix-matched with the samples (i.e. prepared in the same medium). In brief, the signal intensity for the dissolved metal is correlated with the signal intensity of the particle, which allows calculations of the particle mass and diameter, assuming that particles are spherical. The principle of the method together with equations has been described previously [Citation27]. The transport efficiency was calculated based on 60 nm particles (Perkin Elmer, USA), and the measurements were conducted in the same matrix used for experimental samples.
Nanoparticles stability
Particles stability over time was studied by scanning the samples in the 300-700 nm range, at time zero and after one month. The concentration of nanoparticles was measured for fresh nanoparticles and after two weeks difference by sp-ICP-MS. Thermal stability of powdered nanoparticles has been determined by the thermogravimetric analysis (TGA), on a Discovery TGA (TA Instrument). For the TGA analysis, nanoparticles were placed in an alumina pan and heated from 20 to 700 °C at a ramping time of 10 °C/min.
Minimum inhibitory concentration and minimal bactericidal concentration of nanoparticles
To evaluate the antibacterial activity of synthesized AuNPs and AgNPs, Escherichia coli UTI 89 and Pseudomonas aeruginosa PAO1 were used. Both bacterial strains were grown in Luria-Bertani (LB) broth. Minimum inhibitory concentration (MIC) and minimum bactericidal concentration (MBC) of AuNPs and AgNPs were evaluated by a microdilution method, as described previously [Citation28]. Briefly, bacterial cultures of both strains were grown overnight and diluted to obtain 1–2 × 10⁵ colony forming units (CFUs)/ml. These were mixed with serially diluted AuNPs and AgNPs with the final nanoparticle concentration ranging from 6.25 µg/ml to 400 µg/ml. The bacterial suspensions with nanoparticles were incubated at 37 °C for 24 h, and the optical density (OD) at 550 nm was recorded. The MIC was defined as the lowest concentration of nanoparticles which limited the bacterial growth at OD550 = 0.05 or lower. For assessing the MBC, 10 µl of samples described above were plated on agar plates and incubated at 37 °C. MBC value was defined as the lowest concentration of nanoparticles, which prevented any visible growth of bacteria on agar plates.
Biofilm inhibition assay
To evaluate the effect of AuNPs and AgNPs against biofilm formation, bacterial cultures grown overnight were diluted with the LB broth to obtain 1–2 × 10⁶ CFUs/ml. These samples were placed in 96 well plate and incubated at 37 °C for 5 h. After the incubation, the old culture medium was replaced with a fresh medium containing different concentrations of AuNPs or AgNPs, without physically disrupting the biofilm. Samples were incubated further at 37 °C for 24 h. Thereafter, the medium was removed, samples were gently washed two times with sterile water to remove the planktonic state/free floating bacteria and dried for 30 min at room temperature. The biofilms were stained with a 0.1% solution of crystal violet for 20 min. The excess stain was removed by washing with sterile water for five times, and stained biofilms were dried at room temperature for 1 h. 200 µl absolute ethanol was then added to each stained biofilm sample, and the mixture was agitated vigorously for 15 min to extract the stain. The OD of extracted crystal violet was measured at 590 nm.
Effect on bacterial growth
In order to examine the effect of nanoparticles on growth of E. coli and P. aeruginosa at sub-MIC levels, bacterial growth was monitored spectrophotometrically at 600 nm against a culture medium blank, at selected time intervals. Briefly, 100 µl of bacterial suspension from overnight culture was sub-inoculated in the fresh medium and incubated at 37 °C in shaking incubator. AgNPs (12–100 μg/ml) were tested on bacterial growth.
Nanoparticle coatings and bacterial adhesion assay
AgNPs were coated on 15 mm glass cover slips by drop casting method [Citation29]. Briefly, 250 µl of samples with different concentrations of water dispersed nanoparticles were placed on cover glass and dried at 37 °C overnight. The coated cover glass slides were used to evaluate the effect of these nanoparticles on bacterial adhesion. 250 µl of bacterial suspension containing 1–2 × 10⁶ CFUs/ml were added to the non-coated and coated cover glass and incubated for 5 h at 37 °C. After incubation, biofilms were rinsed with sterile water and homogenized by sonication. The homogenized biofilm suspensions were plated on agar plates for CFU counting. Furthermore, adhesion of the bacterial cells on the AgNPs coated and non-coated surface was visualized by using fluorescence microscopy as described previously [Citation30]. Briefly, after a 5 h period of bacterial adhesion, biofilms were rinsed with sterile water and stained with the mixture of 6.0 μM SYTO 9 and 30 μM potassium iodide from Live/Dead BacLight Viability kit L13152 (Invitrogen, Molecular Probes, Inc. Eugene, OR) for 20 min. The imaging of stained biofilms was performed by using a fluorescence microscope (Axio Imager.Z2m Carl Zeiss, Zena, Germany).
Statistical analysis
All assays were performed in at least three biological replicates. Data are presented as the mean ± standard deviation (SD). The intergroup differences were estimated by one-way analysis of variance, followed by a post hoc multiple comparison (Tukey test). Values were considered statistically significant at p ≤ .05.
Results and discussion
Green synthesis of nanoparticles
The synthesis methodology for AuNPs and AgNPs using R. rosea aqueous rhizome extracts that we followed is outlined in the graphical abstract. For the green nanoparticles synthesis, the aqueous rhizome extracts of R. rosea were incubated separately with respective metal salts at different conditions as outlined in the materials and methods section. Plant components such as polysaccharides, flavonoids, terpenoids, polyphenols, amino acids, alkaloids, organic acids and vitamins are all known to contribute to reducing metals salts to form nanoparticles and/or capping and stabilizing the produced nanoparticles [Citation26,Citation31]. AuNPs and AgNPs were synthesized successfully, as indicated by the color change in the reaction suspension from light yellow to deep purple for AuNPs and brown for AgNPs () [Citation21,Citation32,Citation33]. The synthesis of nanoparticles was confirmed by a wavelength scan (300–700 nm) of the nanoparticles suspension. From previous studies, it has been suggested that the spectra in the 500–600 nm range correspond to AuNPs and in 350–500 nm range corresponds to AgNPs [Citation34,Citation35]. Both, AuNPs and AgNPs were scanned directly in suspension and with purified nanoparticles () [Citation18]. We also investigated the purified nanoparticles stability in suspension by scanning them after one month. The results indicated stability of synthesized nanoparticles in these conditions.
Figure 1. Visible and UV-vis spectra of AuNPs (A) and AgNPs (B). The purple and brownish color with absorbance spectra at 540 and 440 nm showed the formation of AuNPs and AgNPs in the respective reaction mixture since the color and absorbance is due to the surface plasmon resonance of synthesized nanoparticles. UV-visible spectra showing unchanged SPR for AuNPs and AgNPs, freshly prepared nanoparticles (A,B), purified nanoparticles (C,D), at the time of synthesis and one month after (E,F). The plant extract and nanoparticles are shown as insets in panels A and B.
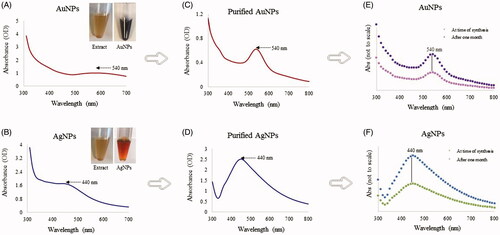
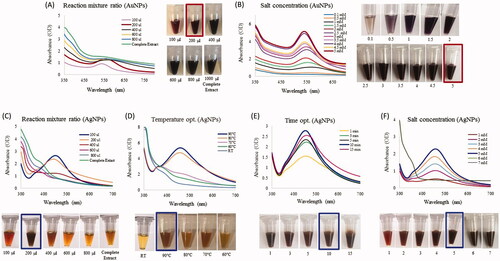
Figure 2. Optimization studies based on the UV-vis spectral analysis for AuNP and AgNP production by the R. rosea rhizome extract. The optimized parameters for AuNPs were: reaction mixture ratio (extract:water) (A) and gold salt concentration (B). The optimized parameters for AgNPs were as follows: the reaction mixture ratio (extract:water) (C), temperature (D), time (E) and silver salt concertation (F). The photograph of test tubes with optimizing concentrations is shown next to respective figures.
Optimization of bioreduction of gold and silver ions into nanoparticles
Reaction parameters such as the reaction mixture ratio, temperature, time and concentration of metal ions have been taken into consideration to evaluate the possibilities for efficient synthesis of nanoparticles. Our results demonstrated that a 2:8 ratio of extract to water was optimal for economical synthesis of AuNPs (). The particles synthesis was completed at room temperature within 4 s, which shows the economical potential of this process. The optimal time for AuNPs synthesis in this study was 4 s, which is quite less than in other reports, for instance, Markus et al. reported 50 min for AuNPs synthesis by Angelicae pubescentis [Citation36]. The optimal gold salt concentration for AuNP synthesis was 5 mM. At this concentration, the nanoparticle absorbance peak was also most narrow, indicating nanoparticle stability and the absence of agglomeration (). All the obtained spectra were in agreement with visual inspection of samples in tubes, as shown in [Citation22]. For the AgNP synthesis, the optimal reaction mixture ratio was also 2:8 extract to water (). The temperature and time optimization studies revealed that the 90 °C and 10 min are optimal for AgNPs formation (). Further increase in the temperature led to degradation and precipitation in the reaction mixture, suggesting that nanoparticles were not stable and agglomerated at 100 °C and above. For silver salt optimization, we tested a range of salt concentration from 1 to 7 mM, 5 mM of silver nitrate was the optimal concentration for AgNP synthesis. Further increase in the salt concertation led to a significant shift of the absorbance peak (), suggesting a loss in nanoparticles stability and aggregation. Importantly, the optimal synthesis time for AuNPs and AgNPs is considerable shorter than in other reports, which showed longer time duration for nanoparticles synthesis, for instance, Huo et al. showed that Gu-AuNp and Gu-AgClNp syntheses take 4 and 40 min by using Glycyrrhiza root extract [Citation37]. Thus, the optimal conditions identified for AuNPs (2:8 ratio, 5 mM HAuCl4·3H2O salt and room temperature) and for AgNPs (2:8 ratio, 90 °C, 6 mM and 10 min) resulting in highest yield and minimal agglomeration.
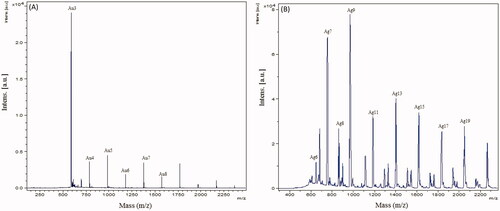
The synthesized nanoparticles were analyzed by MALDI-TOF to map the composition of the capping layer. Both AuNP and AgNP samples produced ions in the low-mass regions of the spectra between 500 and 22,000 m/z. For AuNPs, several peaks were found to correspond to gold cluster ions (197Au+, atomic weight 196.9666 u), including 197Au3+ (calculated value 590.8997), 197Au4+ (787.8663), 197Au5+ (984.8328), 197Au6+ (1181.7993), 197Au7+ (1378.7659), 197Au8+ (1575.7325) and 197Au12+ (2363.5992). These are indicated in acquired spectra shown in (). For AgNPs, several peaks could be assigned to silver cluster ions (107Ag+, atomic weight 107.8682 u), in particular of higher cationic species, such as 107Ag6+ (calculated value 647.2092), 107Ag7+ (755.0774), 107Ag8+ (862.9456), 107Ag9+ (970.8138), 107Ag11+ (1186.5502), 107Ag13+ (1402.2866), 107Ag15+ (1618.023), 107Ag17+ (1833.7594) and 107Ag19+ (2049.4958) (). Although a more detailed investigation is required to answer all the biological components present on the surface, this study provides the basic understanding of capping layer content [Citation23].
Figure 3. Matrix-assisted laser desorption ionization-time of flight (MALDI-TOF) spectra for AuNPs (A) and AgNPs (B).
Nanoparticles characterization
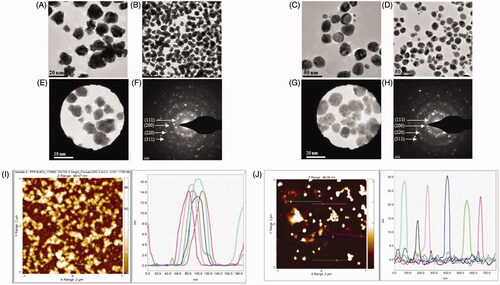
TEM observations confirmed the presence of irregularly shaped nanoparticles for AuNPs with size ranging from 12 to 18 nm (), and spherical nanoparticles for AgNPs with the size range between 12 and 30 nm (). The crystallinity of the biosynthesized nanoparticles was evaluated by selected area (electron) diffraction (SAED) [Citation22,Citation33]. The multiple electron diffraction patterns corresponding to the polycrystalline nature of the synthesized nanoparticles were detected conforming to lattice planes of Bragg’s reflection (111), (200), (220) and (311) () [Citation24,Citation38]. This is in agreement with the finding reported by Abbai et al, who characterized multifunctional Ag and AuNPs from the oriental herbal adaptogen Siberian ginseng [Citation26]. To complement the TEM analysis, which provides only a two-dimensional image of nanoparticles, we performed AFM, which allows for three-dimensional profiling, i.e. measurement of nanoparticles height (). The AFM analysis of samples showed that the height of AuNPs was in the range of 13–17 nm and for AgNPs in the range of 15–30 nm. The results of AFM analysis were in close correlation with the TEM data.
Figure 4. Transmission electron microscopy (TEM) images of nanoparticles showing the particle shape of AuNPs (A,B) and AgNPs (C,D) and the selected area diffraction pattern (SAED) of AuNPs (E,F) and AgNPs (G,H), with respective SAED apertures. From these images, the size of nanoparticles with crystalline nature was estimated at 13–17 nm for AuNPs and 15–30 nm for AgNPs. The AFM analysis of nanoparticles for AuNPs and AgNPs is shown in panels (I) and (J), respectively.
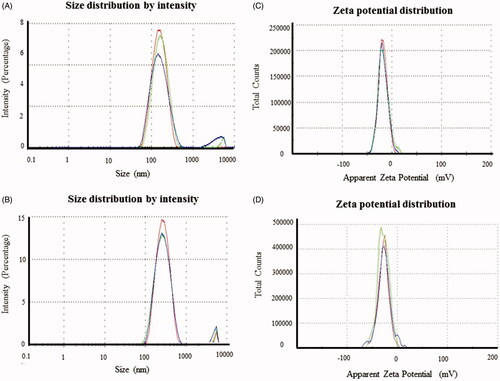
The DLS analysis was performed to study the mean nanoparticle size (hydrodynamic diameter) and zeta potential, available surface charge on nanoparticles surface, which corresponds to their stability (). The hydrodynamic diameter observed for AuNPs was 139.9 nm with a PDI value of 0.34 (), for AgNPs the hydrodynamic diameter was 270 nm, with a PDI value of 0.28 () [Citation38]. Next, we performed the zeta potential analysis to investigate the surface characteristics of the synthesized nanoparticles and to correlate this with long-term stability. High value of zeta potential represents a higher electrical charge on the surface of the nanoparticles, which results in substantial repulsive forces among the nanoparticles that prevent agglomeration. Low zeta potential facilitates aggregation due to van der Waals inter-particle attractions. We observed a negative zeta potential of about −18.1 mV for AuNPs and −26.5 mV for AgNPs (), which is higher than the surface charge required for nanoparticles stability [Citation39]. Balakumaran et al. showed the mycosynthesis of gold and AgNPs with the negative zeta potential value [Citation40]. Essam et al reported that AgNPs produced by Bacillus licheniformis showed that the zeta potential ranged from −16.6 to −21.3 mV was quite stable, demonstrated excellent in vitro antimicrobial activity against important human pathogens and antiviral activity against the Bean Yellow Mosaic Virus [Citation41]. Thus, the negative surface charge is highly responsible for providing the colloidal stability to nanoparticles, especially in biological environments [Citation42].
Figure 5. Particles size distribution of AuNPs (A) and AgNPs (B). Zeta potential analysis shows the surface charge on nanoparticles with respect to the total number of nanoparticles present in the solution for AuNPs (C) and AgNPs (D). This study has been done in triplicates.
Nanoparticles surface contains biomolecules from the R. rosea extract
The specific applications of nanoparticles are limited by their tendency to be self-aggregated during the post-synthesis phase, which is due to the absence of capping or stabilizing layers or unprotected nanoparticles surface. Nanoparticles that are not synthesized in biological systems are routinely capped with various agents such as surfactants, polymers, dendrimers, biological templates and biomacromolecules that protect these nanoparticles from self-aggregation. By comparison, the “green synthesis” of colloidal nanoparticles involves biocompatible ingredients, which act as functionalizing ligands under physiological conditions of temperature and pressure, making these nanoparticles more suitable for biomedical applications, mostly due to their long-term stability [Citation38]. In the current study, the rhizome extract of R. rosea provides bioactive components, which get attached on the surface of the nanoparticles and form a capping layer. The FT-IR measurement was carried out, to acquire further information about the presence of biological compounds in the nanoparticles capping layer [Citation26]. The analysis of the FT-IR spectrum of plant extracts and corresponding nanoparticles suggested extensive similarities between the samples. In particular, the spectra of R. rosea rhizome extract, AuNPs, and AgNPs are characterized by the O–H band at 3280.97, 3176.36 and 3200.61 cm−1. The C–H stretching was observed between 2932.17 and 2941.62 cm−1 and a band at 1604.05, 1597.98 and 1598.12 corresponding to C=C stretch, COOH stretch were observed. Bands at 1344.27, 1435.50, 1468.97 cm−1 corresponds to CH3 and CH2 asymmetric deformation. Moreover, C–O stretching at 1014.90–997.11 cm−1 were also detected in all the samples () (). The FT-IR peaks of nanoparticles suggest that phenolic compounds were likely to be involved in the reduction of HAuCl4·3H2O and AgNO3 to AuNPs and AgNPs, respectively. R. rosea contains several bioactive compounds, responsible for its pharmacological activity. Research has been focused on rosavin and its derivatives, which are only present in R. rosea and salidroside, common to most Rhodiola species [Citation16]. However, other substances, including flavonoids such as quercetin and gossypetin, which were identified among others in R. rosea extracts [Citation43], could be involved in pharmacological activity [Citation14–16]. The exact mechanism of nanoparticles synthesis from plant extract is unknown. The literature suggests that upon addition of metal salts to the plant extract, the metal ions rapidly bind with the proteins and water-soluble molecules with functional groups (such as –OH and –COOH) and are entrapped. This led to the conformational changes in proteins and exposes their hydrophobic residues to aqueous phases. This further causes introduction of reducing agents from plant extract and favors the transformations of entrapped metals into metal nanoparticles [Citation12,Citation44]. Various water-soluble plant biomolecules contribute as reducing and capping agents in nanoparticle production. Terpenoids, which are a class of diverse organic polymers found in plants, have been suggested to be accountable for the reduction of silver and gold ions into nanoparticles [Citation31,Citation45]. Similarly, flavonoids possess various functional groups, which are capable of reducing metal ions into nanoparticles [Citation21,Citation45].
Figure 6. FT-IR spectra of rhizome extract (A), AuNPs (B) and AgNPs (C) for the identification of functional groups and interactions between molecules and the nanoparticle surfaces.
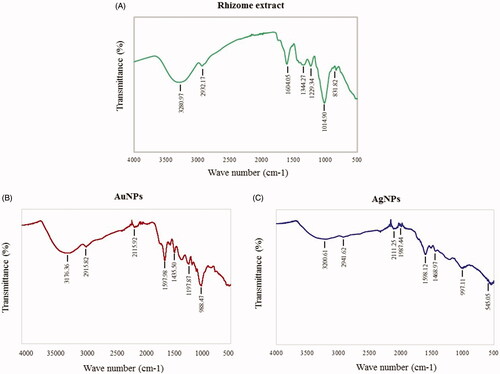
Table 1. Main features FT-IR spectra of R. rosea rhizome extract, AuNPs and AgNPs.
Nanoparticles stability
Unstable nanoparticles tend to form aggregates, resulting in diminished surface area for interaction. Stability therefore enhances the effectiveness of the nanoparticles and their usefulness in applications, due to, e.g. improved antimicrobial activity. We confirmed the stability of synthesized nanoparticles by keeping them in solution for different time intervals of up to a month. There was no major shift in the UV-vis spectrum of the nanoparticles solution up to one month, which suggested full stability of nanoparticles in an aqueous system ().
Single particle ICP-MS measurements were conducted to determine AuNPs and AgNPs concentration and size distribution in the samples at the beginning of the test and after two weeks. For the AuNPs sample, the particle number concentration at the start of the test was 513 × 103 particles/ml, which corresponds to 0.0449 µg/l. The total gold concentration, when adding the dissolved fraction (0.171 µg/l), was 0.448 µg/l. After two weeks, the particle concentration and the dissolved gold concentration slightly increased to 622 × 103 particles/ml and 0.264 µg/l, respectively, resulting in a total gold concentration of 0.417 µg/l. The mean size of AuNPs in the first run and after two weeks was 34 and 31 nm, respectively. The AuNPs therefore seems to be stable over two weeks of incubation, displaying only minor changes in particle number and size (). The measured particle number concentration for the first run for AgNPs was 62.5 × 10³ particles/ml with the mean size of 39 nm, which corresponds to mass concentration of 0.0449 µg/l. The dissolved silver concentration was 0.082 µg/l, resulting in total silver concentration (i.e. particulate and dissolved) of 0.127 µg/l. The measurements of the same sample after two weeks showed decreased AgNPs size (34 nm), as well as lower particle number concentration (37 × 103 particles/ml, corresponding to 0.029 µg/l) and increased dissolved silver concentration (0.107 µg/l). The total silver concentration, however, remained relatively unchanged at 0.136 µg/l. This indicates that, over time, AgNPs are dissolving and becoming smaller ().
Figure 7. ICP-MS measurement of AuNPs (A) and AgNPs (B) of freshly prepared nanoparticles which shows the size distribution histogram. ICP-MS measurements were performed initially and after two weeks of incubation to analyze the nanoparticles stability for AuNPs (C) and AgNPs (D). The dwell time was set to 50 µs and the scan time to 100s. Thermogravimetric analysis (TGA) measurement of AuNPs (E) and AgNPs (F), which shows the complete nanoparticles degradation at high temperature.
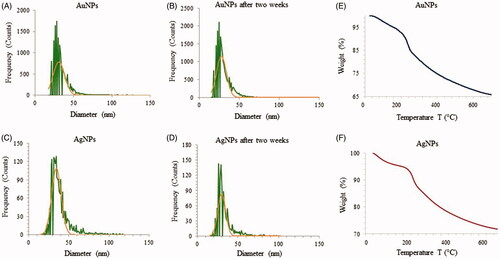
Additionally, TGA was conducted to measure the thermal stability and weight loss of AuNPs and AgNPs as a function of temperature (). The first observed weight loss was attributed to the loss of entrapped water molecules on the nanoparticles surface [Citation46]. The thermal degradation of nanoparticles picks up pace above 200 °C, and by 700 °C the nanoparticles degrade completely. This behavior is in line with previous reports on thermal stability of nanoparticles. Taken together, our stability experiments showed that nanoparticles produced from R. rosea extracts are reasonably stable in our experimental setup for a period of up to two weeks.
Biofilm inhibition by nanoparticles
AgNPs are known to have strong antibacterial activity against both Gram-positive and Gram-negative bacteria [Citation4]. Since, the antibacterial effect is solely dependent on the method of synthesis, size of particles, release of silver and the type of bacterial strains, many variations in nanoparticle concentration required for antibacterial effects have been reported by different studies [Citation47–50]. We performed an initial antimicrobial evaluation of synthesized AgNPs and AuNPs by determination of MIC and MBC against E. coli and P. aeruginosa. The obtained results demonstrate a significant antibacterial activity of AgNPs with bacteriostatic and bactericidal effects at the concentration of 50 and 100 µg/ml against P. aeruginosa and 100 and 200 µg/ml against E. coli respectively (). In contrast, AuNPs did not show any antibacterial activity against either bacterial strain even at a high concentration of 200 µg/ml. It is well known that nanoparticle antimicrobial efficacy is size dependent, small particles can more easily interact to the cell surface and are internalized into the cytoplasm due to less spatial hindrance. Additionally, smaller nanoparticles provide greater surface area to interact with microorganisms or biological components, thus being more effective. AgNPs release Ag+ ions via oxidation and increase the generation of reactive oxidative species, which damage cell components and cause cell death [Citation51]. The small size of our AgNPs (15–30 nm) is an additional contributing factor to their antibacterial effect. Next, we tested the efficacy of both AgNPs and AuNPs in inhibiting the biofilm formation by E. coli and P. aeruginosa, in the concentration range of 1.6–200 µg/ml. As shown in , both types of nanoparticles inhibited the biofilm formation by P. aeruginosa and E. coli at the sub-MIC concentrations. The significant inhibition in biofilm formation was observed at ≥6.25 µg/ml for AgNPs and ≥12.5 µg/ml for the AuNPs. The inhibition on the biofilm formation caused by AuNPs was particularly interesting, since these particles did not have a direct bactericidal effect. Biofilm inhibition at sub-MIC concentrations might be due to non-lethal damage or due to inhibitory effect on expression of genes related to motility and biofilm formation [Citation52,Citation53]. As shown in , AgNPs at sub-MIC level significantly inhibited the growth rate of both bacterial strains, suggesting significant levels of sub-lethal damage. Adhesion of bacteria to any surface is a primary stage for biofilm formation. Since the adhesion of bacteria might be affected by several factors such as growth environment, bacterial viability and material surface characteristics, we evaluated the inhibitory effect of AgNPs against the bacterial adhesion on a cover glass at the sub-MIC level. AgNPs were coated on the cover glass and incubated at 37 °C with the bacterial culture. Thereafter, viability of attached bacteria was examined by counting CFUs and live/dead staining. As shown in , concentration of AgNPs used for coating was in inverse linear dependence with adhesion of E. coli and P. aeruginosa. To further clarify the results obtained from the adhesion assay, live/dead staining of adhering cells was carried out. The results showed a partial killing effect of AgNPs at the sub-MIC level (. The results demonstrate that AgNPs at sub-MIC concentrations lead to partial killing that results in in inhibition of bacterial growth and adhesion.
Figure 8. Effect of AuNPs and AgNPs on bacterial biofilm formation. P. aeruginosa (A, B) and E. coli (C, D). All the experiments were performed in biological triplicates, data represent mean ± SD. *p < .05, **p < .005 and ***p < .001.
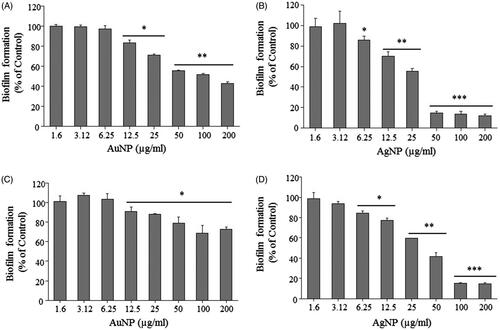
Figure 9. Effect of AgNPs on the growth of P. aeruginosa PA01(A) and E. coli UTI89 (B) at sub-MIC levels. All the experiments were performed in biological triplicates, data represent mean ± SD.
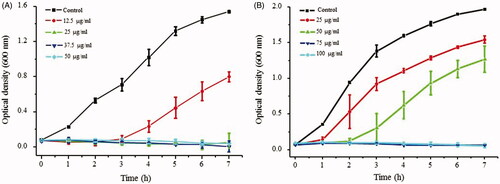
Figure 10. Effect of AgNP on bacterial adhesion on the nanoparticle coated glass surface. P. aeruginosa (A) and E. coli (B). All the experiments were performed in biological triplicates, data represent mean ± SD. *p < .05, **p < .005 and ***p < .001.
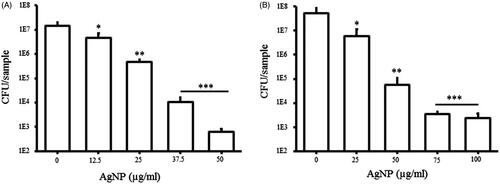
Figure 11. Representative fluorescence microscopic images of bacterial biofilms on the AgNP coated glass surface. P. aeruginosa (A) and E. coli (B) were cultured for 5 h on the control and nanoparticle-coated surface and stained with live/dead staining before imaging with a fluorescence microscope.
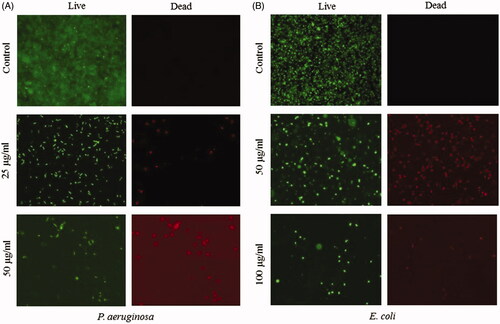
Table 2. MIC and MBC of AgNPs against P. aeruginosa and E. coli. MIC and MBC of AgNPs were >200 μg/ml against both bacterial strains.
Conclusion
There is a growing interest for the development of environmentally benign protocols to synthesize nontoxic metallic nanoparticles for medical or clinical purposes. This work demonstrates the applicability of R. rosea rhizome extracts for rapid and economical synthesis of AuNPs and AgNPs. We have concluded that crystalline AuNPs and AgNPs can be synthesized at quite high concentrations in the range of 3–5 mg/ml, respectively. Additionally, we demonstrated that produced AgNPs can be effective for inhibition and disruption of biofilms formed by P. aeruginosa and E. coli. Thus, R. rosea rhizome extracts could be useful for producing nanoparticles in a rapid and biocompatible way. In the future, we can consider these kinds of medicinal plants with high therapeutic value will create a new platform for synthesizing nanoparticles with high concentration, crystallinity and stability.
Disclosure statement
No potential conflict of interest was reported by the authors.
Additional information
Funding
Related Research Data
References
- Hoiby N, Bjarnsholt T, Givskov M, et al. Antibiotic resistance of bacterial biofilms. Int J Antimicrob Agents. 2010;35:322–332.
- AlMatar M, Makky EA, Var I, et al. The role of nanoparticles in the inhibition of multidrug-resistant bacteria and biofilms. Curr Drug Deliv. 2018;15:470–484.
- Donlan RM, Costerton JW. Biofilms: survival mechanisms of clinically relevant microorganisms. Clin. Microbiol Rev. 2002;15:167–193.
- Markowska K, Grudniak AM, Wolska KI. Silver nanoparticles as an alternative strategy against bacterial biofilms. Acta Biochim Pol. 2013;60:523–530.
- Natan M, Banin E. From nano to micro: using nanotechnology to combat microorganisms and their multidrug resistance. FEMS Microbiol Rev. 2017;41:302–322.
- Gagner JE, Shrivastava S, Qian X, et al. Engineering nanomaterials for biomedical applications requires understanding the nano-bio interface: a perspective. J Phys Chem Lett. 2012;3:3149–3158.
- Navya PN, Daima HK. Rational engineering of physicochemical properties of nanomaterials for biomedical applications with nanotoxicological perspectives. Nano Converg. 2016;3:1.
- Ramasamy M, Lee JH, Lee J. Direct one-pot synthesis of cinnamaldehyde immobilized on gold nanoparticles and their antibiofilm properties. Colloids Surf B. 2017;160:639–648.
- Rajkumari J, Meena H, Gangatharan M, et al. Green synthesis of anisotropic gold nanoparticles using hordenine and their antibiofilm efficacy against Pseudomonas aeruginosa. IET Nanobiotechnol. 2017;11:987–994.
- Shafreen RB, Seema S, Ahamed AP, et al. Inhibitory effect of biosynthesized silver nanoparticles from extract of Nitzschia palea against curli-mediated biofilm of Escherichia coli. Appl Biochem Biotechnol. 2017;183:1351–1361.
- Singh P, Kim YJ, Singh H, et al. Biosynthesis, characterization, and antimicrobial applications of silver nanoparticles. Int J Nanomed. 2015;10:2567–2577.
- Huang J, Lin L, Sun D, et al. Bio-inspired synthesis of metal nanomaterials and applications. Chem Soc Rev. 2015;44:6330–6374.
- Chapman J, Weir E, Regan F. Period four metal nanoparticles on the inhibition of biofouling. Colloids Surf B. 2010;78:208–216.
- Cropley M, Banks AP, Boyle J. The effects of Rhodiola rosea L. Extract on anxiety, stress, cognition and other mood symptoms. Phytother Res. 2015;29:1934–1939.
- Mao JJ, Li QS, Soeller I, et al. Rhodiola rosea therapy for major depressive disorder: a study protocol for a randomized, double-blind, placebo-controlled trial. J Clin Trials. 2014;4:170.
- Ishaque S, Shamseer L, Bukutu C, et al. Rhodiola rosea for physical and mental fatigue: a systematic review. BMC Complement Altern Med. 2012;12:70.
- Murashige T, Skoog F. A revised medium for rapid growth and bio assays with tobacco tissue cultures. Physiol Plant. 1962;15:473–497.
- Singh P, Kim YJ, Yang DC. A strategic approach for rapid synthesis of gold and silver nanoparticles by Panax ginseng leaves. Artif Cells Nanomed Biotechnol. 2016;44:1949–1957.
- Singh P, Kim YJ, Wang C, et al. The development of a green approach for the biosynthesis of silver and gold nanoparticles by using Panax ginseng root extract, and their biological applications. Artif Cells Nanomed Biotechnol. 2016;44:1150–1157.
- Singh P, Kim YJ, Wang C, et al. Biogenic silver and gold nanoparticles synthesized using red ginseng root extract, and their applications. Artif Cells Nanomed Biotechnol. 2015;44:1–6.
- Ahn S, Singh P, Jang M, et al. Gold nanoflowers synthesized using Acanthopanacis cortex extract inhibit inflammatory mediators in LPS-induced RAW264.7 macrophages via NF-kappaB and AP-1 pathways. Colloids Surf B 2017;160:423–428.
- Singh P, Singh H, Kim YJ, et al. Extracellular synthesis of silver and gold nanoparticles by Sporosarcina koreensis DC4 and their biological applications. Enzyme Microb Technol. 2016;86:75–83.
- Sekuła J, Nizioł J, Rode W, et al. Silver nanostructures in laser desorption/ionization mass spectrometry and mass spectrometry imaging. Analyst. 2015;140:6195–6209.
- Malaikozhundan B, Vijayakumar S, Vaseeharan B, et al. Two potential uses for silver nanoparticles coated with Solanum nigrum unripe fruit extract: biofilm inhibition and photodegradation of dye effluent. Microb Pathogenesis. 2017;111:316–324.
- Du J, Singh H, Yi TH. Antibacterial, anti-biofilm and anticancer potentials of green synthesized silver nanoparticles using benzoin gum (Styrax benzoin) extract. Bioprocess Biosyst Eng. 2016;39:1923–1931.
- Abbai R, Mathiyalagan R, Markus J, et al. Green synthesis of multifunctional silver and gold nanoparticles from the oriental herbal adaptogen: Siberian ginseng. Int J Nanomed. 2016;11:3131–3143.
- Pace HE, Rogers NJ, Jarolimek C, et al. Determining transport efficiency for the purpose of counting and sizing nanoparticles via single particle inductively coupled plasma mass spectrometry. Anal Chem. 2011;83:9361–9369.
- Pandit S, Chang KW, Jeon JG. Effects of Withania somnifera on the growth and virulence properties of Streptococcus mutans and Streptococcus sobrinus at sub-MIC levels. Anaerobe. 2013;19:1–8.
- Perez-Rafols C, Bastos-Arrieta J, Serrano N, et al. Ag nanoparticles drop-casting modification of screen-printed electrodes for the simultaneous voltammetric determination of Cu(II) and Pb(II). Sensors. 2017;17:1458.
- Pandit S, Ravikumar V, Abdel-Haleem AM, et al. Low concentrations of vitamin C reduce the synthesis of extracellular polymers and destabilize bacterial biofilms. Front Microbiol. 2017;8:2599.
- Singh P, Kim YJ, Zhang D, et al. Biological synthesis of nanoparticles from plants and microorganisms. Trends Biotechnol. 2016;34:588–599.
- Amendola V, Pilot R, Frasconi M, et al. Surface plasmon resonance in gold nanoparticles: a review. J Phys Condens Matter. 2017;29:203002
- Singh H, Du J, Singh P, et al. Ecofriendly synthesis of silver and gold nanoparticles by Euphrasia officinalis leaf extract and its biomedical applications. Artif Cells Nanomed Biotechnol. 2017;1–8.
- Mortazavi SM, Khatami M, Sharifi I, et al. Bacterial biosynthesis of gold nanoparticles using Salmonella enterica subsp. enterica serovar typhi isolated from blood and stool specimens of patients. J Clust Sci. 2017;28:2997–3007.
- Khatami M, Amini E, Amini A, et al. Biosynthesis of silver nanoparticles using pine pollen and evaluation of the antifungal efficiency. Iran J Biotechnol. 2017;15:95–101.
- Markus J, Wang D, Kim YJ, et al. Biosynthesis, characterization, and bioactivities evaluation of silver and gold nanoparticles mediated by the roots of Chinese herbal Angelica pubescens maxim. Nanoscale Res Lett. 2017;12:46.
- Huo Y, Singh P, Kim YJ, et al. Biological synthesis of gold and silver chloride nanoparticles by Glycyrrhiza uralensis and in vitro applications. Artif Cells Nanomed Biotechnol. 2018;46:303–312.
- Singh P, Ahn S, Kang JP, et al. In vitro anti-inflammatory activity of spherical silver nanoparticles and monodisperse hexagonal gold nanoparticles by fruit extract of Prunus serrulata: a green synthetic approach. Artif Cells Nanomed Biotechnol. 2017;1–11.
- Singh H, Du J, Yi TH. Green and rapid synthesis of silver nanoparticles using Borago officinalis leaf extract: anticancer and antibacterial activities. Artif Cells Nanomed Biotechnol. 2017;45:1310–1316.
- Balakumaran MD, Ramachandran R, Balashanmugam P, et al. Mycosynthesis of silver and gold nanoparticles: optimization, characterization and antimicrobial activity against human pathogens. Microbiol Res. 2016;182:8–20.
- Elbeshehy EK, Elazzazy AM, Aggelis G. Silver nanoparticles synthesis mediated by new isolates of Bacillus spp., nanoparticle characterization and their activity against Bean Yellow Mosaic Virus and human pathogens. Front Microbiol. 2015;6:453.
- Weerasekera HA, Silvero MJ, Regis Correa da Silva D, et al. A database on the stability of silver and gold nanostructures for applications in biology and biomolecular sciences. Biomater Sci. 2017;5:89–97.
- Petsalo A, Jalonen J, Tolonen A. Identification of flavonoids of Rhodiola rosea by liquid chromatography-tandem mass spectrometry. J Chromatogr A. 2006;1112:224–231.
- Li S, Shen Y, Xie A, et al. Green synthesis of silver nanoparticles using Capsicum annuum L. extract. Green Chem. 2007;9:852.
- Makarov VV, Love AJ, Sinitsyna OV, et al. "Green" nanotechnologies: synthesis of metal nanoparticles using plants. Acta Nat. 2014;6:35–44.
- Islam NU, Amin R, Shahid M, et al. A multi-target therapeutic potential of Prunus domestica gum stabilized nanoparticles exhibited prospective anticancer, antibacterial, urease-inhibition, anti-inflammatory and analgesic properties. BMC Complement Altern Med. 2017;17:276.
- Logaranjan K, Raiza AJ, Gopinath SC, et al. Shape- and size-controlled synthesis of silver nanoparticles using aloe vera plant extract and their antimicrobial activity. Nanoscale Res Lett. 2016;11:520.
- Agnihotri S, Mukherji S, Mukherji S. Size-controlled silver nanoparticles synthesized over the range 5-100 nm using the same protocol and their antibacterial efficacy. RSC Adv. 2014;4:3974–3983.
- Regiel-Futyra A, Kus-Liskiewicz M, Sebastian V, et al. Development of noncytotoxic silver-chitosan nanocomposites for efficient control of biofilm forming microbes. RSC Adv. 2017;7:52398–52413.
- Xiu ZM, Zhang QB, Puppala HL, et al. Negligible particle-specific antibacterial activity of silver nanoparticles. Nano Lett. 2012;12:4271–4275.
- Marambio-Jones C, Hoek EMV. A review of the antibacterial effects of silver nanomaterials and potential implications for human health and the environment. J Nanopart Res. 2010;12:1531–1551.
- de la Fuente-Nunez C, Korolik V, Bains M, et al. Inhibition of bacterial biofilm formation and swarming motility by a small synthetic cationic peptide. Antimicrob Agents Chemother. 2012;56:2696–2704.
- Saleem S, Ahmed B, Khan MS, et al. Inhibition of growth and biofilm formation of clinical bacterial isolates by NiO nanoparticles synthesized from Eucalyptus globulus plants. Microbial Pathogenesis. 2017;111:375–387.