
Abstract
Red blood cells (RBCs) possess intact cyto-architectures while haemoglobin (Hb) is a cell-free, homogeneous solution. Both RBCs and Hb are generalized oxygen carriers. In this paper, kinetic studies on oxygen-releasing of high concentration of Hb and RBCs under various conditions were carried out regarding Hb and RBCs as fluids. Among them, Hb under specific conditions was seen as the simplest Hb-based oxygen carrier (HBOC), Also, factors affecting the oxygen releasing of Hb and RBCs, including osmotic pressure, viscosity and allosteric agent, have been well studied. Analysis of the results from the measurement above showed that kinetics of oxygen releasing of either pure Hb or the simplest HBOCs was obviously different from that of RBCs. The oxygen-releasing time of Hb was shorter and the oxygen-releasing rates of Hb were quicker than those of RBCs under various conditions. Therefore, as fluids, only by changing the milieus it exists in, Hb could not achieve the expected oxygen-releasing effect on the microcirculation so well as RBCs do in the same system, irrespective of the interaction between the fluids and blood vessels. Furthermore, kinetic properties of HBOCs must be considered and matched with those of RBCs in the study of HBOCs.
Introduction
Thermodynamics mainly studies a system in an equilibrium state, and properties of these systems have nothing to do with time [Citation1,Citation2]. Kinetics, by contrast, primarily focuses on systems in non-equilibrium states, and properties of such systems vary over time [Citation3]. It is usually hard to tell which one is better because the two are closely related and complement each other just like wave–particle dualism. Which one is adopted depends on the research method and emphasis.
A physical or chemical process has always been studied based on the standpoints of both kinetics and thermodynamics. It is also the same for studies on oxygen carrying and/or releasing of oxygen carriers (both red blood cells (RBCs) and haemoglobin (Hb) are generalized oxygen carriers). The thermodynamic properties of oxygen carriers are generally characterized with oxygen saturation (SO2) and partial pressure of oxygen (pO2). Instead, kinetic properties of oxygen carriers have remained less-well investigated. But the ultimate aim of studies on oxygen carriers is to obtain the ones that can release oxygen with an appropriate amount of oxygen at a right time in a proper place in the complex vascular system. Obviously, such a case for the target oxygen carriers should not be a thermodynamic equilibrium but a kinetic process. As a result, the thermodynamic parameters, such as SO2 and pO2, cannot give us more help to understand such oxygen carrying and/or releasing of oxygen carriers. As reported [Citation4] in the blood substitute resuscitation experiment, oxyglobin, a Hb-based oxygen carrier (HBOC), unexpectedly had a comparable influence on the shock first aid to Hespan, a nonoxygen carrier. The typical thermodynamic oxygen dissociation curves (ODCs) could hardly give a rational explanation for these phenomena. However, if kinetics of the HBOC is taken into consideration, it is totally different. Due to the short period of oxyglobin-carrying oxygen, a part of the oxygen carried by oxyglobin may have been released before it reached the microcirculation, causing insufficient oxygen supply to the body’s hypoxia tissues. Hence, oxyglobin with oxygen-carrying capacity did not show any superiority over Hespan [Citation5]. It also means that thermodynamic parameters of oxygen carriers should be determined by the corresponding oxygen-carrying and/or -releasing kinetics, not by simply simulating thermodynamic physical parameters.
Up to now, some progress have been made towards the kinetics of oxygen carrying and/or releasing of HBOCs or RBCs. The kinetics of oxygen releasing of oxyhaemoglobin caused by sodium dithionite, in the presence and in the absence of organic cosolvents, was studied by standard stopped-flow techniques. The results indicated that the cosolvents mainly affected the allosteric parameter L, leaving the intrinsic deoxygenation rates of both R and T states almost unaltered (R state refers to the relax state and T state refers to the tense state of Hb) [Citation6]. The oxygen transfer kinetics of RBCs of chicken, duck and turtle Pseudemys scripta elegans as well, using oxygen transfer conductance of RBCs as an evaluation index, was also explored [Citation7,Citation8]. Recently, new kinetic parameters, T50 and E50, have been proposed to present the oxygen-carrying efficiency of Hb (T50 is the time of 50% O2 saturation of Hb and E50 reflects the relationship between T50 and environmental pO2). And the kinetic curves of Hb-carrying oxygen presented “S” shape similar to the typical Hb ODC [Citation5]. T50 may also be used to diagnose blood diseases and as a standard for evaluating blood substitutes [Citation9]. Studies on capacities of RBC-carrying and -releasing oxygen in a typical haemorrhagic shock model showed that, with the aggravation of shock, the kinetic parameters of Tr50 tended to reduce significantly while Tc50 did not change obviously. Tc50 is the time of O2 saturation of RBC raised from 0 to 50%, reflecting the efficiency of RBC-carrying oxygen. Tr50 is the time of O2 saturation of RBC decreased from 100 to 50%, indicating the efficiency of RBC-releasing oxygen. That was to say, the oxygen-carrying capacity of RBCs was stable; however, the oxygen-releasing ability was increased. So the oxygen demand of tissues could not be met which caused multiple organ failure [Citation10]. So far, kinetic investigations on oxygen-carrying and/or -releasing process of HBOCs and RBCs are far from the ultimate aim mentioned above. As a result, further kinetic studies should be urged to explore the very process of HBOCs and RBCs.
On the other hand, when an oxygen carrier is administrated in human bodies, it will act on the vascular systems as a whole. So the subject investigated ought to be regarded as a fluid, not a set of molecules of the oxygen carrier in a kinetic study. Therefore, the factors affecting fluid properties could also have impacts on oxygen carriers, such as osmotic pressure and viscosity.
In the present study, we mainly focus on the variation of pO2 over time and the change of oxygen-releasing rates of RBCs and Hb in the oxygen-releasing process under various conditions. It is obviously a kinetic research. Thus, kinetic studies on the oxygen releasing of high concentration of Hb and RBCs under various conditions were carried out in which both Hb and RBCs were regarded as fluids. Among them, Hb under specific condition was regarded as the simplest HBOC in this paper. Also, the factors affecting the process, including osmotic pressure, viscosity and allosteric agent (phytic acid, PHY), have been well explored by single variable experiments at different levels. Then, both oxygen-releasing curves and oxygen-releasing rate curves were plotted and analysed. According to the test results, the significant difference of oxygen-releasing kinetics between RBCs and Hb (either pure Hb or the simplest HBOCs) was clearly seen. The oxygen-releasing time of Hb was shorter than that of RBCs, and the oxygen-releasing rates of Hb were faster than those of RBCs under various conditions. As fluids, only by changing the milieus it exists in, Hb could not achieve the expected oxygen-releasing effect on the microcirculation so well as RBCs do in the same system, irrespective of the interaction between the fluids and blood vessels.
Materials and methods
Materials
Human umbilical cord blood was presented as a gift from Tianjin Stem Cell Gene Engineering Company (Tianjin, China). Reagents and chemicals were purchased from Aladdin Reagent Co. Ltd. (Shanghai, China). Commercial reagents and chemicals were used without further purification. Reagents used for the preparation of buffers were of analytical grade. Oxygen-releasing apparatus was self-assembled, and the testing subsystem was a HQ30d portable-dissolved oxygen meter (Hach, Loveland, CO).
Preparation of RBCs suspension and purification of Hb from RBCs
Human blood solution was separately washed with an equivalent amount of saline and centrifuged (2000 g, 10 min) three times to yield a concentrated RBC suspension [Citation11]. The preparation of purified Hb from human umbilical cord blood was referred to the methods described by Walder et al. [Citation12] and Qi et al. [Citation13]. The final product in the retentate was collected and stored at −80 °C. The concentration of the purified Hb was determined with SLS–Hb (sodium lauryl sulfate–Hb) method [Citation14].
Measurements of pO2 of RBC-releasing oxygen
PO2 of RBC-releasing oxygen was measured using an oxygen-releasing apparatus () [Citation15], in RBCs suspension at a Hb concentration of 5 g/dL, in physiological saline at 37 °C, pH 7.4. The sample chamber was thermostatted at 37 °C in a shaking water bath. The O2 or N2 gas flew in the sample chamber with fittings for inlet and outlet gas lines. The RBC solution was allowed to be saturated to a pO2 of 160 mm Hg using compressed air for about 50 min. After giving the sample enough time to equilibrate, the gas stream was switched to pure N2 to slowly deoxygenate the sample. The pO2 of the sample was determined with a portable oxygen-dissolving analyser. The oxygen-releasing kinetic curve of RBCs was fitted to a single species characterized by pO2 and the oxygen-releasing time (t). Then, the data of time were taken as derivatives to pO2 (dt/dpO2) to fit the oxygen-releasing rate curve featuring oxygen-releasing rate (dt/dpO2) and pO2. The measurement for each sample was performed in triplicate to obtain the average value of pO2.
Figure 1. Schematic diagram of the oxygen-releasing apparatus.
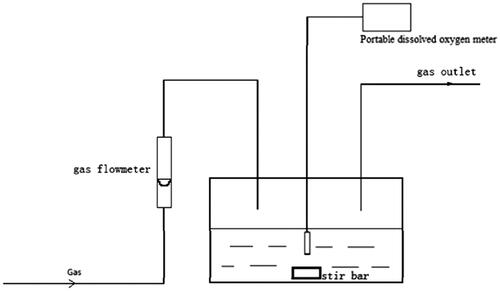
Subsequent pO2 measurements of Hb- or RBC-releasing oxygen under various conditions were performed following similar protocols as that of RBCs above with slight adjustments. Related determination conditions are listed in .
Table 1. General pO2 measurement conditions for Hb- or RBC-releasing oxygen.
Results and discussion
RBCs are usually concentrated ones with an intact cyto-architecture including flexible membranes and contents while Hb is a cell-free, homogeneous protein solution [Citation15].
In general, there are two forms of oxygen existing in a Hb or RBC solution saturated with oxygen: dissolved oxygen and bound oxygen. The dissolved oxygen in the solution is taken away after going through the interface. This will result in the decrease of pO2 of samples in the saturated state. To a certain extent, the oxygen bound with Hb will be released into the solution in the form of dissolved oxygen. As a result, all the data of pO2 acquired in this research are pO2 values of dissolved oxygen in solutions [Citation15].
It is well known that the average pO2 in arteries is in the range of 100–70 mm Hg, pO2 in arterioles 70–40 mm Hg and pO2 in capillaries <40 mm Hg in human body. Therefore, according to the rule above, the oxygen-releasing curves in this research were also divided into three sections to be discussed [Citation16].
Analysis of oxygen releasing of RBCs and Hb
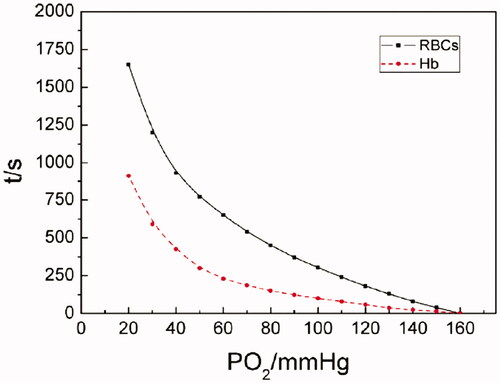
As shown in the oxygen-releasing curves of Hb and RBCs in , about 1600 s was spent for RBCs in decreasing pO2s from 160 (oxygen saturation) to 20 mm Hg. And only 900 s or so for Hb in doing that. When pO2 was >70 mm Hg, fast oxygen-releasing processes were observed for both Hb solution and RBCs. While pO2 was reduced from 70 to 20 mm Hg, slow oxygen-releasing processes were perceived.
Figure 2. The oxygen-releasing curves of Hb and RBCs (pO2 of Hb- or RBC-releasing oxygen was determined at a Hb concentration of 5 g/dL, at 37 °C, pH 7.4, (i) for RBCs in physiological saline; (ii) for Hb in PBS).
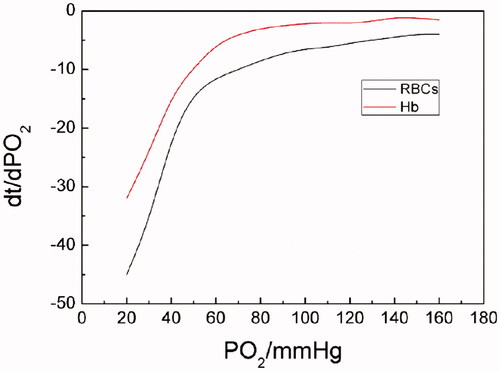
It can be seen from the oxygen-releasing rate curves in that Hb demonstrated higher oxygen-releasing rates than RBCs did during the whole oxygen-releasing process. And both the oxygen-releasing rates of Hb and RBCs presented similar trends in the same range of pO2: oxygen-releasing rates were fast as pO2 was >70 mm Hg; showing an abrupt shift, oxygen-releasing rates were from higher to lower as pO2 was reduced from 70 to 40 mm Hg and relatively low when pO2 was <40 mm Hg.
Figure 3. The oxygen-releasing rate curves of Hb and RBCs (PO2 of Hb- or RBC-releasing oxygen was determined at a Hb concentration of 5 g/dL, at 37 °C, pH 7.4, (i) for RBCs in physiological saline; (ii) for Hb in PBS. Dt/dpO2 in the vertical axis referred to the oxygen-releasing rate obtained by taking derivatives of time to pO2).
The difference of oxygen-releasing rates for Hb and RBCs mainly results from their different structures and the complexity of oxygen-releasing processes. As we know, concentrated RBCs possess an intact cyto-architecture including flexible membranes while Hb is a cell-free, homogeneous protein solution. The delivery of oxygen of Hb in RBCs is a concerted process. First of all, the outer membrane of RBCs is a main barrier for oxygen in or out. Also factors, such as the mechanical properties of blood vessels, haemorheological properties, viscosity, concentration, osmotic pressure, salt content of blood and so on, may complex the oxygen-carrying and/or -releasing process of RBCs. All these factors above may result in lower oxygen-releasing rates of RBCs. In the case of cell-free Hb solution, a homogeneous solution, it is naked in the surrounding environment without extra protection. The relatively simple structure of Hb leads to an easy oxygen-releasing process. As a result, cell-free Hb solution demonstrated higher oxygen-releasing rates than RBCs did.
Effect of different concentrations of PHY solutions on oxygen releasing of Hb
The time it took for the whole oxygen-releasing process of Hb varied with different concentrations of PHY. When the concentration of PHY is 12 mM, the time was about 1200 s. When the concentration of PHY is 3 mM, it was more time-consuming with the time of 1400 s or so. As the system lacked PHY, the time was 1600 s or so.
As can be seen from oxygen-releasing curves of Hb in different concentrations of PHY in , in the absence of PHY, pO2 of oxygen releasing of Hb plummeted in the range of 160–70 mm Hg firstly and about 200 s was needed. Then, pO2 decreased gradually from 70 mm Hg to the bottom of 20 mm Hg and about 1300 s was consumed. And both segments of the oxygen-releasing curves of Hb in the presence of PHY showed linear in the range of 160–40 and 40–20 mm Hg. It was indicated from oxygen-releasing rate curves in that the oxygen-releasing rate for each sample in different concentration of PHY was comparable when pO2 was >40 mm Hg. This was in accordance with the oxygen-releasing course of artery and arteriole in the human body. However, the oxygen-releasing rate for each sample improved as the concentration of PHY increased when pO2 was <40 mm Hg. It was corresponding to the oxygen-releasing process of capillaries in the human body.
Figure 4. The pO2–time oxygen-releasing curves of Hb in different concentrations (PO2 of Hb releasing oxygen was measured in 0, 3, 6, 9 and 12 mmol/L of PHY solutions, at a Hb concentration of 5 g/dL at 37 °C, pH 7.4).
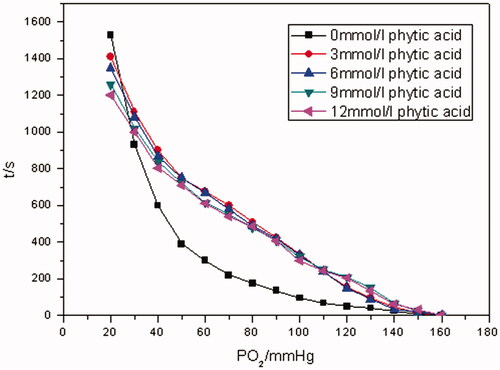
Figure 5. The oxygen-releasing rate curves of Hb in different concentrations of PHY solution (PO2 of Hb-releasing oxygen was measured in 0, 3, 6, 9 and 12 mmol/L of PHY solutions, respectively, at a Hb concentration of 5 g/dL at 37 °C, pH 7.4. Dt/dpO2 in the vertical axis referred to the oxygen-releasing rate obtained by taking derivatives of time to pO2).
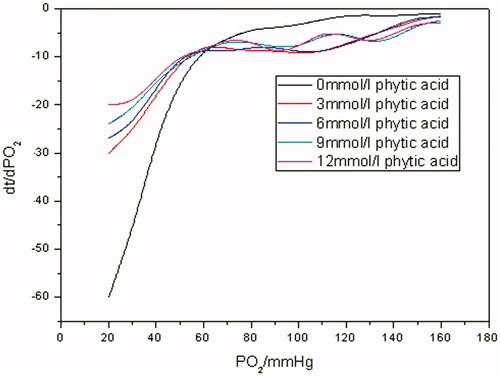
As is known to all, PHY is an allosteric effector with a similar mechanism as the natural allosteric modulator, 2, 3-diphosphoglycerate (2, 3-DPG). It can also significantly reduce the oxygen affinity of Hb. Just as seen from , when pO2 was in the range of 160–140 mm Hg, Hb was in a saturated state. All of the oxygen released into Hb solutions was dissolved oxygen, no matter whether the samples contained PHY or not. So oxygen-releasing rates for all the samples showed no significant differences as exhibited in . However, as pO2 went down to some extent, oxygen bound with Hb in the samples with PHY was released continuously into solutions to replenish the dissolved oxygen with the help of PHY when pO2 was in the range of 140–40 mm Hg. As a result, pO2 of the samples with PHY decreased more slowly than that of the control without PHY. And similar trends in the corresponding oxygen-releasing rates were observed as well. When pO2 was <40 mm Hg, less-bound oxygen remained in samples with PHY solutions while much more was left in the control. So less time was consumed for the former releasing oxygen than the latter one. Therefore, as indicated in , ending with the same pO2 of 20 mm Hg, the oxygen-releasing rates of samples with PHY were faster than that of the control of Hb.
Effect of different osmotic pressures on oxygen releasing of RBCs
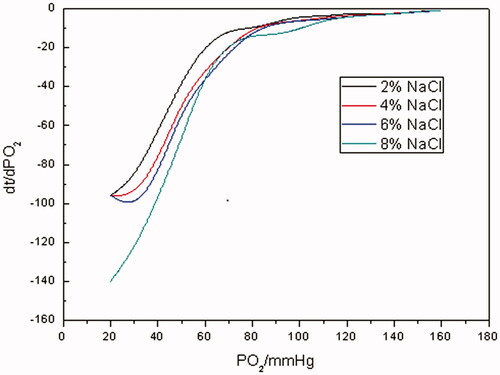
As indicated from oxygen-releasing curves in , the higher the concentration of NaCl solution was, in other words, the higher the osmotic pressure was, the more the time spent in reducing pO2 of RBC suspensions from 160 to 20 mm Hg was. When the concentration of NaCl solution was in mass fraction of 2%, the time spent in decreasing pO2 of RBCs suspensions from 160 to 20 mm Hg was about 3000 s, when the concentration was 8%, the time was 4600 s or so. During the whole oxygen-releasing process, it took RBCs about 500 s to reduce pO2 from 160 to 70 mm Hg, and a prompt oxygen-releasing process was observed. Much more time was consumed when pO2 varied from 70 to 20 mm Hg. It can be seen from oxygen-releasing rate curves in that oxygen-releasing rates for RBCs under different osmotic pressures were much closer to each other when pO2 was >70 mm Hg. Instead, oxygen-releasing rates decreased as osmotic pressures increased when pO2 was <70 mm Hg.
Figure 6. The pO2–time oxygen-releasing curves of RBCs under different osmotic pressures (PO2 of RBC-releasing oxygen was measured in mass fraction 2, 4, 6 and 8% of sodium chloride solution, respectively, at a Hb concentration of 5 g/dL at 37 °C, pH 7.4).
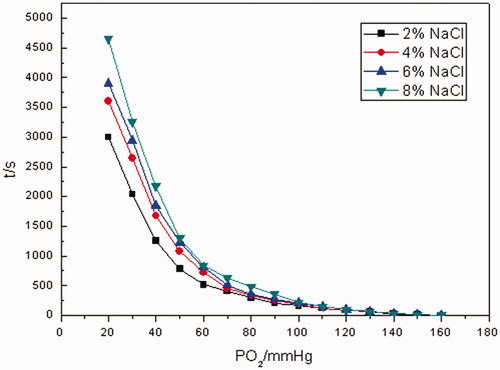
Figure 7. The oxygen-releasing rate curves of RBCs under different osmotic pressures (PO2 of RBC-releasing oxygen was measured in mass fraction 2, 4, 6 and 8% of sodium chloride solution, respectively, at a Hb concentration of 5 g/dL at 37 °C, pH 7.4. Dt/dpO2 in the vertical axis referred to the oxygen-releasing rate obtained by taking derivatives of time to pO2).
It is well known that RBCs have complete cyto-architectures and they can maintain a normal cellular morphology and physiological function in an isosmotic solution. Nevertheless, once RBCs are exposed in hypertonic solution, intra-erythrocyte water will penetrate the cell membrane into the media which results in the loss of intraglobular water, the increase in the concentration of Hb and the raising of viscosity of the cytoplasm. This eventually results in a decrease in diffusion coefficient of oxygen in the erythrocyte and the shrinking of oxygen-releasing rate of erythrocyte. This might be another mechanism for hypertonic saline to improve the microcirculation in haemorrhagic shock besides increasing blood volume and relieving vascular edema.
Effect of different viscosity levels on oxygen releasing of Hb and RBCs
The pO2–time oxygen-releasing curves of Hb and RBCs with different viscosities are shown in and Citation10, respectively. The oxygen-releasing rate curves of Hb and RBCs with different viscosities are exhibited in and Citation11, separately.
Figure 8. The pO2–time oxygen-releasing curves of Hb with different viscosities (PO2 of Hb-releasing oxygen was measured at different viscosity levels of 200, 500, 800, 1100 mPa•s, respectively, at a Hb concentration of 5 g/dL at 37 °C, pH 7.4).
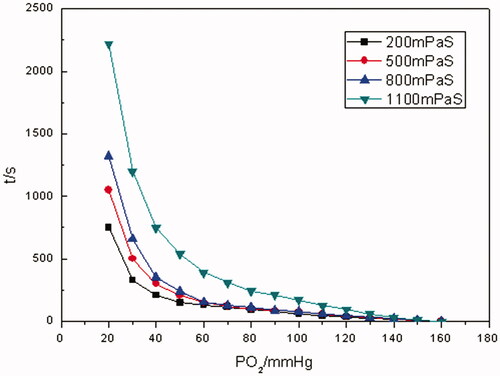
Figure 9. The oxygen-releasing rate curves of Hb with different viscosities (PO2 of Hb-releasing oxygen was measured at different viscosity levels of 200, 500, 800, 1100 mPa•s, respectively, at a Hb concentration of 5 g/dL at 37 °C, pH 7.4. Dt/dpO2 in the vertical axis referred to the oxygen-releasing rate obtained by taking derivatives of time to pO2).
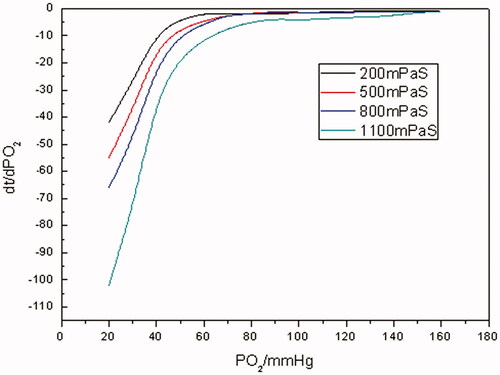
Figure 10. The pO2–time oxygen-releasing curves of RBCs with different viscosities (PO2 of RBC-releasing oxygen was measured at different viscosity levels of 200, 500, 800, 1100 mPa•s, respectively, at a Hb concentration of 5 g/dL at 37 °C, pH 7.4).
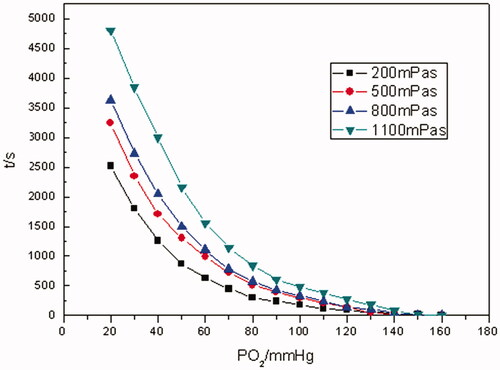
As illustrated in and Citation10, the time for the whole oxygen-releasing process prolonged with the increase in the viscosity of media for both Hb and RBCs. For example, it took Hb about 750 s to reduce pO2 from saturation state to 20 mm Hg with 200 mPa• s of viscosity, whereas 2200 s with 1100 mPa•s of viscosity. In the case of RBCs, the time for the very situations above was about 2500 and 4700 s, separately. By contrast, even with the highest viscosity of 1100 mPa•s, the oxygen-releasing time of Hb was shorter than that of RBCs at any level of viscosity. When pO2 was in the range of 160–70 mm Hg, rapid oxygen-releasing processes for both Hb and RBCs were noticed. This was in accordance with oxygen-releasing process in the main arteries in human body. When pO2 was in the range of 70–40 mm Hg, a longer period of time for oxygen releasing was consumed. It was in line with the oxygen releasing in arterioles. As pO2 was <40 mm Hg, the oxygen-releasing time was much longer and pO2 decreased more slowly, which presented the characteristic of oxygen releasing in capillaries in human body.
As evinced from and Citation11, in terms of Hb and RBCs, the higher the viscosities were, the lower the oxygen-releasing rates were. It was manifested from that when pO2 was >70 mm Hg, the oxygen-releasing rates of Hb were higher and close to each other with different viscosities. As pO2 was in the range of 70–40 mm Hg, the oxygen-releasing rates of Hb demonstrated an abrupt shift from fast to slow. And even much slower when pO2 was <40 mm Hg for Hb. It was revealed in that as far as RBCs were concerned, as pO2 was >70 mm Hg, the oxygen-releasing rates were higher. As pO2 <70 mm Hg, the oxygen-releasing rates of RBCs lessened bit by bit. Comparing with , it was clear that oxygen-releasing rates of RBCs were much lower than those of Hb with the same viscosity during the whole oxygen-releasing process.
Figure 11. The oxygen-releasing rate curves of RBCs with different viscosities (PO2 of RBC-releasing oxygen was measured at different viscosity levels of 200, 500, 800, 1100 mPa•s, respectively, at a Hb concentration of 5 g/dL at 37 °C, pH 7.4. Dt/dpO2 in the vertical axis referred to the oxygen-releasing rate obtained by taking derivatives of time to pO2).
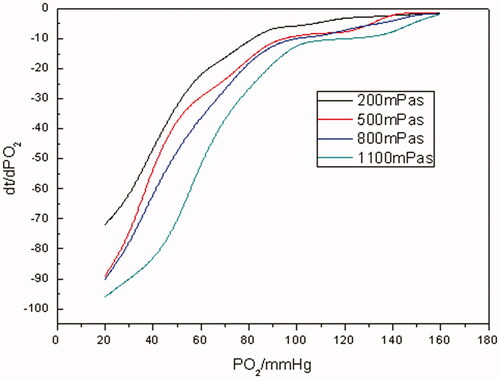
As we all know, RBCs have an intact cyto-architecture including flexible membranes and contents while Hb is a cell-free, homogeneous protein solution. And the slowness of the oxygen-releasing rates of RBCs with various viscosities could be ascribed to the combined effect of the cellular membrane of RBCs and the viscosity of the media they existed in. As to Hb solution, the oxygen-releasing rates was slowed down with the increase in the viscosity mainly because the diffusion coefficient of oxygen was decreased in the media correspondingly. But even if the viscosity of Hb solution was increased to 1100 mPa• s, its oxygen-releasing rates were faster than those of RBC suspensions. Therefore, it was difficult for Hb solution to aptly mimic the oxygen releasing of RBCs by simply improving the viscosity of Hb solution.
Conclusions
In conclusion, kinetic studies on oxygen releasing of high concentration of Hb and RBCs under various conditions showed that the kinetics of oxygen releasing of either pure Hb solution or the simplest HBOCs was greatly different from that of RBCs. The oxygen-releasing time of Hb is shorter than that of RBCs under various conditions. Furthermore, the oxygen-releasing rates of Hb are quicker than those of RBCs as well. The kinetic difference of Hb- and RBC-releasing oxygen mainly results from their structural imparities: the former is cell-free and homogeneous while the latter have complete cyto-architectures. Hence, as fluids, only through changing the media it is in, Hb could not achieve the expected oxygen-releasing effect on the microcirculation so well as RBCs do in the same system, irrespective of the interaction between the fluids and blood vessels. Therefore, kinetic properties of HBOCs must be considered and matched with those of RBCs in the study of HBOCs. Only by starting from this foothold could HBOCs be alternatives to RBCs.
Acknowledgements
The authors thank the National Students’ Training Program for Innovation and Entrepreneurship [No. 201510058026 and No. 201710058057].
Disclosure statement
The authors report no declarations of interest. The authors alone are responsible for the content and writing of this paper.
References
- Smith JM, Ness HCV, Abbott MM. Introduction to chemical engineering thermodynamics. New York (NY): McGraw-Hill; 1975.
- Haynie DT. Biological thermodynamics. Cambridge, UK: Cambridge University Press; 2001.
- Lifshitz EM, Pitaevskii LP, Sykes JB, et al. Physical kinetics. Oxford, UK: Butterworth-Heinemann; 1981.
- Cheung ATW, Driessen B, Jahr JS, et al. Blood substitute resuscitation as a treatment modality for moderate hypovolemia. Artif Cells Blood Subs Immob Biotech. 2004;32:189–207.
- Jiang C, Wang X, Gao W, et al. Kinetics of hemoglobin carrying and releasing oxygen. Acta Phys Sin-CH ED. 2008;60: 83–89.
- Cordone L, Cupane A, Fornili SL. Conformational and functional properties of hemoglobin in perturbed solvent: kinetics of O2 release. Biopolymers. 1983;22:1677–1696.
- Yamaguchi K, Glass ML, Scheid P, et al. Oxygen transfer kinetics of red blood cells of the turtle Pseudemys scripta elegans. Respir Physiol. 1989;75:371–384.
- Nguyen Phu D, Yamaguchi K, Glass ML, et al. Kinetics of oxygen uptake and release by red blood cells of chicken and duck. J Exp Biol. 1986;125:15–27.
- Peng W, Wang X, Gao W, et al. In vitro kinetics of oxygen transport in erythrocyte suspension or unmodified hemoglobin solution from human and other animals. Can J Physiol Pharmacol. 2011;89:631–637.
- Lan K, Wang X. Kinetics of carrying and releasing oxygen of red blood cells in hemorrhagic shock. J Biomed Eng. 2012;29:701–704.
- Sakai H, Takeoka S, Yokohama H, et al. Purification of concentrated hemoglobin using organic solvent and heat treatment. Protein Expres Purif. 1993;4:563–569.
- Walder RY, Andracki ME, Walder JA. Preparation of intramolecularly cross-linked hemoglobins. Meth Enzymol. 1994;231:274.
- Qi D, Li Q, Wang P, et al. Haemoglobin site-specifically modified with ferulic acid to suppress the autoxidation. Artif Cells Nanomed Biotechnol. 2017;45:1077–1081.
- Oshiro I, Takenaka T, Maeda J. New method for hemoglobin determination by using sodium lauryl sulfate (SLS). Clin Biochem. 1982;15:83.
- Wang X, Gao W, Peng W, et al. Biorheological properties of reconstructed erythrocytes and its function of carrying-releasing oxygen. Artif Cells Blood Subs Immob Biotech. 2009;37:41.
- Winslow RM. Blood substitutes. London, UK: Academic Press; 2006.