
Abstract
We used cell-free culture filtrate of Pseudomonas aeruginosa as a reducing mediator of AgNO3 to silvernanoparticles (AgNPs) and possibly used as a potential anticancer agent against thyroid cancer cells (TPC1). The bio-generation of AgNPs was firmly established by taking a UV spectrum at 380–500 nm wavelength. The Fourier transform spectrum analysis reveals the association of alcohol, phenol and aromatic functional groups with P. aeruginosa synthesized AgNPs (Ps-AgNPs). By observing under transmission electron microscopy (TEM), the size and structure of the Ps-AgNPs were characterized as the size was 30–70 nm and spherical in shape. The concentration-dependent cytotoxicity of Ps-AgNPs on TPC1 cells was observed and IC50 value was calculated. The alteration of oxidative and antioxidant biomarkers in Ps-AgNPs treated cells were observed. The induced apoptosis was determined by staining the Ps-AgNPs treated cells with DCFH-DA, Rh-123 dye, Acridine Orange (AO) and ethidium bromide (EtBr). Increased level of intracellular reactive oxygen species (ROS) generation and decreased level of mitochondrial membrane potential was observed in Ps-AgNPs treated TPC1 cells. Moreover, the apoptotic morphological changes were explored, which indicates increased apoptosis by inducing cell membrane damage in Ps-AgNPs treated cells. This biogenic approach will enable an effective and significant improvement in nano-oncotherapy.
Introduction
Nanoparticles synthesis is an important aspect in nanotechnology that has attained growing curious in nano-medicine technology as a result of their potential application in chemotherapies. AgNPs are broadly used in numerous fields like health care, biomedical, food and industrial purposes [Citation1,Citation2]. Nanotechnology tools provide an effective approach against cancers to overcome biological barriers to directly deliver therapeutic drugs [Citation3]. The unique physicochemical properties metallic nanoparticles such as broad optical properties, high surface–volume ratio, ease of synthesis and surface functionalization provide new insights in chemotherapeutics.
Usually, the processes involved in AgNPs synthesis has detailed so far related to the high energy consumption and involvement of hazardous toxic chemicals. The pure biological molecules (like peptide and enzymes) aided AgNPs synthesis has been used successfully around the world [Citation4–6]. This biomolecule approach in nanotechnology has a greater attraction in the field of nanoparticle aided chemotherapies. However, the green reactants approach for AgNPs synthesis based on algal and plant extracts significantly gained great interest due to its biocompatibility, eco-friendliness and benignancy. These appealing features are essential in medical applications. The other advantages of green synthesis include the well-defined and controlled size of the nanoparticles. They are devoid of contaminants and the process is easy to scale-up [Citation7]. Moreover, microorganisms including bacteria, yeast and fungi are being swiftly subjugated as nano-factories in generating numerous nanomaterials [Citation8,Citation9].
The synthesis of nanomaterial by means of the microbial process provides an extensive variety of green and environmentally desirable technique; low-fee production and much less time required [Citation10]. Therefore, the yield effective, harmless, consistent, clean and environmentally friendly methods have required for the preparation of the nanoparticles. The microorganism for the production of silver nanoparticles (AgNPs) displays great interest in the formation of AgNPs because of its resistant potential to the metals. Synthesis of nanoparticles using cell filtrate could be efficient than the intracellular synthesis [Citation11]. The microbial growth medium contains peptone, yeast extract, dextrose and other important growth factors, some of which may have potential reducing and stabilizing ability as stated in previous reports [Citation12].
For AgNP synthesis, the microbial culture media was aspirated along with remaining microbial biomass after the complete growth of microorganisms. Either with or without the microbial biomass, the silver salt was added into the aspirated growth media. A specific set of enzymes(s) that are secreted by particular microorganisms are consequential elements to define the biosynthesis of nanoparticles, but the main factors for the formation of nanoparticles are not yet clear [Citation13]. Several anticancer drugs were ineffectual to reach their goal due to insufficient concentrations and capably employ the pharmacological consequence without giving harmfulness to healthy tissues and cells [Citation14,Citation15]. Biosynthesized AgNPs, either it was generated by intra- or extracellular mechanisms have been effectively examined as a result of its potent antimicrobial ability against various microbial pathogens [Citation16–18] and cytotoxic nature against various cancer cells [Citation19].
Thyroid cancer is the most common endocrine malignancies among the other cancers. The incidence rate of thyroid cancer has stably increased over the past decade, which considered as one of the causes of death [Citation20]. Papillary thyroid cancer (PTC) is the major histological type which accounts for approximately 80% of human thyroid cancers [Citation21]. The prognosis of PTC has been proven to rely on several well-established clinicopathologic indicators [Citation22]. In this study, we assessed the anticancer potential of Pseudomonas aeruginosa generated AgNPs against thyroid cancer cells (TPC1) and then revealed its oxidative stress-induced apoptosis.
Materials and methods
Biosynthesis of AgNPs
For biosynthesis of AgNPs, Pseudomonas aeruginosa bacterial strain was periodically cultured and maintained in Nutrient Agar (NA) slants. From 48 h old P. aeruginosa culture, one loop full of inoculum was thoroughly suspended in 5 ml of double-distilled water then the suspension was transferred directly to flask containing 45 ml of MGYP (malt extract 3 g, glucose 10 g, yeast extract 3 g and peptone 5 g in 1 l of distilled water and pH 7) broth medium, then the cells were subsequently grown for 48 h in orbital shaking incubator (200 rpm) at 27 °C. For AgNPs synthesis, the cell pellet was harvested by centrifuging the culture broth for 5 min at 6000 rpm and then eroded using 50 mM phosphate buffer (pH 7). The obtained cell pellet was thoroughly suspended in double distilled water then incubated in an orbital shaker at 200 rpm for 24 h. After incubation, the cell-free supernatant was obtained by centrifuging at 7500 rpm for 10 min. Finally, 5 ml of 1 mM AgNO3 solution was transferred to 100 ml flask having 50 ml of collected cell-free culture supernatant, and then the conical flask was effectively cultured at 27 °C in an orbital shaker at 200 rpm for 20 min [Citation23].
Evaluation of maximum AgNPs synthesis
In order to evaluate the maximum synthesis of nanoparticle at different incubation period (1 h, 24 h, 7 days and 15 days), totally four reactions (cell-free culture supernatant and AgNO3) were prepared as described above. The absorption spectral readings of reactants were recorded by ultra violet–visible (UV–vis) spectrophotometer with 0.72 nm resolution (Shimadzu, Kyoto, Japan, UV Pharma spec 1700) from 300 to 800 nm.
Characterization of biosynthesized Ps-AgNPs
The size and structural features of the biosynthesized P. aeruginosa synthesized AgNPs (Ps-AgNPs) were characterized by transmission electron microscopy (TEM, JEOL-JEM-2010, Tokyo, Japan). The crystalline nature of the Ps-AgNPs was examined by X-ray diffraction analyzer (D/Max 2005, Rigaku, Tokyo, Japan). In order to explore the surface functional groups associated with synthesized AgNPs, the Ps-AgNPs subjected to Fourier transform infrared spectrophotometer analysis (FT-IR; Shimadzu 8201PC, Kyoto, Japan).
Cancer cell culture
The thyroid cancer cells (TPC1) were inoculated in 10% foetal bovine serum and 1% antibiotics (penicillin, streptomycin, and amphotericin) supplied Dulbecco’s modified Eagle’s medium (DMEM), incubated at 37 °C in a moistened atmosphere provided with 5% CO2 and 95% air incubation. Ps-AgNPs were completely dissolved in 1% DMSO prior treatment with cell.
Cytotoxicity of Ps-AgNPs against TPC1 cells
The cytotoxicity of Ps-AgNPs was evaluated by employing 3-(4,5-dimethylthiazol-2-yl)-2,5-diphenyltetrazolium bromide (MTT) assay based on the reduction of MTT by the action of mitochondrial reductase enzyme which presents in viable cells. The amount of reduction of MTT to formazan in Ps-AgNPs treated and untreated cells were directly proportional to the number of viable cells, it was assessed by taking absorbance values by dissolving the formazan with DMSO. In brief, 1 × 10⁵ cells were plated into 96-well plates and incubated for 24 h at 37 °C in a humidified condition. After complete incubation, the old medium was aspirated without disturbing cells then the cells were treated with different concentrations (5, 10, 20, 30, 40, 50, 60, 70 and 80 µg/ml) of Ps-AgNPs dissolved DMEM, the plate was kept in same incubation condition. After incubation, 100 µl of MTT reagent (5 mg/ml in PBS) was subsequently added into each well further, the plates were incubated for 24 h at 37 °C. The resulting formazan was dissolved by adding 100 µl of DMSO and the absorbance of the reactant solution was recorded at 595 nm wavelength using a multiwell plate reader (Tecan Multimode Reader, Grödig, Austria). The concentrations of the test sample which showed 50% of cell death were then calculated [Citation23].
Biochemical assays
The TPC1 cells were harvested after treatment of biosynthesized Ps-AgNPs (25, 50 and 75 µg) and subsequently subjected to biochemical assessments. The levels of lipid peroxidation in Ps-AgNPs treated cells were estimated by measuring LPO (lipid peroxide) byproduct of TBARS (thiobarbituric acid) reactive substance by the method described by Okhawa et al. [Citation24], and the activities of enzymatic antioxidants such as superoxide dismutase (SOD) [Citation25], catalase (CAT) [Citation26], the intracellular enzyme of reduced glutathione (GPx) level [Citation27] were measured. The untreated well was employed as a control for all assays, respectively.
Measurement of intracellular ROS generation
Intracellular reactive oxygen species (ROS) production in Ps-AgNPs treated and untreated TPC1 cells were estimated by non-fluorescent probe DCFH-DA that can easily enter into the intracellular cell matrix, there it was oxidized into fluorescent dichlorofluorescein (DCF) by the action of produced ROS. Accordingly, the fluorescence strength was relatively proportional to the level of ROS production [Citation28]. The TPC1 cells were inoculated (1 × 10⁶ cells/well) into six-well plate, treated with different concentrations (25, 50 and 75 µg) of Ps-AgNPs and placed in CO2 (5%) incubator for 24 h. After incubation, cells were exposed to 100 µl of DCFH-DA for 10 min at 37 °C. Fluorescence depth was estimated with excitation and emission filters set at 485 and 530 nm, respectively (Shimadzu RF-5301 PC spectrofluorometer, Kyoto, Japan). The results showed an increased percentage of fluorescence depth.
Determination of mitochondrial membrane potential
The mitochondrial membrane potential (MMP) of treated and untreated TPC1 cells was estimated by staining the cells with Rhodamine-123 (Rh-123), lipophilic cationic dye [Citation29]. The cells (3 × 10⁴ cells/well) were cultured in six wells plate and treated with various concentrations of Ps-AgNPs (25, 50 and 75 µg) for 24 h. Then, Rh-123 fluorescent dye was added to treated and untreated cells and left for 30 min. The MMP was qualitatively examined under a FLoid cell imaging station (Invitrogen, Carlsbad, CA, USA). Subsequently, the cells were harvested by trypsinization of cells and the fluorescence strength was estimated at 485/530 nm wavelength under spectrofluorometer (Shimadzu, Columbia, MD, USA). The results were compared with positive control which maintained without treatment.
Determination of apoptotic morphological changes
Staining the treated and untreated TPC1 cells with Acridine Orange (AO) and ethidium bromide (EtBr) dye was used to determine the apoptotic cells morphological changes by Ps-AgNPs [Citation30]. The cells were cultivated in six-well plate (3 × 10⁴ cells/well) and treated with Ps-AgNPs at various dosage ranges (25, 50 and 75 µg) for 24 h. The cells were fixed in methanol:glacial acetic acid (3:1) for 30 min at 4 °C. The cells were stained with AO/EtBr (1:1 ratio) and left for 30 min after washing cells with PBS. The stained cells were consequently washed again with PBS and observed under a FLoid cell imaging station (Invitrogen, Carlsbad, CA, USA). The apoptosis was assessed by counting the cells showing apoptosis features in the total number of cells observed in the microscopic field.
Statistical analyses
All experiments were conducted in three independent replicated and the results were stated as the mean ± standard deviation (mean ± SD) analyzing by one-way analysis of variance (ANOVA) between the obtained values. Values of p < .05 indicated the significant differences in data.
Results
Biosynthesis of AgNPs
The biogenic generation of AgNPs by the cell-free extract of P. aeruginosa was initially confirmed by visual observation as shown in . It was noticed that the no colour changes in AgNO3 solution alone, which indicates that no convention of AgNPs. The colour change from pale yellow to brown was noticed in a flask containing the culture filtrate and AgNO3, which denoted that the reduction of AgNO3 to AgNPs. The colour change to dark brown was observed in extend incubation period up to 6 h.
Figure 1. (A) Visual observations of colour change from fine yellow to reddish brown; indicates the reduction of AgNO3 into silver nanoparticles. (B) UV–visible spectrum of biosynthesized silver nanoparticle at different time intervals (1 h, 24 h, 7 days and 15 days) at 380–500 nm. The increased spectrum at 420 nm explores synthesize of silver nanoparticle.
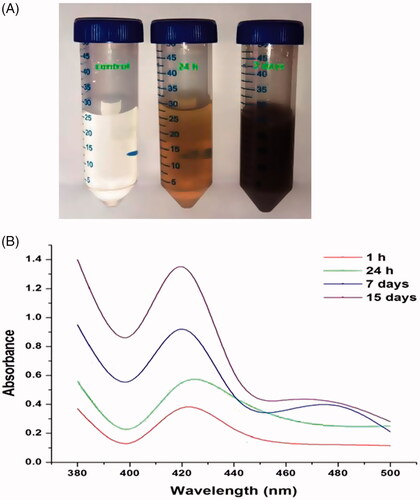
Further, the Ps-AgNPs synthesis was investigated by taking spectral readings by UV–vis spectrophotometer at 380–500 nm wavelength. shows the UV–visible readings of AgNPs synthesized at various time intervals (1 h, 24 h, 7 days and 15 days) after added silver nitrate to cell filtrate resulted in the increasing spectrum of absorption at around 420 nm. The absorption spectrum of Ps-AgNPs displayed a greater wide peak at 420 nm and allocated to surface plasmon resonance of the Ps-AgNPs. Moreover, the increased spectrum at 420 nm was observed an extended incubation period.
Characterization of Ps-AgNPs
TEM
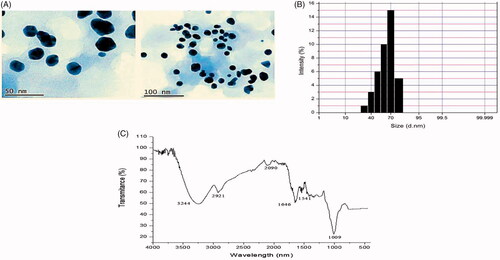
A TEM examination provides a better understanding of the size and structural features of the Ps-AgNPs. The TEM images at various magnifications ranges are depicted in , which shows the shape and size of the bio-generated Ps-AgNPs. It revealed that the Ps-AgNPs sphere-shaped and the size were ranged from 30 to 75 nm. As shown in , the average size of synthesized Ps-AgNPs was 70 mm and has 15.1% of occurrence.
Figure 2. (A) Transmission electron microscopy (TEM) examination images provide the size and morphological characteristics of Ps-AgNPs. (B) Dynamic light scattering measurements show particle size distribution of synthesized Ps-AgNPs. (C) FTIR spectral analyses of various functional groups responsible for the reduction of silver nitrate into silver nanoparticles.
Fourier transform infra-red (FTIR) spectroscopy analyses
In order to analyze the numerous functional groups accountable for the reduction of silver nitrate to AgNPs, the FTIR spectrum patterns were taken and subsequently interpreted. As shown in , the spectrum depicts the number of peaks that were located at 3244, 2921, 2090, 1646, 1541 and 1009 cm−1. The band arising at 3244 cm−1 in the spectrum resembles O–H stretching representing the occurrence of alcohol and phenol groups. A band at 2921 cm−1 region was assigned for C–H stretching of an aromatic compound. The peak at 2090 cm−1 region was arising from N=C=S stretching of isothiocyanate. A peak raised at 1646 cm−1 resembles C=C stretching of the conjugated alkene. A band at 1541 cm−1 assigned for strong N–O stretching of the nitro compound and the band at 1009 cm−1 strong C–F stretching of fluoro compound.
X-ray diffraction analyses
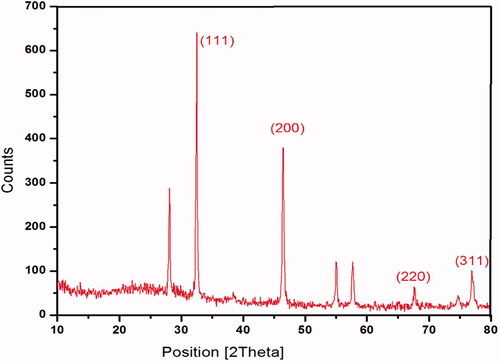
shows the XRD analysis established the crystal-like nature of Ps-AgNPs, that depicts peaks at 2θ values of four distinct diffraction peaks at 33.28°, 46.38°, 67.54° and 77.64° corresponding to XRD planes of (111), (200), (220), (311). Bragg’s reflection based on the structure of AgNPs which can be indexed consistent with the facets of face-centred spherical crystal nature of silver.
Figure 3. XRD analysis confirmed the crystalline nature of Ps-AgNPs.
Cytotoxicity of Ps-AgNPs on TPC1 cells
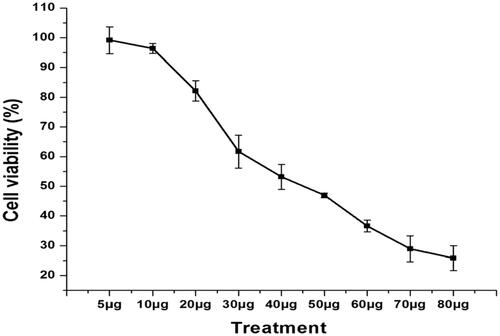
shows the cytotoxic efficacy of Ps-AgNPs on TPC1 cells was evaluated and carefully interpreted. The results showed that the concentration established inhibition of cell proliferation was observed. The 50% growth inhibition (IC50) was calculated as 48.57 µg/ml of Ps-AgNPs. Hence, we selected the dose range of 25, 50 and 75 µg for further experiment.
Figure 4. The cytotoxic effect of Ps-AgNPs on TPC1 cells assessed by MTT assay. The statistical analysis was carried out using one way ANOVA. Values are represented as mean ± SD of three experiments. p<.05 was significantly different from the control sample.
Effect of Ps-AgNPs on lipid-peroxidation and antioxidant status in TPC1 cells
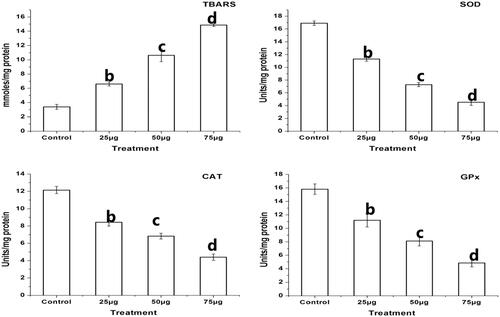
reveals the levels of lipid peroxidative marker (TBARS) and ranges of antioxidant enzymes (SOD, CAT and GPx) in Ps-AgNPs treated TPC1 cells in concentration established way. The treatment with 25, 50 and 75 µg of Ps-AgNPs corresponds with the TBARS values of 6.60 ± 0.28, 10.62 ± 0.88 and 14.85 ± 0.20 mM/mg protein, respectively. The untreated control corresponds with the TBARS value of 3.38 ± 0.35 mM/mg protein. It denoted that the level of TBARS was significantly increased in concentration established way in TPC1 cells after treating with Ps-AgNPs (25, 50 and 75 µg). However, Ps-AgNPs (25, 50 and 75 µg) treatment on TPC1 cells shows decreased levels of SOD, CAT and GPx in concentration established way. The treatment with 25, 50 and 75 µg of Ps-AgNPs corresponds with the SOD values of 11.29 ± 0.32, 7.27 ± 0.32 and 4.51 ± 0.49 units/mg protein, respectively. The untreated control showed the SOD level of 16.90 ± 0.35 units/mg protein. The mean CAT values were recorded as 8.43 ± 0.44, 6.82 ± 0.33 and 4.39 ± 0.36 units/mg protein, respectively, and 12.13 ± 0.39 units/mg protein in untreated control. The treatment with 25, 50 and 75 µg of Ps-AgNPs correspond with the GPx values of 11.20 ± 1.01, 8.10 ± 0.72 and 4.84 ± 0.58 units/mg protein, respectively, and in untreated control cells, the GPx level was recorded as 15.80 ± 0.77 units/mg protein.
Figure 5. Effect of Ps-AgNPs induced lipid peroxidation and modulate cellular antioxidant status in TPC1 cells. Bars represent the increased TBARS and changes in the activities of SOD, CAT and GPx in Ps-AgNPs (25, 50 and 75 µg) treated TPC1 cells. Values are represented as mean ± SD of three experiments. The b,c,d superscripts indicate significant difference from control (p < .05).
Effect of Ps-AgNPs on intracellular ROS production in TPC1 cells
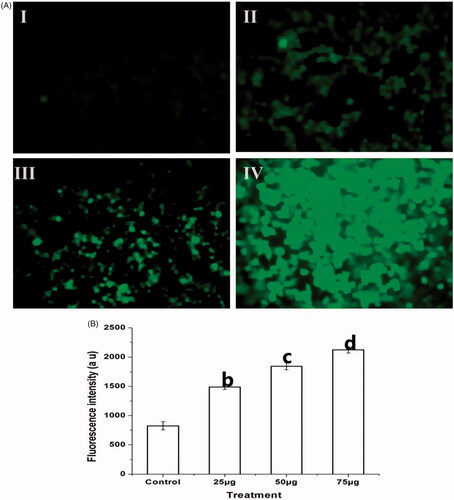
The ROS generation in TPC1 cells was estimated by exposing the cells with DCFH-DA non-fluorescent probe. explores the amounts of ROS production in untreated (I) and cells treated (II–IV) with different concentrations of Ps-AgNPs. The observation reveals that the concentration dependent increase of green fluorescence in Ps-AgNPs treated cells, denotes the increased intracellular ROS levels which induced by Ps-AgNPs in concentration established way. illustrates the graphical representation of intracellular ROS production in control and Ps-AgNPs treated TPC1.
Figure 6. Ps-AgNPs induced intracellular ROS generation in TPC1 cells was evaluated by DCFH-DA staining. (A) Fluorescence images show the control (I) and Ps-AgNPs treated (II–IV) TPC1 cells. The images were acquired by floid cell imaging station. (B) The graphical presentation of intracellular ROS production was detected by spectrofluorometer. All experiments were performed in triplicate and all the values were expressed as mean ± standard deviation of three replicates. The b,c,d superscripts indicate significant difference from control (p<.05).
Effect of Ps-AgNPs on mitochondrial membrane potential
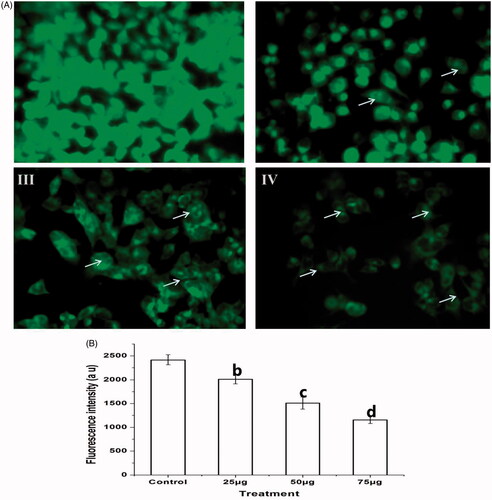
By altering MMP, the apoptosis was elicited in Ps-AgNPs treated TPC1 cells in a concentration established way, and it was determined by staining the cells with lipophilic cationic dye Rh-123. The increased depth of fluorescence in untreated (I) cells representing polarized mitochondria membrane. Rather, the significantly reduced fluorescence depth was observed in TPC1 cells (II–IV) treated with Ps-AgNPs (25, 50 and 75 µg) for 24 h, exhibited significant alteration in mitochondria membrane which leads to cell death (). shows the graphical representation of the MMP of TPC1.
Figure 7. (A) The effect of Ps-AgNPs on the mitochondria membrane potential of TPC1 cells was evaluated by the Rhodamine 123 staining. The images were acquired by floid cell imaging station. The white colour arrow indicates reduced mitochondrial membrane potential with less fluorescence intensity (II–IV). (B) The graphical presentation of mitochondrial membrane potential was detected by spectrofluorometer. All experiments were performed in triplicate and all the values were expressed as mean ± standard deviation of three replicates. The b,c,d superscripts indicate significant difference from control (p<.05).
Effect of Ps-AgNPs on apoptotic morphological changes in TPC1 cells
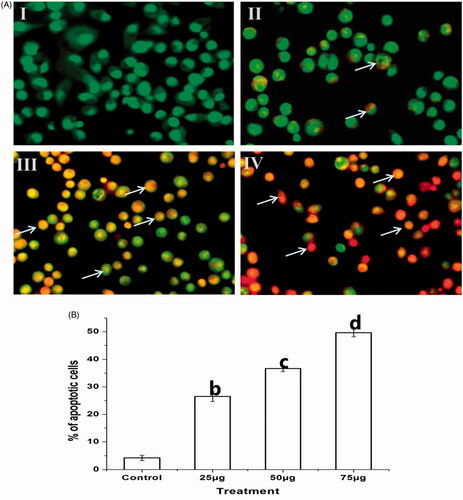
Fluorescence images show the characteristic features of apoptosis in Ps-AgNPs treated TPC1 cells stained with AO/EtBr (. The fluorescence dye AO had only stained the healthy viable cells, whereas the EtBr was selectively entered into condensed nuclei of apoptotic cells. Here, the untreated TPC1 cells had highly green fluorescence nucleus indicating live cells. While the Ps-AgNPs treated cells (II–IV) show that orange colour highlights early apoptotic cells and red-stained fragmented nuclei point out late apoptosis cells in concentration established way. Cell condensation in Ps-AgNPs treated cells indicates induced apoptotic morphological changes. illustrates the graphical representation of Ps-AgNPs induced apoptosis in TPC1.
Figure 8. The fluorescence microscopic images illustrate the Ps-AgNPs induced apoptotic morphological changes evaluated by dual staining (AO/EtBr). (A) Untreated TPC1 cells (I) showed green fluorescence indicates viable cells stained with AO. A red colour arrow indicates viable cells and a white colour arrow indicates apoptotic cells in treated cells (II–IV). The images were acquired by floid cell imaging station. (B) The graphical presentation shows the percentage of apoptotic cells. All experiments were performed in triplicate and all the values were expressed as mean ± standard deviation of three replicates. The b,c,d superscripts indicate significant difference from control (p<.05).
Discussion
Biosynthesis of silver nanoparticle
Microbial source to generate the AgNPs suggests tremendous attention in the nano-biotechnology due to its metabolic activity. It is well known that the production of extracellular enzymes like nitrate reductase by microorganisms is a key source for the reduction of metal ions to nanoparticles [Citation31]. Based on this hypothesize, several works have been conducted to screening genetically engineering special microbial species or silver tolerant bacteria [Citation32,Citation33]. These new insights have challenged these long-held viewpoints that microorganisms are principally accountable for the synthesis of AgNPs in a biologically acceptable way. It was safe to confirm that the biomass including fungi and bacteria catalyzes the AgNPs production only when the reaction is accompanied in the broth-free system and in the absence of light [Citation34].
Here, the bacterial strain Pseudomonas aeruginosa was potentially intended for the biosynthesis of AgNPs. Abo-State and Partila [Citation35] evidenced that the Pseudomonas aeruginosa was a potential reducer of silver nitrate to AgNPs. Additionally, Kalimuthu et al. [Citation36] reported that AgNPs producing Bacillus licheniformis strains showed nitrate reductase activity. According to Thakkar et al. [Citation37], the negatively charged bacterial cell wall interacts with metal ions (positively charged) and then subsequently reduces them into nanoparticles. The conversion of silver ions into AgNPs by microorganisms was described as a defence mechanism to get rid of the toxicity of the metal.
Characterization of Ps-AgNPs
Previous reports revealed that the UV spectral peak located at 410 and 450 nm has been witnessed for the presence of AgNPs and might be contributed to sphere-shaped nanoparticles [Citation38]. It was an absolute agreement with UV spectrum of Ps-AgNPs obtained in this study. TEM observation of Ps-AgNPs was revealed that spherical in form and size was ranged from 20 to 60 nm in diameter it was concurrently agreed with previous reports [Citation7,Citation39]. The existence of the peaks in FT-IR spectrum at 3244 cm−1 and 2921 cm−1 proportional to a strong acquaintance between O–H and C–H stretching of alcohol, phenol and aromatic compounds [Citation40]. These functional compounds may have an effective function in the biogenic generation of AgNPs. But, the viable mechanism is unclear and needs further investigation.
Cytotoxicity of Ps-AgNPs on TPC1 cells
The MTT colorimetric assay was primarily based on the reduction of MTT reagent into formazan by the action of mitochondrial dehydrogenase enzyme which was found in viable cells [Citation41]. The cytotoxic effect of the Ps-AgNPs on TPC1 cells suggests that biosynthesized AgNPs could contribute in the search for a new and alternative anticancer agent. Our findings showed that more than 50% of cell death was achieved at the concentration of 48.57 µg/ml of Ps-AgNPs. The cell apoptosis prompted by Ps-AgNPs at lower concentrations may be the response of P. aeruginosa metabolites accomplished with the Ps-AgNPs [Citation42].
The cytotoxicity results of this study were well evidenced that the cytotoxic efficiency of biosynthesized AgNPs counter to liver and colorectal cancer cell line [Citation19]. Metal nanoparticles are multipurpose agents with a variety of biological applications particularly in nanomedicine against multidrug-resistant bacterial pathogens [Citation43] and for various cancerous cells [Citation44]. Hussain et al. [Citation45] investigated the cytotoxic nature of several biosynthesized nanoparticles, including AgNP (15 and 100 nm in size) against liver-derived cancer cells from rats. The 24 h exposure of AgNPs to TPC1 cells, the mitochondrial function and membrane integrity were significantly reduced according to the concentrations used. It has been revealed that exposure of Ps-AgNP reduces the ATP production in cells, causes mitochondrial damage and accelerates the ROS production in dose-dependent manner. Several reports suggested that the nanoparticles exposure caused cell cycle arrest in G2/M phase possibly because of damaged DNA repair [Citation46,Citation47].
Conclusions
From the findings, we infer that the Pseudomonas aeruginosa is an effective reducer of silver nitrate to the AgNP. This bio-generated AgNPs showed good characteristic features while compared to other methods like phyto-molecule synthesis. It showed effective cytotoxicity on TPC1 cells by inducing intracellular ROS production through increasing lipid peroxidation and decreased antioxidants, reducing the MMP and inducing cell condensation. Through this study, the mechanisms of Ps-AgNPs induced apoptosis in TPC1 cells were well revealed. These results suggested that the microbiological approach is an effective method for nanoparticle fabrication; these biogenic nanoparticles could be used as a novel chemotherapeutic drug for the treatment and/or prevention of thyroid cancer.
Disclosure statement
The authors declare that no conflict of interest.
Additional information
Funding
References
- Gurunathan S, Park JH, Han JW, et al. Comparative assessment of the apoptotic potential of silver nanoparticles synthesized by Bacillus tequilensis and Calocybe indica in MDA-MB-231 human breast cancer cells: targeting p53 for anticancer therapy. Int J Nanomedicine. 2015;10:4203–4222.
- Mukherjee P, Ahmad A, Mandal D. Fungus-mediated synthesis of silver nanoparticles and their immobilization in the mycelial matrix: a novel biological approach to nanoparticle synthesis. Nano Lett. 2001;1(10):515–519.
- Conde J, Doria G, Baptista P. Noble metal nanoparticles applications in cancer. J Drug Deliv. 2012;2012:751075.
- Ghodake G, Lim SR, Lee DS. Casein hydrolytic peptides mediated green synthesis of antibacterial silver nanoparticles. Colloids Surf B. 2013;108:147–151.
- Tanvir S, Oudet F, Pulvin S, et al. Coenzyme based synthesis of silver nanocrystals. Enzyme Microb Technol. 2012;51(4):231–236.
- Liu L, Yang J, Xie J, et al. The potent antimicrobial properties of cell penetrating peptide-conjugated silver nanoparticles with excellent selectivity for Gram-positive bacteria over erythrocytes. Nanoscale. 2013;5(9):3834–3840.
- Mittal AK, Chisti Y, Banerjee UC. Synthesis of metallic nanoparticles using plant extracts. Biotechnol Adv. 2013;31(2):346–356.
- Tuo Y, Liu G, Zhou J, et al. Microbial formation of palladium nanoparticles by Geobacter sulfurreducens for chromate reduction. Bioresour Technol. 2013;133:606–611.
- Sathyavathi S, Manjula A, Rajendhran J, et al. Extracellular synthesis and characterization of nickel oxide nanoparticles from Microbacterium sp. MRS-1 towards bioremediation of nickel electroplating industrial effluent. Bioresour Technol. 2014;165:270–273.
- Natarajan K, Selvaraj SV, Murty R. Microbial production of silver Nanoparticles. Dig J Nanomater Biostruct. 2010;5(1):135–140.
- Husseiny MI, El-Aziz MA, Badr Y, et al. Biosynthesis of gold nanoparticles using Pseudomonas aeruginosa. Spectrochim Acta A . 2007;67(3–4):1003.
- Liu L, Shao Z, Ang M, et al. Are microorganisms indispensable in green microbial nanomaterial synthesis. RSC Adv. 2014;4(28):14564.
- Zhang X, Yan S, Tyagi RD, et al. Synthesis of nanoparticles by microorganisms and their application in enhancing microbiological reaction rates. Chemosphere. 2011;82(4):489–494.
- Pérez-Herrero E, Fernández-Medarde A. Advanced targeted therapies in cancer: drug nanocarriers, the future of chemotherapy. Eur J Pharm Biopharm. 2015;93:52–79.
- Hanley C, Layne J, Punnoose A, et al. Preferential killing of cancer cells and activated human T cells using ZnO nanoparticles. Nanotechnology. 2008;19(29):295103.
- El-Baghdady K, Elshatoury E, Abdullah MO, et al. Biogenic production of silver nanoparticles by Enterobacter cloacae ISM26. Turk J Biol. 2018;42(4):319–321.
- Malhotra A, Dolma K, Kaur N, et al. Biosynthesis of gold and silver nanoparticles using a novel marine strain of Stenotrophomonas. Bioresour Technol. 2013;31(142):727.
- Suresh AK, Pelletier DA, Wang W, et al. Silver nanocrystallites: biofabrication using Shewanella oneidensis, and an evaluation of their comparative toxicity on Gram-negative and Gram-positive bacteria. Environ Sci Technol. 2010;44(13):5210–5215.
- Buttacavoli M, Albanese NN, Di Cara G, et al. Anticancer activity of biogenerated silver nanoparticles: an integrated proteomic investigation. Oncotarget. 2017;9(11):9685–9705.
- Grant CS. Recurrence of papillary thyroid cancer after optimized surgery. Gland Surg. 2015;4(1):52–62.
- Davies L, Morris LGT, Haymart M, et al. American association of clinical endocrinologists and American College of Endocrinology Disease State Clinical Review: the increasing incidence of thyroid cancer. Endocr Pract. 2015;21(6):686–696.
- Chow S-M, Law SCK, Chan JKC, et al. Papillary microcarcinoma of the thyroid-prognostic significance of lymph node metastasis and multifocality. Cancer. 2003;98(1):31–40.
- Gunaseelan S, Balupillai A, Govindasamy K, et al. Linalool prevents oxidative stress activated protein kinases in single UVB-exposed human skin cells. PLOS One. 2017;12(5):e0176699.
- Okhawa H, Ohishi N, Yagi K. Assay of lipid peroxides in animal tissues by thiobarbituric acid reaction. Anal Biochem. 1979;95:351–358.
- Kakkar ZYP, Das B, Viswanathan PN. A modified spectrophotometric assay of superoxide dismutase (SOD). Indian J Biochem Biophys. 1984;21:130–132.
- Sinha KA. Colorimetric assay of catalase. Anal Biochem. 1972;47(2):389–394.
- Moron MS, De Pierre JW, Mannervik B. Levels of glutathione, glutathione reductase and glutathione S-transferase in rat lung and liver. Biochim Biophys Acta. 1972;82:67–70.
- Jesudason E, Masilamoni EG, Charles Jebaraj EJ, et al. Efficacy of dl-alpha lipoic acid against systemic inflammation induced mice: antioxidant defense system. Mol Cell Biochem. 2008;313(1–2):113–123.
- Johnson LV, Walsh ML, Chen LB. Localization of mitochondria in living cells with rhodamine 123. Proc Natl Acad Sci USA. 1980;77(2):990–994.
- Karthikeyan S, Kanimozhi G, Prasad NR, et al. Radiosensitizing effect of ferulic acid on human cervical carcinoma cells in vitro. Toxicol In Vitro. 2011;25(7):1366–1375.
- Duran N, Marcarto PD, DeSouza GIH, et al. Antibacterial effect of silver nanoparticles produced by fungal process on textile fabrics and their effluent treatment. J Biomed Nanotechnol. 2007;3:203–208.
- Das SK, Khan MR, Guha AK, et al. Silver-nanobiohybrid material: synthesis, characterization and application in water purification. Bioresour Technol. 2012;124:495–499.
- Park TJ, Lee SY, Heo NS, et al. In vivo synthesis of diverse metal nanoparticles by recombinant Escherichia coli. Angew Chem Int Ed. 2010;49:7019–7024.
- Kaler A, Jain S, Banerjee UC. Green and rapid synthesis of anticancerous silver nanoparticles by Saccharomyces boulardii and insight into mechanism of nanoparticle synthesis. BioMed Res Int. 2013;2013:1.
- Abo-State MMA, Partila AM. Microbial production of silver nanoparticles by Pseudomonas aeruginosa cell free extract. J Ecol Health Environ. 2015; 3(3):91–98.
- Kalimuthu K, Suresh Babu R, Venkataraman D, et al. Biosynthesis of silver nanocrystals by Bacillus licheniformis. Colloids Surf B. 2008;66:150–153.
- Thakkar KN, Mhatre SS, Parikh RY. Biological synthesis of metallic nanoparticles. Nanomedicine. 2010;6(2):257–262.
- Zaheer Z, Rafiuddin. Silver nanoparticles to self-assembled films: green synthesis and characterization. Colloids Surf B: Biointerfaces. 2012;90:48–52.
- Singh PK, Bhardwaj K, Dubey P, et al. UV-assisted size sampling and anti-bacterial screening of Lantana camara leaf extract synthesized silver nanoparticles. RSC Adv. 2015;5(31):24513–24520.
- Kumar P, Senthamilselvi S, Lakshmiprabha A, et al. Synthesis of silver nanoparticles from Sargassum tenerrimum and screening phytochemicals for its anti-bacterial activity. Nano Biomed. Eng. 2012;4(1):12–16.
- Mosmann T. Rapid colorimetric assay for cellular growth and survival: application to proliferation and cytotoxicity assays. J Immunol Methods. 1983;65(1–2):55–63.
- Farah MA, Ali MA, Chen SM, et al. Silver nanoparticles synthesized from Adenium obesum leaf extract induced DNA damage, apoptosis and autophagy via generation of reactive oxygen species. Colloids Surf B: Biointerfaces. 2016;141:158–169.
- Behravan M, Hossein Panahi A, Naghizadeh A, et al. Facile green synthesis of silver nanoparticles using Berberis vulgaris leaf and root aqueous extract and its antibacterial activity. Int J Biol Macromol. 2019;124:148–154.
- Sankar R, Karthik A, Prabu A, et al. Origanum vulgare mediated biosynthesis of silver nanoparticles for its antibacterial and anticancer activity. Colloids Surf B Biointerfaces. 2013;1(108):80–84.
- Hussain SM, Hess KL, Gearhart JM, et al. In-vitro toxicity of nanoparticles in BRL 3A rat liver cells. Toxicol In Vitro. 2005;19(7):975–983.
- Lee YS, Kim DW, Lee YH, et al. Silver nanoparticles induce apoptosis and G2/M arrest via PKCζ-dependent signaling in A549 lung cells. Arch Toxicol. 2011;85:1529–1540.
- AshaRani PV, Low Kah Mun G, Hande MP, et al. Cytotoxicity and genotoxicity of silver nanoparticles in human cells. ACS Nano. 2009;3(2):279–290.