
Abstract
Recently, numerous studies have been performed to detect the association between H19 polymorphisms and cancer susceptibility. However, their results were inconsistent and controversial. So, we carried out a meta-analysis aiming to define the association exactly. Eligible studies were collected using PubMed and Embase databases up to March 31, 2019. Odds ratios (ORs) with 95% confidence intervals (CIs) were calculated to assess the strength of association. Sensitivity analysis and publication bias were established to evaluate the robustness of our results. Totally, 60 studies involving 20763 cases and 27403 patients were analysed in our meta-analysis. Our results indicated that H19 rs217727 C > T polymorphism was significantly associated with increased cancer risk. In subgroup analysis, similarly increased risk could be found in gastrointestinal group for rs2839698 and protective effect was observed in rs2107425 polymorphism for cancer development in Caucasian population. Trial sequential analysis strengthened findings of our meta-analysis that cumulative evidence was adequate. In summary, our meta-analysis supported that H19 polymorphisms may be associated with cancer susceptibility.
Introduction
Cancer is one of the leading causes of death in economically more or less developed countries. It is estimated that, in 2019, 1.7 million newly appeared cancer cases and 0.6 million cancer deaths may occur only in the United States [Citation1]. As the increasing incidence and mortality, more and more studies have been performed to detect risk factors of cancer [Citation2,Citation3]. Usage of tobacco, obesity and alcohol intake are thought to be well-known risk factors for cancer while other putative factors such as air pollution and viral infection also contribute to cancer development [Citation4–8]. However, the underlying pathogenesis of cancer remains unclear by now.
In the past decades, many evidences indicated that genetic variations such as single-nucleotide polymorphisms (SNPs) play an important role in detecting cancer susceptibility [Citation9,Citation10]. H19, located at chromosome 11p15.5 and 2.3 kb in length, is a type of long non-coding RNA (lncRNA) and a paternally imprinted gene [Citation11,Citation12]. It has been shown to be over expressed in a variety of cancer cell lines and tumour types including breast, pancreas, bladder, stomach and so on [Citation13–16]. Furthermore, abnormal lncRNA H19 expression may play a vital role in cancer initiation, progression and metastasis [Citation17,Citation18]. These clearly indicated that H19 polymorphisms could be biomarkers for evaluating cancer risk. Numerous studies have examined the association existed between H19 polymorphisms and tumours, such as breast cancer, bladder cancer, gastric cancer and oral squamous cell carcinoma, etc [Citation19–22]. However, these studies reported inconsistent results. Therefore, we conducted a meta-analysis to examine the accurate correlation between H19 polymorphisms and cancer susceptibility.
Material and method
The present systematic review and meta-analysis was incorporated the Preferred Reporting Items for Systematic Reviews and Meta-Analyses (PRISMA) [Citation23]. The PRISMA checklist including the page number for each item can be found in Additional file 1.
Literature search strategy
A systematic literature search was performed using PubMed and Embase databases to detect all relevant publications examining the relationship between H19 polymorphisms and risk of cancer published up to 31 March 2019. The search was performed using the following terms: “polymorphism/genotype/SNP/allele/variant” and “H19” and “cancer/tumor/carcinoma/neoplasm”. In addition, the references in retrieved articles were also reviewed for possible inclusion.
Inclusion and exclusion criteria
All the selected studies included in the current meta-analysis were based on the following criteria: (1) case-control studies; (2) studies published in English; (3) included available data on genotype distribution of H19 polymorphisms for pooled analysis. (4) For the duplicate studies using overlapping data, we included only the study with the larger sample size. Duplicated studies, letters, reviews and studies without usable data were excluded.
Data extraction
The relevant information was extracted by two investigators using a standardised form independently including: first author, publishing year, ethnicity, source of controls, genotyping methods, cancer types, sample size, allele and genotype frequencies, p value for Hardy-Weinberg equilibrium (HWE) in control group, the Newcastle-Ottawa Quality Assessment Scale (NOS) score. The quality of studies was evaluated using the NOS and scores greater than six were considered to be of high quality, otherwise, they were thought to be of low quality.
Statistical analysis
The strength of association between H19 polymorphisms and susceptibility of cancer was assessed by computing the crude odds ratios (ORs) with 95% confidence intervals (CIs). For the H19 rs217727 C > T polymorphism, the pooled ORs were calculated in an allelic model (T vs. C), recessive model (TT vs. CT + CC), dominant model (TT + CT vs. CC), homozygous model (TT vs. CC), heterozygous model (CT vs. CC). As for rs2839698, rs2107425 and rs3024270 polymorphisms, similar five genetic models were also assessed. The I2 statistic was used to detect heterogeneity between studies. If I2 was >50%, the random effect model would be used on account of significant between-study heterogeneity. Or else, the fixed-effect model would be applied. Subgroup analyses based on ethnicity, source of controls, genotyping methods, quality of studies and types of cancer were subsequently performed to obtain more specific results. Sensitivity analyses were carried out in order to evaluate the robustness of the results by omitting each study sequentially. Funnel plots and Egger’s regression test were used to test the publication bias. Statistical analyses were conducted using STATA software 12.0 (StataCorp LP, College Station, TX). p value <.05 was considered statistically significant.
Trial sequential analysis (TSA)
Although meta-analysis is thought to be suitable to evaluate the pooled effect of genetic association studies, it may lead to random and systematic errors occasionally. In order to reduce the errors, a new statistical analysis method called TSA has been introduced, which calculates the required information size (RIS) and estimates the power of results [Citation24]. Here, we performed this TSA at a level of 5% alpha risk, 20% beta risk, 20% relative risk reduction (RRR) and a two-sided boundary type. If the Z-curve crosses the monitoring boundaries or the RIS line, robust evidence might be confirmed. Otherwise, more studies are needed.
Results
Characteristics of studies
As shown in , 99 relevant publications with 4 SNPs on H19 were retrieved in this research. First, 43 duplicated articles and 19 obviously irrelevant articles were removed by reviewing title and abstract. Then, we excluded totally 11 articles including 7 letters, reference abstracts and reviews and 4 articles which were not focussing on cancer susceptibility. Finally, a total of 26 eligible articles (60 studies) published from 2008 to 2019 were recruited in this meta-analysis, including 19 studies on rs217727 C > T polymorphism [Citation19–22,Citation25–39], 13 studies on rs2839698 G > A polymorphism [Citation19–21,Citation26,Citation27,Citation30,Citation31,Citation33,Citation34,Citation36,Citation38,Citation40,Citation41], 21 studies on rs2107425 polymorphism [Citation27,Citation28,Citation41–46] and 7 studies on rs3024270 polymorphism [Citation20,Citation33,Citation34,Citation36,Citation38–40]. The detailed characteristics and genotype distributions of included studies are summarised in .
Figure 1. Flow diagram of the study selection process.
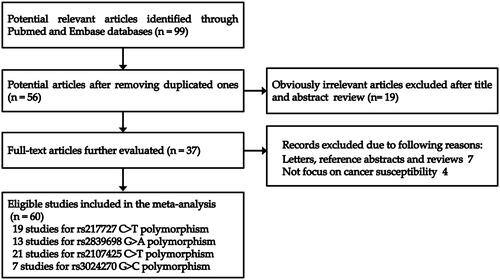
Table 1. Characteristics of case-control studies on H19 polymorphisms and cancer risk included in the meta-analysis.
Quantitative analysis
Meta-analysis for H19 rs217727 C > T polymorphism
A total of 19 studies with 9688 patients and 11,769 controls were qualified for including in this meta-analysis of association between H19 rs217727 C > T polymorphism and cancer risk. The pooled analysis indicated that rs217727 polymorphism was related to increased cancer risk in allelic, dominant and homozygous model (T vs. C: OR = 1.12, 95%CI = 1.02–1.23, p = .02; TC + TT vs. CC: OR = 1.15, 95%CI = 1.01–1.30, p = .04; TT vs. CC: OR = 1.24, 95%CI = 1.02–1.49, p = .03) (, ). In the further subgroup analysis by ethnicity, we detected a significant association of rs217727 with cancer susceptibility in Asian population (). Moreover, the stratified analysis by type of cancer showed that rs217727 was associated with oral squamous cell carcinoma in all five genetic models as well as lung cancer in allelic and homozygous models (). As for the sensitivity analysis, no change of the results could be observed when eliminating each study sequentially in allelic model, but not dominant or homozygous model (). Visual inspection of funnel plots indicated no publication bias which was further confirmed by Egger’s test (T vs. C: pegger = 0.35; TT vs. TC + CC: pegger = 0.99; TC + TT vs. CC: pegger = 0.22; TT vs. CC: pegger= 0.60; TC vs. CC: pegger = 0.25, ). In TSA, the cumulative Z-curve crossed the monitoring line in four models and futility boundary in recessive model which indicated that cumulative evidence was adequate and our results were reliable (T vs. C: RIS = 7524; TT vs. TC + CC: RIS = 22,304; TT + CT vs. CC: RIS = 3125; TT vs. CC: RIS = 11,573; CT vs. CC: RIS = 3488, ).
Figure 2. Calculated OR and 95% CIs for the associations between H19 rs217727 polymorphism and cancer risk in overall populations. A for the allele contrast model; B for the dominant model; C for the homozygous model.
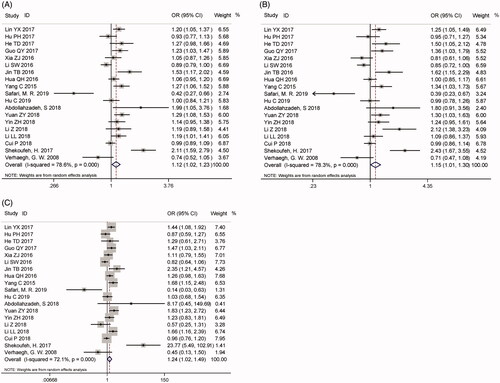
Figure 3. Sensitivity analysis via deletion of each individual study reflects the relative influence of each individual dataset on the pooled ORs of H19 rs217727 polymorphism. A for the allele contrast model; B for the dominant model; C for the homozygous model.
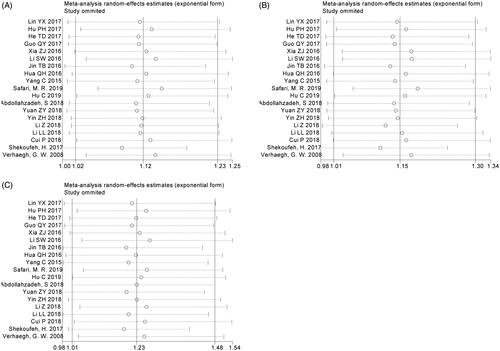
Figure 4. Funnel plot analysis to detect publication bias of H19 rs217727 polymorphism. A for the allele contrast model; B for the dominant model; C for the homozygous model.
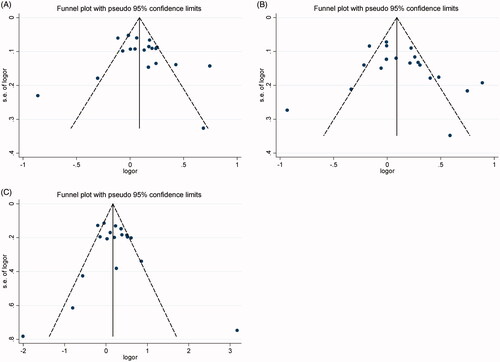
Figure 5. Trial sequential analyses for H19 rs217727 polymorphism and cancer risk. A for the allele contrast model; B for the dominant model; C for the homozygous model.
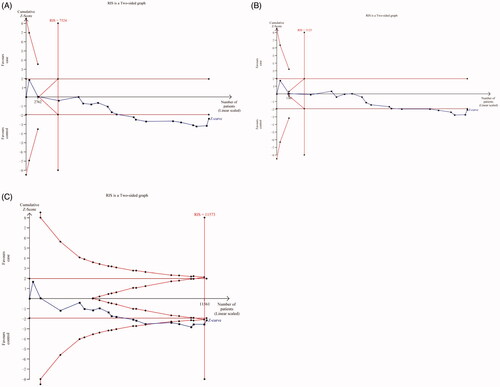
Table 2. Summary ORs and 95% CIs of H19 rs217727 polymorphism and cancer risk.
Meta-analysis for H19 rs2839698 G > a polymorphism
Thirteen eligible studies with 7627 patients and 8985 controls reported the association between H19 rs2839698 G > A polymorphism and cancer susceptibility. As shown in , the pooled results did not support a correlation between them (A vs. G: OR = 1.05, 95%CI = 0.93–1.19, p = .43; AA vs. AG + GG: OR = 1.04, 95%CI = 0.82–1.32, p = .74; AG + AA vs. GG: OR = 1.10, 95%CI = 0.97–1.24, p = .14; AA vs. GG: OR = 1.20, 95%CI = 0.97–1.48, p = .09; AG vs. GG: OR = 1.07, 95%CI = 0.95–1.21, p = .25, ). However, in the subgroup analysis, we detected that rs2839698 G > A polymorphism was significantly related to the gastrointestinal cancer risk under all five genetic models. In addition, some significant associations were observed in subgroup analyses by genotyping method and source of controls (). Sensitivity analysis demonstrated that dropping any one of the studies, no obvious alteration of pooled OR or its 95%CI could be observed (Supplementary Figure S1). Potential publication bias was evaluated with funnel plot and Egger’s test in the current study and no obvious publication bias could be found (A vs. G: pegger=0.78; AA vs. AG + GG: pegger= 0.50; AG + AA vs. GG: pegger= 0.20; AA vs. GG: pegger= 0.41; AG vs. GG: pegger= 0.22, Supplementary Figure S2). In TSA, the results indicated that enough studies were applied in this meta-analysis to come to a credible result (Supplementary Figure S3).
Figure 6. Calculated OR and 95% CIs for the associations between H19 rs2839698 polymorphism and cancer risk in overall populations. A for the allele contrast model; B for the recessive model; C for the dominant model; D for the homozygous model; E for the heterozygous model.
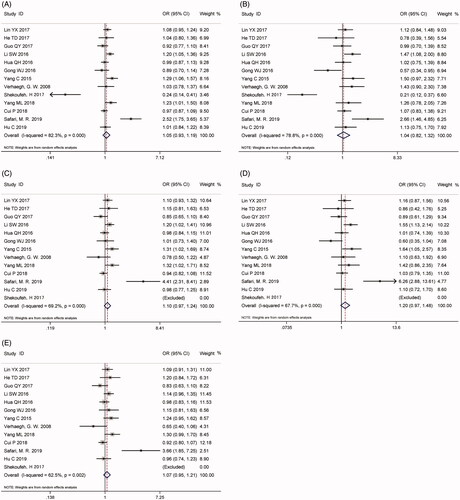
Table 3. Summary ORs and 95% CIs of H19 rs2839698 polymorphism and cancer risk.
Meta-analysis for H19 rs2107425 C > T polymorphism
The association between H19 rs2107425 C > T polymorphism and cancer susceptibility was investigated in 21 studies with 11,314 patients and 15,746 controls which included in this meta-analysis. No significant correlation was identified between rs2107425 C > T polymorphism and cancer risk in any genetic models (Supplementary Figure S4, ). In the stratified analysis, the results of allelic and heterozygous models (C vs. T: OR = 0.94, 95%CI = 0.90–0.98, p < .01, CT vs. TT: OR = 0.91, 95%CI = 0.83–0.99, p = .03, , ) implicated protective effects on cancer risk in Caucasian-based subgroup analysis. Sensitivity analysis, which was performed by eliminating studies one by one to see whether the overall results were altered, suggested robustness of our results (Supplementary Figure S5). Besides, symmetric funnel plots revealed no evidence of publication bias and further Egger’s test showed similar results in two genetic models except for allelic, dominant and heterozygous model (C vs. T: pegger= 0.04; CC vs. CT + TT: pegger =0.30; CT + CC vs. TT: pegger = 0.02; CC vs. TT: pegger =0.12; CT vs. TT: pegger = 0.03, Supplementary Figure S6). TSA in all five genetic models indicated that cumulative evidences were enough and our results were reliable and conclusive (Supplementary Figure S7).
Figure 7. Calculated OR and 95% CIs for the associations between H19 rs2107425 polymorphism and cancer risk in subgroup analysis. A for the allele contrast model; B for the heterozygous model.
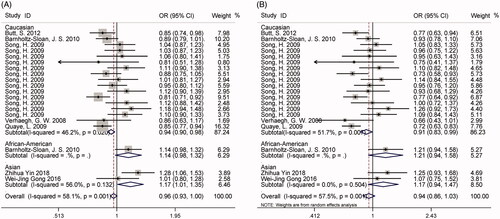
Table 4. Summary ORs and 95% CIs of H19 rs2107425 polymorphism and cancer risk.
Meta-analysis for H19 rs3024270 G > C polymorphism
As shown in and , a pooled analysis of 7 eligible studies involving 3814 patients and 5206 controls disclosed no association between H19 rs3024270 G > C polymorphism and cancer risk. Not only that, further subgroup analyses by the source of control and type of cancer also revealed similar results (). The pooled ORs exhibited no change in the following sensitivity analyses (Supplementary Figure S8) and no publication bias could be found in both funnel plots (Supplementary Figure S9) and Egger’s test (C vs. G: pegger = 0.28; CC vs. CG + GG: pegger = 0.69;CG + CC vs. GG:pegger = 0.43; CC vs. GG: pegger = 0.43; CG vs. GG:pegger = 0.47). Although Z-curve of TSA did not cross the monitoring boundary, the number of participants in our study was larger than required information size (C vs. G: RIS = 1359; CC vs. CG + GG: RIS = 2490;CG + CC vs. GG: RIS = 668; CC vs. GG: RIS = 1655; CG vs. GG: RIS = 754, Supplementary Figure S10). To sum up, enough evidences were established in our meta-analysis.
Figure 8. Calculated OR and 95% CIs for the associations between H19 rs3024270 polymorphism and cancer risk in overall populations. A for the allele contrast model; B for the recessive model; C for the dominant model; D for the homozygous model; E for the heterozygous model.
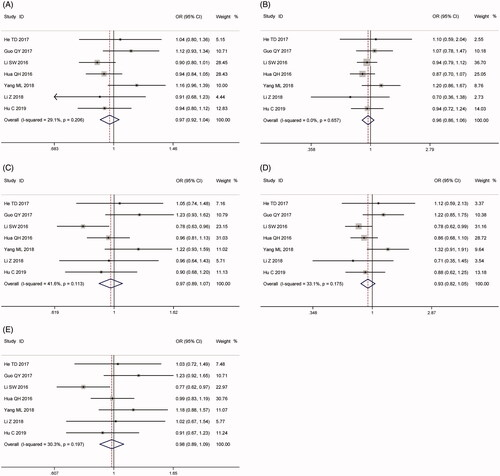
Table 5. Summary ORs and 95% CIs of H19 rs3024270 polymorphism and cancer risk.
Discussion
As a complex disease, cancer becomes a major threat towards worldwide public health [Citation47]. However, the pathogenesis of cancer was still unclear. Although lncRNAs do not encode proteins, they play an important role in human transcription process, especially in cancer-related aspects [Citation48]. Hence, abnormal lncRNA expression may lead to cancer occurrence and development. Large numbers of SNPs have been detected in lncRNAs and many studies focussing on the association between SNPs and cancer susceptibility were performed. H19 is the very first eukaryote lncRNA gene which was found in 1980s, even though it was identified as mRNA at that time [Citation48]. In 2008, Verhaegh et al. reported association between H19 polymorphisms and bladder cancer firstly [Citation27]. Since then, increasingly studies were performed to assess the relationship between H19 polymorphisms (rs217727, rs2839698, rs2107425 and rs3024270) and cancer risk.
As for the rs217727 polymorphism, Verhaegh et al. found no correlation between rs217727 and cancer risk of bladder cancer [Citation27]. However, this result could not be repeated in the subsequent studies by Li and Hua et al., which reported an increased cancer risk for rs217727 [Citation20,Citation39]. Thus, in 2016, Chu et al. performed a meta-analysis involving 5 articles with 7110 subjects that indicated no correlation between rs217727 and overall cancer risk [Citation49]. Compared with previous meta-analysis, we led to an opposite conclusion that rs217727 polymorphism was significantly associated with increased cancer susceptibility, especially in the Asian population. The discrepancy may be due to the different sample sizes. Our updated study was the largest and latest. We added another 14 recent studies including 14,347 subjects, three times as much as previous study [Citation19,Citation22,Citation25,Citation26,Citation28–34,Citation37–39]. More importantly, TSA, a new method applied in our pooled analysis, evaluated the required information size of this study which was adequate to come to a reliable conclusion.
How can we explain the association of H19 rs217727 with cancer risk? Growing evidence indicated that lncRNAs could interact with miRNAs directly, and the SNPs of lncRNA might change the structure of lncRNA at the miRNA binding sites and affect their interaction and function ultimately. As for H19, it has been reported to serve critical roles in carcinogenesis. Through its mediator miR-675, H19 can promote the growth of breast cancer by downregulating Cbl-b and c-Cbl [Citation50]. Also, Kallen et al. found that H19 acts as a molecular sponge to antagonise let-7, a well-known tumour-suppressive microRNA [Citation51]. However, no miRNA which combined with rs217727 variant was identified using lncRNASNP database. So, changing the binding site of miRNAs might not be the precise mechanism for rs217727 to associate with cancer risk. In addition, located in the exons in all transcripts of H19, rs217727 has great potential to alter H19's structure and expression level [Citation52]. However, in the gastric cancer tissue, the rs217727 TT or CT genotype was found not to affect H19 mRNA expression compared with the CC genotype [Citation21]. Thus, on the basis of current information, we speculate that rs217727 polymorphism might alter H19 mRNA conformation or translational efficiency, which may finally affect the function for H19. Further functional studies are required to verify our hypothesis.
Previous meta-analysis for rs2839698 G > A polymorphism included 5 publications with 6890 subjects showed marginally association between rs2839698 and cancer risk [Citation49]. With regard to rs2107425 C > T polymorphism, 6 articles were applied in Chu’s meta-analysis, which reflected a protective effect on cancer development [Citation49]. However, in our study, after further adding 8 more articles (9722 subjects), we came to a definitely different conclusion that rs2839698 was not associated with cancer susceptibility [Citation19,Citation26,Citation30,Citation31,Citation33,Citation34,Citation38,Citation40]. Similarly, no correlation was identified between rs2107425 and overall cancer risk, due to the addition of two recent publications and removal of the studies using overlapping data with smaller sample sizes [Citation28,Citation44–46]. Moreover, subsequent subgroup analyses indicated that A allele or AA genotype of rs2839698 was a potential genetic marker for gastrointestinal cancer, and that the C allele in rs2107425 might be related to decreased cancer risk in Caucasian population. Stratified analyses indicated that the differences in genetic backgrounds and cancer location might have resulted in the discrepancies among the individual studies. In addition, for the first time, we examined the association between rs3024270 G > C polymorphism and cancer susceptibility and found no correlation between them as well as in the subgroup analysis.
Like all meta-analyses, our study is not without limitation certainly. First, we only included articles published in English which might cause a language bias. Second, we mostly included the Asian population in the study of rs217727 and rs2839698 polymorphism while Caucasian population in the study of rs2107425. Therefore, patients of different ethnicities should be enrolled which would help the results suitable for more ethnicities. Third, in the sensitivity analysis for rs217727, we detected slight changes of results when omitted each study in two genetic models with positive results. These changes could be mainly accounted for the studies by Yuan ZY, Jin TB and Shekoufeh H. These data suggest that the pooled results are less stable and these conclusions should be considered cautiously. Additionally, publication bias could be detected in the study for rs2107425 in three models except for recessive and homozygous models. Hence, these results should be interpreted with caution. Fourth, significant heterogeneity could be observed in the analyses for rs217727 and rs2839698. Therefore, we performed sensitivity analysis and subgroup analysis to look for the source of heterogeneity. Subgroup analyses based on type of cancer may explain part of source of heterogeneity. Finally, owing to the lack of data, we could not detect potential gene-gene and gene-environmental interactions.
In conclusion, our meta-analysis provides evidence that rs217727 polymorphisms of H19 might contribute to overall cancer risk, rs2107425 polymorphism may have a protective effect on cancer development in Caucasian population, and rs2839698 polymorphism is associated to increased gastrointestinal cancer susceptibility whereas rs3024270 may have no impact. More well-designed studies involving participants of different ethnicities and larger sample size are needed to confirm our findings.
Supplementary_data.pdf
Download PDF (1,018.3 KB)Additional_file_1.doc
Download MS Word (63 KB)Disclosure statement
The authors declare that they have no conflicts of interest to disclose.
Additional information
Funding
Related Research Data
References
- Siegel RL, Miller KD, Jemal A. Cancer statistics, 2019. CA A Cancer J Clin. 2019;69(1):7–34.
- Sun YS, Zhao Z, Yang ZN, et al. Risk Factors and Preventions of Breast Cancer. Int J Biol Sci. 2017;13(11):1387–1397.
- VoPham T. Environmental risk factors for liver cancer and nonalcoholic fatty liver disease. Curr Epidemiol Rep. 2019;6(1):50–66.
- Torre LA, Bray F, Siegel RL, et al. Global cancer statistics, 2012. CA Cancer J Clin. 2015;65(2):87–108.
- Rojas K, Stuckey A. Breast cancer epidemiology and risk factors. Clin Obstet Gynecol. 2016;59(4):651–672.
- Islami F, Goding Sauer A, Miller KD, et al. Proportion and number of cancer cases and deaths attributable to potentially modifiable risk factors in the United States. CA Cancer J Clin. 2018;68(1):31–54.
- Chen W, Zheng R, Baade PD, et al. Cancer statistics in China, 2015. CA Cancer J Clin. 2016;66(2):115–132.
- Tornesello ML, Buonaguro L, Izzo F, et al. Molecular alterations in hepatocellular carcinoma associated with hepatitis B and hepatitis C infections. Oncotarget. 2016;7(18):25087–25102.
- Ryan BM. microRNAs in Cancer Susceptibility. Adv Cancer Res. 2017;135:151–171.
- Thompson CL, Fink SP, Lutterbaugh JD, et al. Genetic variation in 15-hydroxyprostaglandin dehydrogenase and colon cancer susceptibility. PLoS One. 2013;8(5):e64122.
- Gabory A, Jammes H, Dandolo L. The H19 locus: role of an imprinted non-coding RNA in growth and development. Bioessays. 2010;32(6):473–480.
- Brannan CI, Dees EC, Ingram RS, et al. The product of the H19 gene may function as an RNA. Mol Cell Biol. 1990;10(1):28–36.
- Gan L, Lv L, Liao S. Long noncoding RNA H19 regulates cell growth and metastasis via the miR223p/Snail1 axis in gastric cancer. Int J Oncol. 2019;54(6):2157–2168.
- Luo M, Li Z, Wang W, et al. Long non-coding RNA H19 increases bladder cancer metastasis by associating with EZH2 and inhibiting E-cadherin expression. Cancer Lett. 2013;333(2):213–221.
- Ma C, Nong K, Zhu H, et al. H19 promotes pancreatic cancer metastasis by derepressing let-7's suppression on its target HMGA2-mediated EMT. Tumor Biol. 2014;35(9):9163–9169.
- Collette J, Le Bourhis X, Adriaenssens E. Regulation of human breast cancer by the long Non-Coding RNA H19. Int J Mol Sci. 2017;18(11):pii: E2319.
- Sun W, Yang Y, Xu C, et al. Regulatory mechanisms of long noncoding RNAs on gene expression in cancers. Cancer Genet. 2017;216–217:105–110.
- Raveh E, Matouk IJ, Gilon M, et al. The H19 Long non-coding RNA in cancer initiation, progression and metastasis - a proposed unifying theory. Mol Cancer. 2015;14(1):184.
- Safari MR, Mohammad Rezaei F, Dehghan A, et al. Genomic variants within the long non-coding RNA H19 confer risk of breast cancer in Iranian population. Gene. 2019;701:121–124.
- Hua Q, Lv X, Gu X, et al. Genetic variants in lncRNA H19 are associated with the risk of bladder cancer in a Chinese population. Mutagenesis. 2016;31(5):531–538.
- Yang C, Tang R, Ma X, et al. Tag SNPs in long non-coding RNA H19 contribute to susceptibility to gastric cancer in the Chinese Han population. Oncotarget. 2015;6(17):15311–15320.
- Yuan Z, Yu Y, Zhang B, et al. Genetic variants in lncRNA H19 are associated with the risk of oral squamous cell carcinoma in a Chinese population. Oncotarget. 2018;9(35):23915–23922.
- Moher D, Liberati A, Tetzlaff J, et al. Preferred reporting items for systematic reviews and meta-analyses: the PRISMA statement. PLoS Med. 2009;6(7):e1000097.
- Imberger G, Thorlund K, Gluud C, et al. False-positive findings in Cochrane meta-analyses with and without application of trial sequential analysis: an empirical review. BMJ Open. 2016;6(8):e011890.
- Abdollahzadeh S, Ghorbian S. Association of the study between LncRNA-H19 gene polymorphisms with the risk of breast cancer. J Clin Lab Anal. 2019;33(3):e22826.
- Hassanzarei S, Hashemi M, Sattarifard H, et al. Genetic polymorphisms in long noncoding RNA H19 are associated with breast cancer susceptibility in Iranian population. Meta Gene. 2017;14:1–5.
- Verhaegh GW, Verkleij L, Vermeulen SH, et al. Polymorphisms in the H19 gene and the risk of bladder cancer. Eur Urol. 2008;54(5):1118–1126.
- Yin Z, Cui Z, Li H, et al. Polymorphisms in the H19 gene and the risk of lung Cancer among female never smokers in Shenyang, China. BMC Cancer. 2018;18(1):893.
- Li L, Guo G, Zhang H, et al. Association between H19 SNP rs217727 and lung cancer risk in a Chinese population: a case control study. BMC Med Genet. 2018;19(1):136.
- Cui P, Zhao Y, Chu X, et al. SNP rs2071095 in LincRNA H19 is associated with breast cancer risk. Breast Cancer Res Treat. 2018;171(1):161–171.
- Lin Y, Fu F, Chen Y, et al. Genetic variants in long noncoding RNA H19 contribute to the risk of breast cancer in a southeast China Han population. Onco Targets Ther. 2017;10:4369–4378.
- Hu P, Qiao O, Wang J, et al. rs1859168 A > C polymorphism regulates HOTTIP expression and reduces risk of pancreatic cancer in a Chinese population. World J Surg Onc. 2017;15(1):155.
- He TD, Xu D, Sui T, et al. Association between H19 polymorphisms and osteosarcoma risk. Eur Rev Med Pharmacol Sci. 2017;21(17):3775–3780.
- Guo QY, Wang H, Wang Y. LncRNA H19 polymorphisms associated with the risk of OSCC in Chinese population. Eur Rev Med Pharmacol Sci. 2017;21(17):3770–3774.
- Xia Z, Yan R, Duan F, et al. Genetic polymorphisms in long noncoding RNA H19 are associated with susceptibility to breast cancer in Chinese population. Medicine (Baltimore). 2016;95(7):e2771.
- Li S, Hua Y, Jin J, et al. Association of genetic variants in lncRNA H19 with risk of colorectal cancer in a Chinese population. Oncotarget. 2016;7(51):25470–25477.
- Jin T, Wu X, Yang H, et al. Association of the miR-17-5p variants with susceptibility to cervical cancer in a Chinese population. Oncotarget. 2016;7(47):76647–76655.
- Hu C, Yang T, Pan J, et al. Associations between H19 polymorphisms and neuroblastoma risk in Chinese children. Biosci Rep. 2019;39(4):BSR20181582.
- Li Z, Niu Y. Association between lncRNA H19 (rs217727, rs2735971 and rs3024270) polymorphisms and the risk of bladder cancer in Chinese population. Minerva Urol Nefrol. 2019;71(2):161–167.
- Yang ML, Huang Z, Wang Q, et al. The association of polymorphisms in lncRNA-H19 with hepatocellular cancer risk and prognosis. Biosci Rep. 2018;38(5):BSR20171652.
- Gong WJ, Yin JY, Li XP, et al. Association of well-characterized lung cancer lncRNA polymorphisms with lung cancer susceptibility and platinum-based chemotherapy response. Tumor Biol. 2016;37(6):8349–8358.
- Butt S, Harlid S, Borgquist S, et al. Genetic predisposition, parity, age at first childbirth and risk for breast cancer. BMC Res Notes. 2012;5(1):414.
- Barnholtz-Sloan JS, Shetty PB, Guan X, et al. FGFR2 and other loci identified in genome-wide association studies are associated with breast cancer in African-American and younger women. Carcinogenesis. 2010;31(8):1417–1423.
- Song H, Ramus SJ, Kjaer SK, et al. Association between invasive ovarian cancer susceptibility and 11 best candidate SNPs from breast cancer genome-wide association study. Hum Mol Genet. 2009;18(12):2297–2304.
- Quaye L, Tyrer J, Ramus SJ, et al. Association between common germline genetic variation in 94 candidate genes or regions and risks of invasive epithelial ovarian cancer. PLoS One. 2009;4(6):e5983.
- Bhatti P, Doody MM, Alexander BH, et al. Breast cancer risk polymorphisms and interaction with ionizing radiation among U.S. radiologic technologists. Cancer Epidemiol Biomarkers Prev. 2008;17(8):2007–2011.
- Siegel RL, Miller KD, Jemal A. Cancer statistics, 2017. CA Cancer J Clin. 2017;67(1):7–30.
- Jarroux J, Morillon A, Pinskaya M. History, Discovery, and Classification of lncRNAs. Adv Exp Med Biol. 2017;1008:1–46.
- Chu M, Yuan W, Wu S, et al. Quantitative assessment of polymorphisms in H19 lncRNA and cancer risk: a meta-analysis of 13,392 cases and 18,893 controls. Oncotarget. 2016;7(48):78631–78639.
- Vennin C, Spruyt N, Dahmani F, et al. H19 non coding RNA-derived miR-675 enhances tumorigenesis and metastasis of breast cancer cells by downregulating c-Cbl and Cbl-b. Oncotarget. 2015;6(30):29209–29223.
- Kallen AN, Zhou XB, Xu J, et al. The imprinted H19 lncRNA antagonizes let-7 microRNAs. Mol Cell. 2013;52(1):101–112.
- Lv Z, Xu Q, Yuan Y. A systematic review and meta-analysis of the association between long non-coding RNA polymorphisms and cancer risk. Mutat Res. 2017;771:1–14.