
 ?Mathematical formulae have been encoded as MathML and are displayed in this HTML version using MathJax in order to improve their display. Uncheck the box to turn MathJax off. This feature requires Javascript. Click on a formula to zoom.
Abstract
Many malignant cancers have an increased demand for lipoprotein due to the requirement for lipids for the rapid proliferation of the tumours and which is met by the increased availability of LDL through upregulation of LDL transporters. This unique phenomenon is the basis for the use of LDL based nanoparticles for cell imaging. In this study, a novel MR-active LDL nanoparticle was synthesised as the MRI probes. This MR-active LDL was characterised by using different techniques including scanning electron microscopy (SEM), dynamic light scattering (DLS), Fourier-transform infra-red spectroscopy (FTIR) and magnetic resonance imaging (MRI). The intracellular uptake of Gd3+ and cytotoxicity was measured by ICP-AES and MTT assay respectively. Results suggest that this nanoprobe with spherical shape and size of 55 nm has reduced relaxation time compared to commercial contrast agent and is introduced as an appropriate imaging probe. The amount of reabsorption of nanoprobe increased up to 6 h and given that the connection of the chelator does not have an effect on reabsorption proves that entry through transporter of APO section has done. This study lays the basis for exploring a personalised medicine strategy by directing a patient’s own LDL to cancer cell imaging in the early stages.
Over-expression of low-density lipoprotein receptors (LDLRs) occurs in many types of malignancies and is related to the requirement for lipids for the rapid proliferation of the tumours. The highly selective binding of LDL to LDLR makes these particles as ideal carriers for therapeutic and diagnostic contrast agents into the targeted cells [Citation1]. Medical imaging has undergone tremendous improvements over the last 35 years, with the introduction of techniques such as magnetic resonance imaging (MRI), computed tomography (CT) and other developments that allow non-invasive and accurate diagnoses. Asides from anatomical information, data on a wide variety of processes can be derived from medical imaging, such as diffusion, inflammation and, angiogenesis. Contrast agents were prerequisite in some imaging techniques, facilitated the acquisition of new data and improved contrast agents were an important research topic. Nanoparticles that incorporate contrast-generating materials were an especially strong focus of recent contrast agent research [Citation2,Citation3].
Low-density lipoprotein (LDL) is a natural nanostructure (∼22 nm) that has the high-payload capacity and is biocompatible, biodegradable, and non-immunogenic [Citation4,Citation5]. LDL nanoparticles consist of a phospholipid monolayer covering a hydrophobic core. The phospholipid monolayer makes of the apolipoprotein B-100 (ApoB-100), a very large amphipathic protein containing one or more clusters of cationic amino acids that target LDL receptors on cells. Multiple mammalian tissues, including brain, heart, liver, and kidney were recognised to express LDL receptors that make the intracellular transport of LDLs easier [Citation6]. Moreover, several tumours overexpress LDLRs to provide cholesterol to maintain a high rate of membrane synthesis [Citation7]. There are three ways to adapt LDLs with imaging contrast agents or drug, including covalent modification of the phospholipid or protein, intercalation of the agent into the phospholipid shell, and covering the agent in the LDLs core through the reconstitution technique [Citation8]. Several researchers have used LDLs to selectively deliver diagnostic and/or therapeutic agents to LDL receptor overexpressing tumours [Citation1,Citation9–11].
In the present study, the purpose is to design contrast compositions for early diagnosis of cancer and cellular imaging by MRI. Therefore, MRI was selected for non-invasive, safe, and accessible as a method of imaging. From paramagnetic metals, gadolinium was used as a complex (Gd3+-DTPA). Due to the lack of cellular absorption of gadolinium chelate and rapid clearance from the circulatory system and renal toxicity, this compound was placed inside the nanocomposite. LDL was used as a carrier for its nature of biocompatibility and biodegradability. In addition to being able to carry a large amount of gadolinium, this nanocomposite also has the ability to attach compounds on the surface that can reach the cancer cells in a targeted manner and can also enter the cell.
Experimental section
Materials
3-(trimethoxysilylpropyl)diethylenetriamine, bromoacetic acid (≥99.0%), ethanol, oleic acid (≥99.0%), ethyl(dimethylaminopropyl)carbodiimide (EDC)/N-hydroxysulfosuccinimide (Sulfo-NHS) (≥98.0%), gadolinium (III) chloride (GdCl3), low-density lipoprotein (LDL) lyophilised powder, (3-aminopropyl)triethoxysilane (APTES) (99%), dimethyl sulfoxide (DMSO), sodium hydroxide (NaOH), chelex® 100, and ketamine hydrochloride/xylazine hydrochloride were purchased from Sigma-Aldrich. 3-(4,5-Dimethylthiazol-2-yl)-2,5-diphenyltetrazolium bromide (MTT), foetal bovine serum (FBS), phosphate buffer saline (PBS) penicillin-streptomycin (10,000 U/mL), trypsin (0.25%) and phantom’s modified eagle’s (DMEM) medium were obtained from GIBCO (USA).
A rat model of cancer (BALB/C) was supplied from Imam Khomeini Hospital Research Centre, MCF-7 and HDI cell lines were purchased from Pasteur Institute of Cellular Bank, Iran.
Si-DTTA synthesis
Briefly, 3-(trimethoxysilylpropyl)diethylenetriamine (0.4 g) and bromoacetic acid (1.0 g) were dissolved in distilled water (2.0 mL) and NaOH (4.0 mL, 2 M). The reaction solution was heated to 50 °C and NaOH (6.0 mL, 2 M) was added dropwise to the solution. After stirring for an additional 3 h at 50 °C, the solvent was removed under reduced pressure to obtain viscous yellowish oil. After washing with ethanol, the first step has been done successfully (component A).
Si-DTTA conjugated with oleic acid (chelator)
A dispersion of oleic acid in distilled water was stirred for 15 min. Coupling agents (EDC/sulfo-NHS) were added to the solution and the reaction mixture was stirred at room temperature for at least 2 h. The APTES was added dropwise for 10 min and the solution was stirred at room temperature for 3 h (component B). During 1 h component B was added to component A and the final solution was centrifuged. The achieved precipitate was washed 3 times with water and ethanol. Purification of the products was carried out with a dialysis bag (cut off 12,000 Da) (component C).
Grafting of LDL to chelator (nanoprobe)
After the dissolution of component C in DMSO, LDL was added to this solution in a molar ratio of 1:500 (LDL: component C). The mixture was agitated at 37 °C for 4 h on a shaker (1200 rpm), filtered (0.22 µm millex), and dialysis against PBS (−) at 4 °C for 16 h to remove unbounded component C (Component D).
Synthesis of nanoprobe
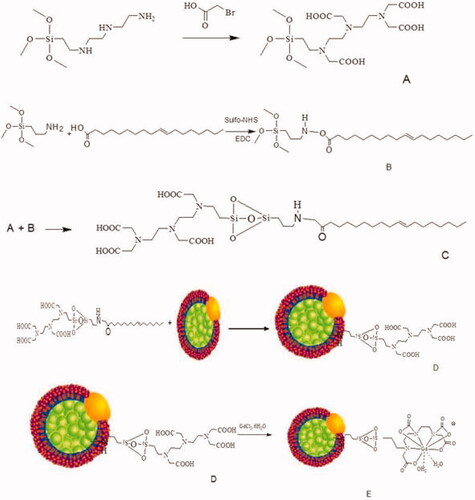
Component D (100.0 mg) was dissolved in distilled water (4.0 mL) by stirring at room temperature. A solution of GdCl3 (300 μL of a 0.50 M) was added dropwise to component D. The pH of the solution was adjusted at about 9 with the addition of NaOH (1 M). After stirring for 3 h at room temperature, the resultant solution was then concentrated to 1.0 mL ().
Figure 1. Scheme of nanoprobe synthesis.
Gadolinium loading
Chelator-oleic acid-LDL was dissolved in DMSO (0.1 mL). The dialysed LDL solution was added to the solution in a ratio of 1:600. The mixture was incubated at 37 °C in a rotary shaker (120 rpm), filtered with 0.20- micron filter, and then digested in the presence of PBS at 4 °C for 16 h to separate all unreactive compounds. GdCl3 (1.2 mM) was added to LDL at a ratio of 1400:1 (gadolinium: LDL) and the mixture was stirred at 37 °C for 4 h (120 rpm). To separate the free gadolinium, Chelex 100 (10 mM) was added to the solution to separate free gadolinium (15 equivalent Chelex 100 per each equivalent of gadolinium), and the remaining mixture was stirred at 120 rpm for 4 h at 4 °C. The Chelex 100 complex of gadolinium was filtered with a 0.22-micron filter and then dialysed against PBS (4 °C, 120 rpm, and 18 h).
Characterisation of LDL nanoprobe
Morphology, size, and distribution of synthesised nanoprobes were characterised using scanning electron microscopy (SEM) (KYKY EM-3200) and dynamic light scattering (DLS) (ZETA SIZER NANO zps, Malvern Instruments, UK). Fourier-transform infra-red spectroscopy (FTIR) ((Nicolet), Accua Chek Active®) was performed to analysis functional groups on the surface and conjugation of chelate to LDL. Gadolinium loading in nanoprobe was studied by inductively coupled plasma atomic emission spectroscopy (ICP-AES) (Optima 3100XL; PerkinElmer) for detection of gadolinium attachment to LDL nanoparticles and also for their cellular uptake. The MRI rotary-vacuum (Heidolph), 1.5 T device was used for measuring relaxation time at Imam Khomeini imaging centre in Tehran.
MRI measurements
The relaxation times of LDL nanoprobe were measured at different concentrations by using diverse spin-echo and gradient-echo protocols in 3 T MRI with a head coil. For T2 measurement, multiple spin-echo protocols were used. In total, 32 echoes with an echo spacing of 2 ms were obtained. The first echo time (TE) was 13.2, TR was 3000 ms, matrix = 256 × 256; slice thickness = 1.5 mm, and non-averaged. A FLASH protocol was used to calculate T1 maps. Repetition times of TR = 20, 50, 100, 200, 400, 600, 1000, 2000 and 3000 ms; TE was 12 ms; matrix = 256 × 256; slice thickness = 1.5 mm, and non-averaged.
Sample preparation method for phantom’s relaxation time measurements
The nanoprobe was placed in Eppendorf tubes in different gadolinium concentrations of 0.01075, 0.025, 0.043, 0.0645 and 0.086 mM and placed inside the phantom of water. Magnevist® was prepared with similar concentrations and the phantom was scanned with the axial T1, T2-weighted.
Cell preparation method to measure relaxation time
2 × 10⁵ MCF-7 cells were placed in each 6-well plate with 1 mL of culture medium and incubated for 24 h at 37 °C, 5% CO2. The culture medium was discarded and nanoprobe was added to the cells in diverse gadolinium concentrations of 0.086, 0.645, 0.043, 0.215, 0.1075, and 0.00535 mM, and incubated for 2 h. The supernatant was isolated to measure the amount of extracellular gadolinium. Cells were washed twice with 0.5 mL PBS. To each well, 0.5 mL of trypsin was added and after 5–10 min the cells were detached and suspended. Then, 1 mL of culture medium was added and neutralised the trypsin. The cells were transferred to a falcon and immediately after centrifugation (1500 rpm, 5 min at 37 °C) examined by MRI and subsequently ICP was taken to determine the amount of gadolinium in the cell. For this purpose, the cells were suspended in concentrated nitric acid (1 mL) and sonicated for 10 min, centrifuged (1500 rpm for 5 min at 37 °C) and diluted with distilled water at a ratio of 1:5.
MTT assay
1 × 10⁵ cells were cultured and incubated for 24 h, then different amounts of nano-probes (10, 50, and 100 μg/mL), and Magnevist® LDL (100 μg/mL), were added to each well. The plate was incubated for 24 h in a CO2-incubator. After completion of the incubation, the MTT colour was added at a final concentration of 0.5 mg/mL (0.1 mL for each plate). After dissolving the formazan crystals, the absorbance was measured by ELISA reader at 570 nm.
Tumour induction
Obviously, in all animal studies, the rules of Helsinki were fully complied. Animal experiments were in accordance with the protocol of behaviour of the experimental animals of the ethics committee in the researches of Shahid Beheshti University of Medical Sciences.
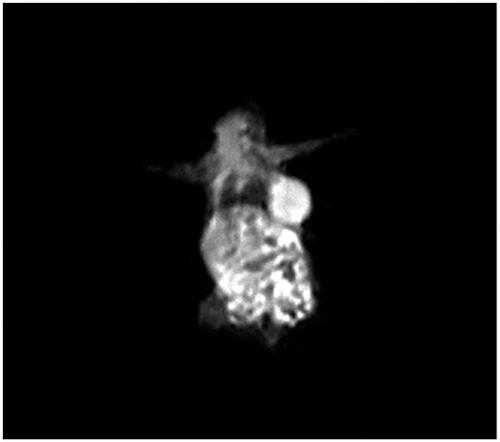
First, each mouse (BALB/c) was anaesthetised with an intraperitoneal injection of Ketamine hydrochloride/xylazine hydrochloride (at a dose of 10 mg/kg body weight), and then Murine mammary adenocarcinoma cells of 1–3 × 10⁶ were injected under the skin. About 4 weeks after injection, growth of the tumours was seen with the eye ().
Figure 2. Tumour imaging after injection of nanoprobe.
Tumour imaging
In order to prove the efficacy of the synthesised composition, the nanoprobe with the selected dose was injected into the cancer model. The injection was performed intravenously through the rat’s tail and the imaging was performed immediately after injection.
Statistical analysis
Imaging studies were based on the formula of the sampling statistics and the total sample. These studies were performed in three groups of mouse tumour model.
The T1 and T2 relaxation time were measured by the MRI device according to DicomWork and MATLAB software calculations. Random sampling method was used in cell and in vitro tests, and each experiment was performed with 3–5 repeats. The t-test, post-hoc, and Tukey test were used to perform statistical comparisons. Data were analysed using one-way ANOVA and statistical data significance was reported as p < .05.
Results and discussion
Physicochemical characterisation of LDL nanoprobe
SEM result of LDL nanoprobe shows the spherical shape of nanoparticles with minimum aggregated structures (). Size, distribution assessment and surface charge of nanoparticles were analysed using DLS (, and ). According to these obtained results, the average diameter of synthesised nanoprobe was 55 nm and 0.43 was reported as polydispersity index and also zeta potential of nanoprobe was 3.37 mV. Further studies were carried out using FTIR (). The peak area of 3421 cm−1 represents the amine group and the 1597 cm−1peak shows the formation of the carbonyl group. The strong peak associated with the Si-O-Si was reported in the 1000–1200 cm−1 range and the OH group of silane was well within the range of 3000–3400 cm−1.
Figure 3. SEM images before (A) and after (B) LDL nanoprobe formation.
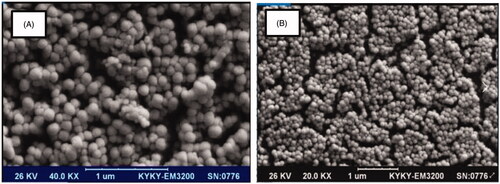
Figure 4. Size distribution analysis of LDL nanoprobe by dynamic light scattering (DLS).
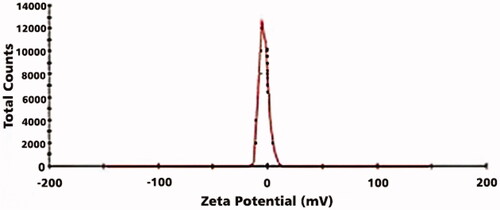
Figure 5. Zeta potential analysis of LDL nanoprobe.
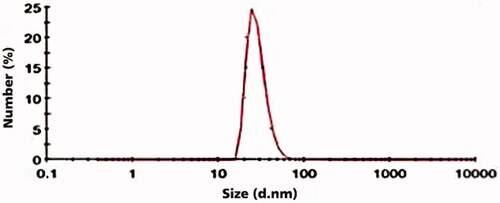
Figure 6. FTIR of (A) nanoprobe; (B) chelator; (C) oleic acid.
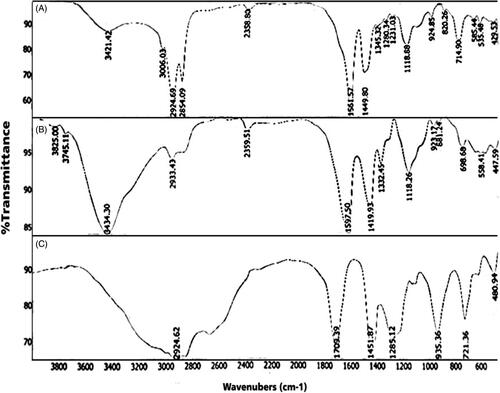
Table 1. Size and zeta potential values of LDL and nanoprobe.
Relaxivity measurements (T1, T2) of nanoprobe
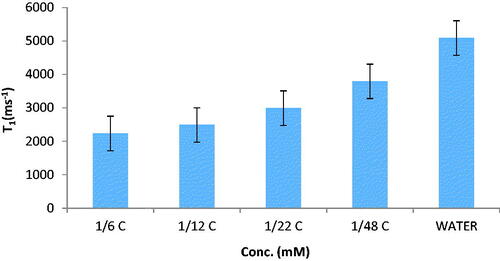
The relaxation times of nanoprobes in phantom were measured using a 1.5 T MRI. Results are displayed in and . These results show relaxation times of synthesised nanoprobe (T1 and T2 were increased with concentration. Relaxation time enhancement and decrease of relaxivity are the main challenges in MRI technique. According to the results obtained in relaxivity parameters measurement, the synthesised nanoprobe could decrease T1 and T2 with a resulting increase in contrast. This increase in MR relaxivity is attributed to the availability of water molecules to magnetic centres. This nanoprobe is contrast in cancer cell compared to phantom because it has the ability to access water and proteins in the cell.
Figure 7. Nanoprobe T2 levels compared to water in phantom.
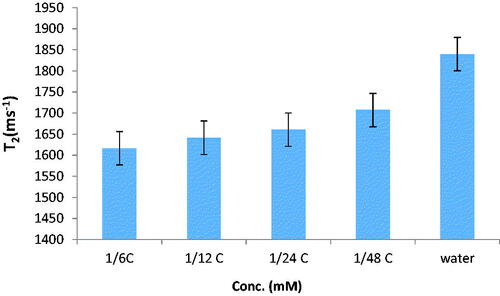
Figure 8. Nanoprobe T1 levels compared to water in phantom.
Cytotoxicity assay
Cytotoxicity of nanoprobe with a different concentration on cancer cells (MCF-7) was studied. Synthesised nanoprobe did not show any toxicity on MCF-7 (). Considering that, the study of nanoparticle toxicity is one of the basic elements in the field of biology research, MTT assay was performed to toxicity evaluation [Citation12].
Figure 9. MTT assay of cancer and normal cells in different concentration of LDL nanoprobe.
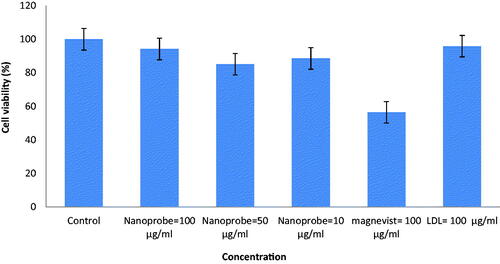
The findings of the toxicity study (MTT) suggest that this combination did not show any specific toxicity for MCF-7 cells up to 100 g/mL (p < .05). Comparison of nanoprobe and Magnevist® toxicity showed that the synthesised nanoprobes induce less toxicity in the same concentration in normal and cancerous cells compared to Magnevist®.
Intracellular uptake study
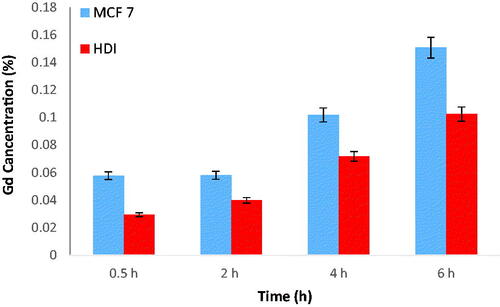
The cellular uptake of nanoprobe in cancer cells and normal cells were examined using ICP-AES. The cells were labelled and gadolinium was measured by ICP. The results are shown in . These results dictate that nanoprobe cellular uptake had regular trend with time and the amount of cellular uptake in MCF-7 was larger than HDI. Considering that one of the main aims of this project is to compare the effects of the nanoprobes in normal and cancer cells, the cellular uptake of nanoprobe is important. The absorption rate of nanoprobe in cancer cells is higher than that of normal cells and increases with time. The increase in absorption is based on the concentration, the higher the concentration, the greater the absorption.
Figure 10. The amount of LDL nanoprobe uptake in cancer and normal cells.
Animal study
1.5 Tesla MRI was used for imaging. The injection dose was 5 μmol/kg. The image obtained from mice is shown in . The use of these natural nanoparticles is beneficial in MRI imaging. In addition to carrying a lot of metal, the dose of nanoprobe is reduced. One of the major problems of Magnevist® is that it causes kidney neoplasia [Citation7]. Adaptability and cytotoxicity were one of the important points in the study of nanoscale compounds which have been found in this research.
Conclusions
The achievements of this research were the introduction of a new contrast agent (nanoprobe) for cellular imaging without cell toxicity. It seems to be possible to use this combination in clinical applications with further studies in in-vitro conditions. In addition to proving assumptions and claims, the nanoprobes have advantages such as low cost of production, good stability, non-toxicity and the possibility of imaging cancer cells.
Disclosure statement
The authors declare that they have no conflicts of interest to disclose.
References
- Li H, Gray BD, Corbin I, et al. Mr and fluorescent imaging of low-density lipoprotein receptors1. Acad Radiol. 2004;11(11):1251–1259.
- Cormode DP, Jarzyna PA, Mulder W,JM, et al. Modified natural nanoparticles as contrast agents for medical imaging. Adv Drug Deliv Rev. 2010;62(3):329–338.
- Chen W, Cormode DP, Fayad ZA, et al. Nanoparticles as magnetic resonance imaging contrast agents for vascular and cardiac diseases. Wiley Interdiscip Rev Nanomed Nanobiotechnol. 2011;3(2):146–161.
- Corbin IR, Ng KK, Ding L, et al. Near-infrared fluorescent imaging of metastatic ovarian cancer using folate receptor-targeted high-density lipoprotein nanocarriers. Nanomedicine (Lond). 2013;8(6):875–890.
- Song L, Li H, Sunar U, et al. Naphthalocyanine-reconstituted LDL nanoparticles for in vivo cancer imaging and treatment. J Int Nanomedicine. 2007;2(4):767–774.
- Almer G, Mangge H, Zimmer A, et al. J. Curr Med Chem. 1015, 22(31):3631–3651.
- Simonetta GC, Stefania L, Diego A, et al. Magnetic resonance imaging detection of tumor cells by targeting low-density lipoprotein receptors with Gd-loaded low-density lipoprotein particles. Neoplasia. 2007;9(12):1046–1056.
- Ng KK, Lovell JF, Zheng. J G. Lipoprotein-inspired nanoparticles for cancer theranostics. Acc Chem Res. 2011;44(10):1105–1113.
- Corbin IR, Li H, Chen J, et al. Low-density lipoprotein nanoparticles as magnetic resonance imaging contrast agents. Neoplasia. 2006;8(6):488–498.
- Thaxton CS, Rink JS, Naha PC, et al. Lipoproteins and lipoprotein mimetics for imaging and drug delivery. J. Adv Drug Delivery Rew. 2016;106:116–131.
- Lowell AN, Qiao H, Liu T, et al. Functionalized Low-Density lipoprotein nanoparticles for in vivo enhancement of atherosclerosis on magnetic resonance images. Bioconjugate Chem. 2012;23(11):2313–2319.
- Mehravi B, Alizadeh AM, Khodayari S, et al. J Mol Imaging Biol. 2017; 19:522–530.