
Abstract
Bone defects caused by many factors prompt further study of pathological process and restoration methods. This study was aimed to clarify the effect of erythropoietin on the repair of bone defect. We added the designated concentration of rhEPO to endothelial progenitor cells and marrow stromal cells, then detected its osteogenic and angiogenesis effects. The results showed that rhEPO promoted the proliferation of EPC and ST2 by promoting the mitosis without affecting cell apoptosis. The protein and mRNA levels of angiogenesis and osteogenic related factors exhibited higher expressions. Additionally, rhEPO encapsulated in PLGA scaffolds accelerated the new bone formation in rat calvaria bone defect model. Since the centre of bone defect was hypoxia environment, we cultured EPC and ST2 under hypoxia. SiRNA and an inhibitor of HIF-1 were used to interfere HIF-1, then the following changes of VEGF and EPO were detected. The results showed that all the factors were upregulated under the hypoxia environment. The expression of VEGF at protein and mRNA level decreased as HIF-1 was inhibited or interfered from 6 h, while the mRNA expression of EPO from 6 h and changed significantly at protein level from 12 h. Therefore, EPO is a promising factor for further studies.
Introduction
Bone defects are caused by many factors such as inflammation, tumours or trauma, which decreases the quality of life. It is very indispensable to study the pathological process and restoration of bone defects.
When fracture happens, the blood flow drops immediately, with the oxygen partial pressure in trauma centre reduces to 0–2%. Consequently, the centre of fracture or bone defect presents an oxygen-deficient environment. In severe hypoxia, hypoxia-inducible factor (HIF-1) is activated [Citation1], which acts as a transcription factor and regulates the metabolism and function of body to adapt to hypoxic situations [Citation2]. In vivo, hypoxia microenvironment increases the transcriptional activity of HIF-1α mRNA. [Citation1], consequently, expression of erythropoietin (EPO) from adult kidney is also up-regulated to adapt to the hypoxic conditions. EPO is a glycoprotein and is regarded as a crucial stimulator for erythropoiesis primarily. The secretory EPO promotes the proliferation and activation of vascular endothelial cells (VECs). Recruitment of precursor cells to the defect area is crucial for tissue regeneration. Endothelial progenitor cells (EPCs) as the precursor of VECs, contribute a lot to postnatal angiopoiesis [Citation3] and injury repair [Citation4]. When fracture happens, EPCs migrate to ischaemic area or defect sites to improve the repair of blood vessels or reorganise neovessels [Citation5]. There are various growth factors, cytokines and chemokines [Citation6–8] regulate the migration process of EPCs such as VEGF [Citation9], angiopoietin-1 [Citation10], and EPO [Citation11].
In recent times, many studies have displayed the non-hematopoietic biological effects of EPO, such as the neuroprotection effect in stroke [Citation12,Citation13], stimulation of angiogenesis and bone formation [Citation14,Citation15], organ protection against ischaemia and reperfusion injury [Citation16,Citation17]. In the study of Xu et al., they administrated erythropoietin to prevent bone loss in mice femoral head osteonecrosis model [Citation18]. EPO plays a role in bone defect via the promoting effect on mesenchymal stem cells differentiation into osteoblasts via PI3K/AKT signal pathway [Citation19]. The PI3K/AKT signal pathway is quite important and reported to interact with HIF-1α/VEGF signal pathway [Citation20,Citation21]. While HIF-1- VEGF signal pathway plays a vital role in bone remodelling and vascularisation in other studies [Citation22,Citation23].
Bone tissues possess abundant blood vessels. Therefore, complete repair of bone defect not only required the growth of new bone tissues, but also relies on highly the angiogenesis during the growth process [Citation24,Citation25]. Therefore, it is very promising to find a cytokine for remodelling of new blood vessels in bone regeneration.
Consequently, in our study, recombinant human erythropoietin (rhEPO) was applied to cells to demonstrate its positive effect on angiogenesis and osteogenesis in vitro. Moreover, scaffolds as a vehicle of rhEPO were used for in vivo study. Additionally, we simulated cell hypoxia environment and interfered the effect of HIF-1α, then investigated the expression of EPO regulated by HIF-1.
Materials and methods
Culture of EPC and ST2 and their co-cultivation
EPC and ST2 (mouse bone marrow-derived stromal cells) were purchased from (Jiniou Biological Co. Ltd, Guangzhou). EPC were cultured with M199 (Gibco), while ST2 with α-MEM (Gibco), 10% foetal bovine serum (FBS, Gibco) and 1% penicillin/streptomycin (Hyclone) were added to obtain complete medium for use. Cells were incubated at 37 °C in a humidified incubator containing 20% O2 and 5% CO2, referred as normoxic condition. A mixed composition of 94% N2, 5% CO2 and 1% O2 was used to mimic hypoxia conditions. Co-cultivation system of EPC and ST2 was realised with transwell insert, while ST2 located in the lower chamber while EPC in the upper.
Effects of rhEPO on proliferation of EPC and ST2
EPC and ST2 were seeded in a 96-well plate (2 × 10³ cells/well). rhEPO (10 U/mL, Proteintech) was added to the plate in experimental group, and the same volume of PBS as control group. At day 2, 4 and 6 after culture, mediums were wiped off, 10 μL CCK-8 and 90 μL medium were added to each well, then incubated for 2 h at 37 °C. After incubation, the absorbance value was measured at 450 nm using a UV/VIS spectrophotometer (SpectraMax M3 Multi-Molde; Molecular Devices, CA, USA).
Effects of rhEPO on cell apoptosis and cell cycle of EPC and ST2 via flow cytometry
A density of 2 × 10⁵ cells per well was used in a 6-well plate for flow cytometry detection. As mentioned before, the experimental groups were treated with rhEPO. Cells were digested with trypsin and collected into 2 mL EP tubes, then washed with pre-cooling PBS three times and centrifuged at 4 °C for 5 min at 1000 rpm. Then 1 mL binding buffer was added and centrifuged. Cells were resuspended with 100 μL binding buffer, then 5 μL PI and 5 μL FITC-Annexin V were added and mixed uniformly. The cell suspensions were incubated for 15 min at room temperature in a dark place. 400 μL binding buffers were added and mixed just before the flow cytometry detection of cell apoptosis.
The procedure of cell cycle detection was almost same as before. After obtaining the cell aggregates, 1 mL of 70% ethyl alcohol was used for keeping overnight. Then, cells were centrifuged for 5 min at 4 °C. 500 μL PI dye liquor was added to resuspend cells, then incubated for 30 min away from light before the detection.
Effects of rhEPO on angiogenesis and osteogenic of EPC and ST2
The extraction process of total RNA was the same as the conventional technique. 1 mg of total RNA were used for the synthesis of cDNA as usual, then real-time quantitative PCR was performed using SYBR® Green Supermix (Bio-Rad Laboratories, Hercules, CA, USA) as instruction. Expression of key factors (VEGF, eNOs, bFGF, BMP-2, ALP) was normalised to β-actin. The primer sequences used were listed in .
Table 1. Primer sequences.
For western blot analysis, EPC and ST2 cells were first lysed with RIPA lysis buffer for 30 min on ice. Lysates (40 μg protein each) were subjected to 12% SDS-PAGE electrophoresis, then transferred to PVDF membrane (Millipore, Billerica, MA, USA). The PVDF membranes were incubated with anti-VEGF (1:100), anti-eNOs (1:500), anti-bFGF (1:1000), anti-BMP-2 (1:500) and anti-ALP (1:1000) antibodies. After incubated with secondary antibodies against mouse or rabbit (1:5000), proteins were visualised by Tanon chemiluminescent detection (Thermo Scientific). The protein expression of angiogenesis (VEGF, eNOs, bFGF) and osteogenic markers (BMP-2, ALP) was normalised to β-actin (sc-47778 by Santa Cruz Biotechnology) (1:5000). The bands were quantified by ImageJ software.
ST2 cells were cultured in α-MEM for 21 days with EPO (10 U/mL). When the time was up, cells were washed with PBS for 3 times, then fixed with 95% alcohol for 30 min, and stained with alizarin red for 30 min. Finally, cells were observed with optical microscope.
Fabrication of electrospun scaffolds as a vehicle for rhEPO
The electrospun scaffolds were fabricated by electrospinning technology as our previous research [Citation26], which process a porous network structure. In brief, 1.8 g PLGA (75/25, Mw = 100,000 g/mol) was dissolved in the solution with chloroform and dimethyl formamide 1:1 mixed. The electrospinning parameters were used as before. The obtained membranes were then dried rigorously in a vacuum oven for one week and cut into 5 mm in diameter for animal experiments. The membranes were soaked in rhEPO aqueous solution with the concentration of 200 U/mL for 24 h before implantation as experiment group scaffolds.
Implantation in rat calvaria model
The experiments carried out on rats were approved by the “Institutional Animal Care and Use Committee” of Nanjing Stomatological Hospital. All surgeries were performed under anaesthesia to minimise suffering.
Forty SD rats aged 7–8 weeks and weighing 240–250 g were divided into four groups: control, bio-oss, PLGA, PLGA/rhEPO with 10 in each group. Animals were acclimatised 2 weeks prior to surgery. The appointed times were 4 weeks and 8 weeks after surgery, when 5 rats were sacrificed and used for following detections.
The procedure of surgeries referred to the protocol of creating the rat calvarial critical size defect [Citation27], which means a defect of the specific size does not heal by itself without intervention. Rats were anaesthetised via intraperitoneal injection of 10% chloral hydrate (0.4 mL/100g) and immobilised. The hair was shaved before a full-thickness skin incision about 1.5 cm was made along the midline to dissect the subcutaneous tissue and periosteum to expose the calvarium sufficiently. Then, a self-retaining retractor was inserted to keep the exposure, and a segmental bone defect was operated on both sides of the midline with a trephine with 5 mm in diameter. The operation areas were flushed with a large amount of saline to remove bone debris, then implanted 5 mm in diameter scaffolds as experimental groups. In the control group, the defect was left empty without any repairment. Bio-oss powder weighing 40 mg was used to fill in the defect as positive control group. The periosteum and the subcutaneous tissue were sutured with 3–0 sutures. Each rat received an intraperitoneal injection of penicillin sodium at a dose of 40,000 U for 3 successive days after surgery.
Micro-CT analysis
The rats were sacrificed and their calvarias were obtained, then fixed in 10% neural buffered formalin for 48 h and washed with PBS for micro-CT analysis. A micro-CT system (Skyscan 1176; Skyscan, Aartselaar, Belgium) was used to assess the histomorphology of the restorative calvarias. The CT parameters for scanning were: X-ray energy levels at 65 kV, current at 385 µA, and scanning interval was 18 µm. After scanning, a three-dimensional (3 D) histomorphometric analysis was performed automatically. Additionally, the bone-related parameters including bone mineral densities (BMD), the ratio of bone volume (BV)/tissue volume (TV), trabecular thickness (Tb. Th) and trabecular number (Tb. N) were used for comparison in our study.
Histological evaluation
All the rat calvarias underwent fixation in formalin, decalcification in EDTA-Na2 and dehydration using graded ethanol before embedding in paraffin and making slices at 5 µm thickness. Haematoxylin-eosin (HE) and Masson’s trichrome staining were performed separately for further observation.
Transfection of siRNA of HIF-1α of EPC cells and its identification
SiRNA of HIF-1α was prepared by chemical synthesis. The calcium phosphate co-percipitation method was taken to transfect the siRNA of HIF-1α into EPC, Western blot and PCR were used to identify whether the siRNA works.
The expression of HIF-1-EPO axis in EPC/EPC-ST2 and their co-cultivation
Cells with different treatments were divided into 5 groups: EPC, EPC + siRNA, EPC + siRNA + ST2, ST2 and ST2 + 2ME2 (an inhibitor of HIF-1α). The key molecules like HIF-1, EPO and VEGF were detected at different time points (6,12,24,48 h) from protein level and mRNA level.
EPC and ST2 cells, grown in normoxic or hypoxic conditions, were lysed with RIPA lysis buffer for 30 min on ice. The western blot and RT-PCR analysis of angiogenesis and osteogenic markers were done as mentioned before. The PVDF membranes were probed with anti- HIF-1α (1:1000), anti-EPO (1:500) and anti-VEGF (1:100) antibodies and visualised by Tanon chemiluminescent detection. At the same time, the expression of key factors (HIF-1, VEGF, EPO) at mRNA level was detected and normalised to β-actin.
Statistical analysis
SPSS software version 20.0 was used for statistical analysis. Data were expressed as the mean ± standard deviation (n = 3, at least). One-way analysis of variance and two-ways analysis of variance were used to evaluate the parameters. p Values < .05 were considered statistically significant and marked with asterisk.
Results
Effects of rhEPO on proliferation of EPC and ST2
As shown in , EPC and ST2 steadily proliferated with 6 days of culture. When rhEPO (10 U/mL) was applied to cells at day 2, 4 and 6, accelerated cell proliferation of EPC and ST2 were observed with significant differences (p < .05).
Figure 1. Effects of EPO on EPC and ST2. (A) Proliferation rate of EPC. (B) Proliferation rate of ST2. (C) Cell apoptosis of EPC. (D) Cell apoptosis of ST2. (E) Cell cycle of EPC. (F) Cell cycle of ST2. “**” means p < .01.
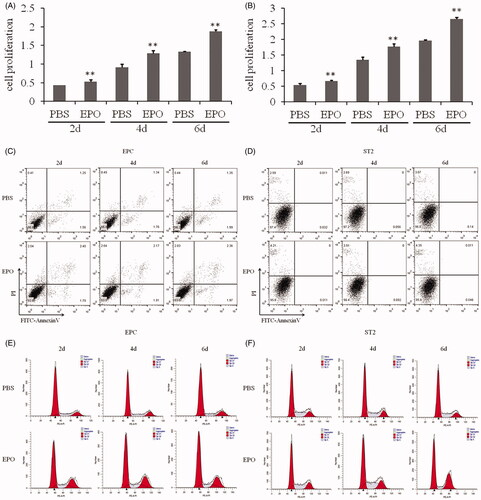
The results of flow cytometry showed that rhEPO didn’t affect the apoptosis of EPC and ST2 (). In the premise, the following detection was carried out to evaluate if rhEPO affect the mitosis. As shown in , the percentage of G2/M of both EPC and ST2 increased significantly applying rhEPO to cell culture.
Effects of rhEPO on osteogenic differentiation and angiogenesis of EPC and ST2
Western blot was carried out to detect the protein expressions of osteogenic differentiation and angiogenesis of EPC and ST2. As shown in , from 2 days culture, rhEPO could up-regulate the expression of VEGF, eNOs, bFGF, BMP-2 and ALP. As culture time prolongs, the tendency stayed the same at day 4 and day 6. It was more obvious after 6 days culture.
Figure 2. Effects of EPO on cell differentiation. (A) The Western blot results of angiogenesis key molecules like VEGF, eNOs, bFGF, and osteogenic markers like BMP-2 and ALP expressed by EPC applying EPO. (B) The Western blot results of key molecules expressed by ST2. (C) The mRNA level of key molecules expressed by EPC. (D) The mRNA level of key molecules expressed by ST2. (E) The staining results of alizarin red to evaluate the mineralisation nodes of ST2 applying EPO. “*” means p < .05.
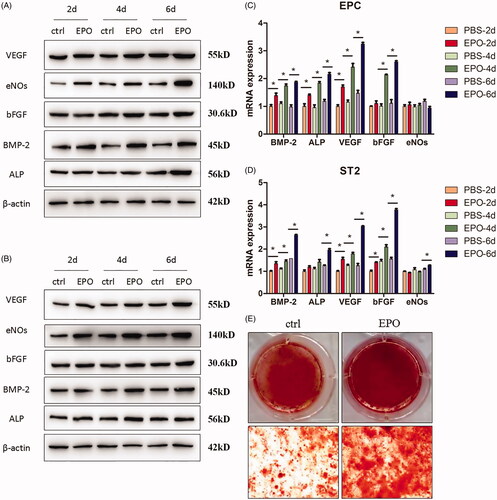
The protein level represents the expression of post-transcription, while from the mRNA level detection, the effects of rhEPO on the expression of pre-initiation could be observed. As shown in , when applying rhEPO to EPC, the mRNA expressions of BMP-2, ALP and VEGF were increased from 2 days culture, which were consistent with the protein level. While bFGF was increased after 4 days culture and there was no significant difference in eNOs expression, which were at variance with the protein expression. The mRNA expressions of BMP-2, VEGF and bFGF were increased from 2 days in ST2 (), while ALP and eNOs increased after 6 days culture.
As shown in , the mineralised nodules stained by alizarin red significantly increased when rhEPO was added to ST2 after 21 days culture. The results demonstrated that rhEPO induced the osteogenic differentiation of ST2.
In vivo osteogenesis evaluation of PLGA/rhEPO nanofibrous scaffolds
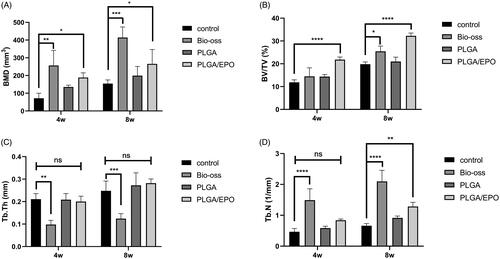
The morphology of the PLGA and PLGA/rhEPO scaffolds are presented in Supplementary Figure 1. The encapsulation of rhEPO didn’t change the porous structure of PLGA scaffolds. After 4 weeks and 8 weeks’ implantation, the calvarias were extracted and assessed with Micro-CT system. As shown in , the defect sites were marked with red circles. At 4 weeks, barely any new bone had formed in the control group (). From , we observed the defect area of Bio-oss group was filled with powders, meanwhile some of the powders shifted to the outside. In our experimental groups (), PLGA scaffolds provided a support for new bone and rhEPO encapsulated in PLGA scaffolds contributed to the process. As time goes on, the defect sites were gradually repaired by new bone formation. In the PLGA/EPO group after 8 weeks, the defect area was almost restored (). To quantify calcification and morphology of new tissue within the repaired areas, BMD, BV/TV, Tb. Th, Tb. N were measured. The PLGA/EPO group had an increased bone density than control group, while the Bio-oss group showed the highest bone density in all groups (p < .05) (). Nevertheless, the Bio-oss group exhibited the lowest Tb. Th (), which indicated there was little new bone formation. After 8 weeks, the new bone volume () and trabecular number () were increased in PLGA/EPO group, which kept pace with the 3 D results of Micro-CT. As Bio-oss filled in the defect sites, they could not be excluded when analysing the BMD.
Figure 3. Representative 3 D micro-CT images of rat calvarial defect at 4 and 8 weeks. Four groups respectively are control, Bio-oss, PLGA, PLGA/EPO were exhibited. The red circle presented the defect area.
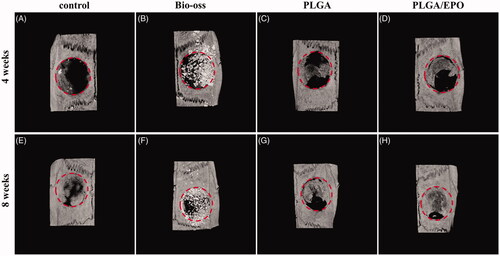
Figure 4. Quantitative analysis and bone morphology of bone defect at 4 and 8 weeks. (A) Bone mineral density. (B) The ratio of bone volume and tissue volume. (C) Trabecular thickness. (D) Trabecular number. “*” means p < .05, “**” means p < .01, “***” means p < .001, “****” means p < .0001, “ns” means p > .05.
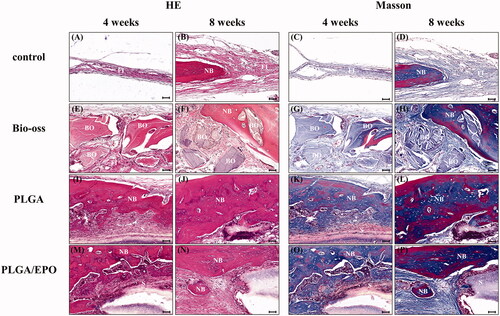
Histological sections stained with HE of calvaria defect of four groups are shown in . At 4 weeks, there were just a thin connective fibrous tissue in the control group, but no evidence of bone formation was observed (). In Bio-oss group (), the powders were surrounded by fibrous tissue and showed bits of new bone from the margin of defect. While in PLGA group (), we observed new bone formation with the support of PLGA scaffolds like an island. The rhEPO released from PLGA scaffolds contributed to new bone formation as shown in . There was more mature bone formation shown in at 8 weeks while Bio-oss powder filling in the defect without degradation (). We did HE and Masson staining and observed at the higher magnification to figure out the structure formed in the defect sites. In the control group at 8 weeks (), the defects were filled with a large amount of fibrous tissue and a handful of nascent bone compared with 4 weeks (). In the groups implanted with PLGA and PLGA/EPO scaffolds, the nascent bone formed next to the scaffolds. Moreover, in PLGA/EPO group, part of new bone inserted into the central of the scaffolds and exhibited abundant vascularisation at 8 weeks (). The Masson staining helped us distinguishing the fibrous tissues and nascent bone more clearly.
Figure 5. HE staining of four groups from rat calvaria defect model after 4 and 8 weeks. Scale bar is 500 µm.
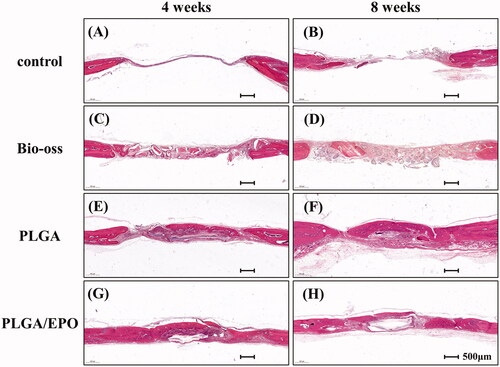
Figure 6. HE and Masson’s trichrome staining of defects at higher magnification. Scale bar is 50 µm. FI, fibrous tissue; NB, nascent bone; s, scaffold; BO, Bio-oss.
Expression of HIF-1-EPO signalling pathway in EPC/ST2
As we all know, the centre of bone defect presents an oxygen-deficient environment. On the base of rhEPO’s positive effect on bone defect repair, we supposed that the positive effect was concerned with the hypoxia. EPC/ST2 were cultured under hypoxia and normoxia environment, then treated with siRNA-HIF-1α or 2ME2 to block the effect of HIF-1. As shown in Supplementary Figure 2, the band of HIF-1α with siRNA was attenuated significantly, and the quantification also confirmed it (p < .05). The mRNA level expression was consistent with the protein level. To investigate the change of EPO in EPC/ST2, western blot and real-time PCR were carried out to detect their expression at protein level and mRNA level. Results at different time points were collected to see if the expression changes over time.
As shown in and , the protein expression and mRNA expression were detected after 6 h treatment. The expression of HIF-1 in EPC was markedly increased under hypoxic condition, which was understandable. The siRNA anti HIF-1 could down-regulate the expression of HIF-1, consequently, the downstream molecule VEGF decreased significantly at protein level and mRNA level. The co-cultivation condition of EPC and ST2 let the secretion of cytokines from ST2 affect the EPC cells. From the western bands and quantification, we observed that the HIF-1 and VEGF expression of group ST2 + EPC + siRNA were increased compared with group EPC + siRNA. This phenomenon lasted to 12 h, but it was not obvious since 24 h (). Except the siRNA interference, 2ME2 as an inhibitor of HIF-1α was used to block the effect of HIF-1. As a result, expression of HIF-1 and VEGF decreased apparently. The mRNA level of EPO decreased with the use of siRNA or 2ME2, but it did not show difference at the protein expression. These results indicated that once the effect of HIF-1 was blocked, the downstream molecule VEGF decreased after 6 h treatment at mRNA level and protein level, but the protein level of EPO did not change at early stage.
Figure 7. The expression of key molecules at protein level at 6 h and 12 h. (A) The bands of Western blot after 6 h. (B) The quantification of grey values of A. (C) The bands of Western blot after 12 h. (D) The quantification of grey values of C. “+” and “N” means normoxic condition, “–” and “H” means hypoxic condition. “*” means p < .05, “#” means p > .05.
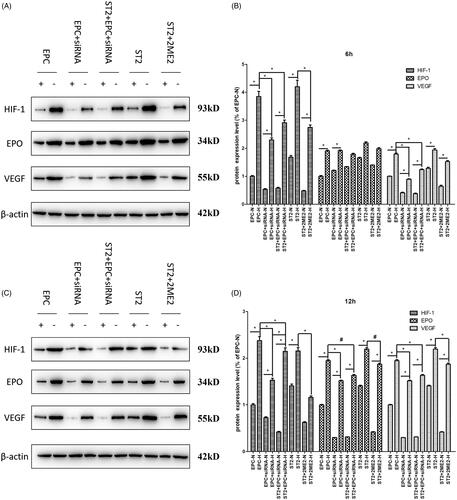
Figure 8. The expression of key molecules at protein level at 24 h and 48 h. (A) The bands of Western blot after 24 h. (B) The quantification of grey values of E. (C) The bands of Western blot after 48 h. (D) The quantification of grey values of G. “+” and “N” means normoxic condition, “–” and “H” means hypoxic condition. “*” means p < .05, “#” means p > .05.
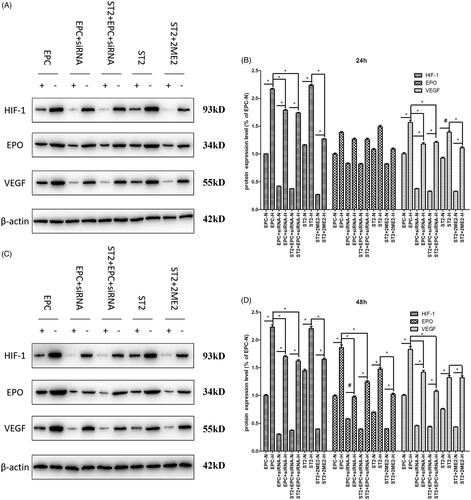
As treatment time prolongs, the down-regulation of the expression of HIF-1 was obvious. The protein expression of EPO was also decreased due to the siRNA interference effect of HIF-1 in EPC and the effect of 2ME2 in ST2 after 12 h treatment (shown in ). The mRNA level () kept consistent with the protein level.
Figure 9. The expression of key molecules at mRNA level at different time points. (A) 6 h, (B) 12 h, (C) 24 h, (D) 48 h. “+” means normoxic condition, “–” means hypoxic condition. “*” means p < .05.
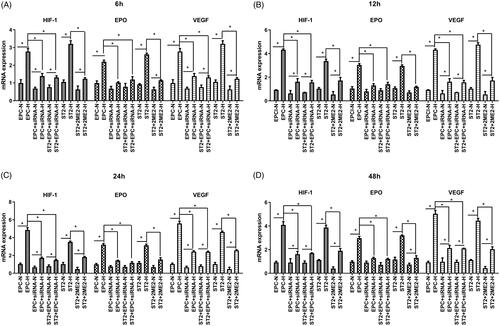
Results at different time points demonstrated that HIF-1 significantly decreased by the influence of siRNA and 2ME2 from the beginning, therewith, down-regulated the expression of downstream molecule VEGF. The expression of EPO was influenced by the oxygen concentration at the beginning, then decreased as the down-regulation of HIF-1 from 12 h.
Discussions
Studies have shown that erythropoietin may be an essential regulator for erythropoiesis and bone homeostasis [Citation28]. The erythropoiesis effect of EPO was induced through the activation of the EPO receptor on precursor cells so as to stimulate proliferation and differentiation [Citation29]. In addition to erythropoiesis, EPO played a vital role in the regulation of bone homeostasis [Citation30]. Studies of different bone defects models show that the administration of exogenous EPO could increase bone volume and promote regeneration in defect areas. In this study, we applied exogenous EPO to EPC and ST2, and found that EPO treatment promoted cell proliferation by promoting mitosis. In addition, the dose of EPO (10 U/mL) used in this study didn’t affect the cell apoptosis. Other studies [Citation31] used the dose of 30 U/mL EPO, and the up-regulating effect on eNOS and VEGF was decreased compared with EPO (20 U/mL). EPO at the dose of 30 U/mL might be too high and exhibited a negative effect instead.
As mentioned before, angiogenesis plays a vital role in bone formation. Consequently, we detected the key factors of osteogenesis and angiogenesis to show the effect of exogenous EPO on different cells. VEGF is an essential factor for angiogenesis functions [Citation32,Citation33]. According to the literature, VEGF regulates the coordination of angiogenesis and bone formation [Citation34]. The bFGF is also a key pro-angiogenic factor which promote angiogenesis via promoting the maturity, migration and proliferation of endothelial cells [Citation20]. The VEGF, eNOS and bFGF all increased with the effect of EPO, which indicated that EPO promoted the angiogenesis of EPC and ST2. In the study of femoral segmental defect model of mice, rhEPO was used to repair the defect, and the results showed that EPO promoted bone formation and cell proliferation, moreover increased the angiogenesis mediated by VEGF [Citation15,Citation35]. EPO can increase the expression of VEGF and promote angiogenesis, which in accordance with our results. Similarly, the expression of BMP2 and ALP were upregulated by rhEPO treatment. Kim’s [Citation19] study showed that EPO can improve MSCs to differentiate into osteoblasts. A variety of studies have concerned about the mechanism of EPO promoting osteogenesis. According to Shiozawa’s study [Citation36], EPO exhibits osteogenesis effect via JAK/STAT signal path. Other studies [Citation37] suggested that EPO has effect on regulating EphrinB2/EphB4 signal path. In vivo study, we used a PLGA scaffold as a vehicle for rhEPO, since the electrospun scaffold held a larger specific surface area and absorbed rhEPO with porous structure. The dose of rhEPO was 200 U/mL according to the literature [Citation38]. In vivo studies, the dose of EPO varied from 250 IU/kg [Citation33] to 6000 U/kg [Citation20] with different animal models. In the histological results, we can see more neovascularization in PLGA/EPO group, which proved the efficacy of EPO. Consequently, EPO exerted two aspect of functions on bone repairing. Certainly, the downside is that the soaking method was not the best choice for loading rhEPO, which is yet to be improved in follow-up experiments.
HIF-1 is a protein activated by hypoxia environment and binds with DNA [Citation39]. HIF-1 is a short-lived macromolecule composed of α-subunit and β-subunit, while HIF-1α is a critical regulator of transcriptional response to a hypoxic environment and degrades in normal oxygen environment. In the last few years, a large amount of researches are done to study the neurogenesis effect of HIF-1α [Citation40]. In our results, we did cell culture at normoxic and hypoxia, then detected the expression level of HIF-1 with a result of higher level under hypoxia condition. This finding indicated that HIF-1α can be directly regulated for hypoxia adaptation.
Hypoxia results in an increase of EPO level via activation of HIF-1-EPO pathway, which protects the organs from hypoxic conditions [Citation1]. When HIF-1α was interfered with siRNA, the expression of EPO in EPC decreased after 12 h, while the early detection at 6 h showed no significant difference. However, mRNA level of EPO started to down-regulate from 6 h. This result revealed that there are some changes at pre-transcriptional level, and it takes some time for EPO accumulation, while 6 h was too short to see the difference of protein expression. Gene and protein expression tend to be consistent starting from 12 h. From our results, HIF-1α promoted the expression of VEGF, which was regulated via HIF-1-VEGF pathway. The signalling through VEGF in both a paracrine and an autocrine manner is required for the homeostasis of adult vessels [Citation41]. The expression of EPO and VEGF in ST2 treated with 2ME2 kept consistent with in EPC. This demonstrated that HIF-1-EPO axis plays a vital role in different cells. As shown in , when ST2 was co-cultured with EPC, the expression of EPO at 48 h was upregulated compared with EPC + siRNA. This can be explained the ST2 promote the expression of EPO via a paracrine manner. Another study demonstrated that osteoblasts are also able to produce EPO under conditions of constitutive HIF stabilisation, thereby to promote erythropoiesis [Citation30].
Conclusion
In conclusion, EPO has a significant effect on angiogenesis and osteogenesis, and EPO can be induced by the hypoxia environment of defect, which first induces the expression of HIF-1, then up-regulates the downstream key factors like EPO and VEGF. EPO and VEGF promote the angiogenesis to adapt to the hypoxia environment and recover the oxygen content. Consequently, EPO is a promising factor for further studies.
Supplementary_information_clean_version1.docx
Download MS Word (511.8 KB)Disclosure statement
The authors declare that they have no conflicts of interest to disclose.
Additional information
Funding
Related Research Data
References
- Bogdanovski DA, DiFazio LT, Bogdanovski AK, et al. Hypoxia-inducible-factor-1 in trauma and critical care. J Crit Care. 2017;42:207–212.
- Cheng YL, Park JS, Manzanero S, et al. Evidence that collaboration between HIF-1alpha and Notch-1 promotes neuronal cell death in ischemic stroke. Neurobiol Dis. 2014;62:286–295.
- Gomez-Cerezo JF, Pagan-Munoz B, Lopez-Rodriguez M, et al. The role of endothelial progenitor cells and statins in endothelial function: a review. Cardiovasc Hematol Agents Med Chem. 2007;5(4):265–272.
- Moubarik C, Guillet B, Youssef B, et al. Transplanted late outgrowth endothelial progenitor cells as cell therapy product for stroke. Stem Cell Rev and Rep. 2011;7(1):208–220.
- Richardson MR, Yoder MC. Endothelial progenitor cells: quo vadis?. J Mol Cell Cardiol. 2011;50(2):266–272.
- Orimo A, Gupta PB, Sgroi DC, et al. Stromal fibroblasts present in invasive human breast carcinomas promote tumor growth and angiogenesis through elevated SDF-1/CXCL12 secretion. Cell. 2005;121(3):335–348.
- Rosell A, Arai K, Lok J, et al. Interleukin-1beta augments angiogenic responses of murine endothelial progenitor cells in vitro. J Cereb Blood Flow Metab. 2009;29(5):933–943.
- Song Y, Li X, Wang D, et al. Transcription factor Kruppel-like factor 2 plays a vital role in endothelial colony forming cells differentiation. Cardiovasc Res. 2013;99(3):514–524.
- Li X, Han Y, Pang W, et al. AMP-activated protein kinase promotes the differentiation of endothelial progenitor cells. Arterioscler Thromb Vasc Biol. 2008;28(10):1789–1795.
- Balaji S, Han N, Moles C, et al. Angiopoietin-1 improves endothelial progenitor cell-dependent neovascularization in diabetic wounds. Surgery. 2015;158(3):846–856.
- Bahlmann FH, DeGroot K, Duckert T, et al. Endothelial progenitor cell proliferation and differentiation is regulated by erythropoietin. Kidney Int. 2003;64(5):1648–1652.
- Ehrenreich H, Hasselblatt M, Dembowski C, et al. Erythropoietin therapy for acute stroke is both safe and beneficial. Mol Med. 2002;8(8):495–505.
- Ehrenreich H, Weissenborn K, Prange H, et al. Recombinant human erythropoietin in the treatment of acute ischemic stroke. Stroke. 2009;40(12):e647–656.
- Hankenson KD, Dishowitz M, Gray C, et al. Angiogenesis in bone regeneration. Injury. 2011;42(6):556–561.
- Holstein JH, Orth M, Scheuer C, et al. Erythropoietin stimulates bone formation, cell proliferation, and angiogenesis in a femoral segmental defect model in mice. Bone. 2011;49(5):1037–1045.
- Fiordaliso F, Chimenti S, Staszewsky L, et al. A nonerythropoietic derivative of erythropoietin protects the myocardium from ischemia-reperfusion injury. Proc Natl Acad Sci USA. 2005;102(6):2046–2051.
- Schmeding M, Hunold G, Ariyakhagorn V, et al. Erythropoietin reduces ischemia-reperfusion injury after liver transplantation in rats. Transpl Int. 2009;22(7):738–746.
- Xu T, Jin H, Lao Y, et al. Administration of erythropoietin prevents bone loss in osteonecrosis of the femoral head in mice. Mol Med Rep. 2017;16(6):8755–8762.
- Kim J, Jung Y, Sun H, et al. Erythropoietin mediated bone formation is regulated by mTOR signaling. J Cell Biochem. 2012;113(1):220–228.
- Chen J, Gu Z, Wu M, et al. C-reactive protein can upregulate VEGF expression to promote ADSC-induced angiogenesis by activating HIF-1alpha via CD64/PI3k/Akt and MAPK/ERK signaling pathways. Stem Cell Res Ther. 2016;7(1):114.
- Mahfouz N, Tahtouh R, Alaaeddine N, et al. Gastrointestinal cancer cells treatment with bevacizumab activates a VEGF autoregulatory mechanism involving telomerase catalytic subunit hTERT via PI3K-AKT, HIF-1alpha and VEGF receptors. PLoS One. 2017;12(6):e0179202.
- Andersen TL, Sondergaard TE, Skorzynska KE, et al. A physical mechanism for coupling bone resorption and formation in adult human bone. Am J Pathol. 2009;174(1):239–247.
- Zou D, Han W, You S, et al. In vitro study of enhanced osteogenesis induced by HIF-1alpha-transduced bone marrow stem cells. Cell Prolif. 2011;44(3):234–243.
- Mao Z, Shi H, Guo R, et al. Enhanced angiogenesis of porous collagen scaffolds by incorporation of TMC/DNA complexes encoding vascular endothelial growth factor. Acta Biomater. 2009;5(8):2983–2994.
- Yu H, VandeVord PJ, Mao L, et al. Improved tissue-engineered bone regeneration by endothelial cell mediated vascularization. Biomaterials. 2009;30(4):508–517.
- Yu Y, Ren S, Yao Y, et al. Electrospun fibrous scaffolds with iron-doped hydroxyapatite exhibit osteogenic potential with static magnetic field exposure. J Biomed Nanotechnol. 2017;13(7):835–847.
- Spicer PP, Kretlow JD, Young S, et al. Evaluation of bone regeneration using the rat critical size calvarial defect. Nat Protoc. 2012;7(10):1918–1929.
- Eggold JT, Rankin EB. Erythropoiesis, EPO, macrophages, and bone. Bone. 2018;119:36–41
- Ebert BL, Bunn HF. Regulation of the erythropoietin gene. Blood. 1999;94(6):1864–1877.
- Rankin EB, Wu C, Khatri R, et al. The HIF signaling pathway in osteoblasts directly modulates erythropoiesis through the production of EPO. Cell. 2012;149(1):63–74.
- Wang D, Song Y, Zhang J, et al. AMPK-KLF2 signaling pathway mediates the proangiogenic effect of erythropoietin in endothelial colony-forming cells. Am J Physiol Cell Physiol. 2017;313(6):C674–C685.
- Rissanen TT, Vajanto I, Hiltunen MO, et al. Expression of vascular endothelial growth factor and vascular endothelial growth factor receptor-2 (KDR/Flk-1) in ischemic skeletal muscle and its regeneration. Am J Pathol. 2002;160(4):1393–1403.
- Wang J, Fu X, Jiang C, et al. Bone marrow mononuclear cell transplantation promotes therapeutic angiogenesis via upregulation of the VEGF-VEGFR2 signaling pathway in a rat model of vascular dementia. Behav Brain Res. 2014;265:171–180.
- Weinstein RS, Wan C, Liu Q, et al. Endogenous glucocorticoids decrease skeletal angiogenesis, vascularity, hydration, and strength in aged mice. Aging Cell. 2010;9(2):147–161.
- Wan L, Zhang F, He Q, et al. EPO promotes bone repair through enhanced cartilaginous callus formation and angiogenesis. PLoS One. 2014;9(7):e102010.
- Shiozawa Y, Jung Y, Ziegler AM, et al. Erythropoietin couples hematopoiesis with bone formation. PLoS One. 2010;5(5):e10853.
- Li C, Shi C, Kim J, et al. Erythropoietin promotes bone formation through EphrinB2/EphB4 signaling. J Dent Res. 2015;94(3):455–463.
- Patel JJ, Modes JE, Flanagan CL, et al. Dual delivery of EPO and BMP2 from a novel modular poly-varepsilon-caprolactone construct to increase the bone formation in prefabricated bone flaps. Tissue Eng Part C Methods. 2015;21(9):889–897.
- Lu J, Jiang L, Zhu H, et al. Hypoxia-inducible factor-1alpha and erythropoietin expression in the hippocampus of neonatal rats following hypoxia-ischemia. J Nanosci Nanotechnol. 2014;14(8):5614–5619.
- Rayner BS, Duong TT, Myers SJ, et al. Protective effect of a synthetic anti-oxidant on neuronal cell apoptosis resulting from experimental hypoxia re-oxygenation injury. J Neurochem. 2006;97(1):211–221.
- Cubranic A, Redzovic A, Dobrila-Dintinjana R, et al. Mystery story about Erythropoietin (Epo) and Erythropoietin receptor (Epor) are disguised?. Hepatogastroenterology. 2015;62(139):585–589.