
 ?Mathematical formulae have been encoded as MathML and are displayed in this HTML version using MathJax in order to improve their display. Uncheck the box to turn MathJax off. This feature requires Javascript. Click on a formula to zoom.
Abstract
Background
The abnormal expression Dopamine D1 receptor (DRD1) gives rise to the dysfunction of dopaminergic neurotransmitter and may be associated with the occurrence of schizophrenia. MicroRNAs (miRNAs) can regulate the DRD1 expression by binding 3’UTR and be involved in the post-transcriptional regulation.
Methods
We first constructed the pmirGLO-recombined vectors of series of DRD1 gene 3′UTR-truncated fragments and performed the luciferase receptor assay to screen the underlying 3′UTR sequence targeted by miRNAs. Then, we predicted the potential miRNAs binding the target sequence and confirmed their effects using luciferase receptor assay after transfection of the miRNA mimics/inhibitors. We also examined the effects of the miRNA on the endogenous DRD1 expression.
Results
We found that the DRD1 3′UTR ranging from –12 to +1135 bp was essential for the post-transcriptional regulation of miRNAs. The deletion of –12 to +154 bp fragment significantly increased the luciferase expression but not the mRNA expression. The miRNA-15a, miRNA-15b and miRNA 16 affected DRD1 expression in HEK293, U87, SK-N-SH and SH-SY5Y cell lines.
Conclusion
The miRNA-15a, miRNA-15b and miRNA-16 inhibit the human dopamine D1 receptor expression by targeting 3′UTR –12 to +154 bp.
DRD1 3′UTR ranging from –12 to +1135 bp was essential for the post-transcriptional regulation of miRNAs.
The deletion of –12 to +154 bp fragment significantly increased the luciferase expression but not the mRNA expression.
The miRNA-15a, miRNA-15b and miRNA 16 affected DRD1 expression in different cell lines, respectively.
Highlights
Background
Schizophrenia is a public health problem, considering that it affects about 1% of adults and is related to significant morbidity and premature mortality [Citation1]. The recent studies have reported that dysregulation of dopaminergic neurotransmission is involved in the pathogenesis of schizophrenia [Citation2,Citation3] and the reducing of dopamine neurotransmission in the prefrontal cortex probability increases the susceptibility of schizophrenia [Citation4]. As an endogenous neurotransmitter, dopamine exerts its function by binding its receptor in the synaptic gap. Therefore, dopamine receptors play an important role in mediating dopamine function and are likely related to the occurrence of schizophrenia.
The dopamine receptor is G protein-coupled receptor and includes two types: D1-like type and D2-like type. The activation of D1-like receptors increases the cyclic adenosine monophosphate (cAMP) and Ca2+ levels by activating adenylyl cyclase, whereas the activation of D2-like receptors decreases the adenylyl cyclase and cAMP levels [Citation5]. The former includes dopamine receptor D1 (DRD1) and dopamine receptor D5, whereas the later includes dopamine receptor D2, D3 and D4. Dopamine receptor D1 is highly expressed in the basal ganglia and prefrontal cortical region in the brain [Citation6]. It can up-regulate the activity of adenylate cyclase [Citation7]. Dopamine receptor D1 is involved in the regulation of hippocampal synaptic plasticity and memory, motor control and social cognition behaviour [Citation8–10].
The DRD1 gene polymorphisms were reported to be related with the occurrence of schizophrenia [Citation11]. Its expression significantly decreased in the basal ganglia of the patients with schizophrenia [Citation12]. Furthermore, the rs4532 variation increased the treatment resistance risk in a dose–response gradient mode [Citation13]. Additionally, acute sleep deprivation enhanced DRD1 expression in the lateral hypothalamus and enhanced avoidance learning and spatial memory [Citation14]. The expression profile analysis of striatum protein in dyskinetic animals found an over-activation of the DRD1 signalling pathway [Citation15]. Usually, the abnormal expression amount of DRD1 is more common than the change of the receptor structure. Thus, the exploration of the regulation of DRD1 is necessary and interesting, taken into account its importance.
MicroRNAs (miRNAs) are a class of small non-coding RNAs (∼20–23 nt) that regulate gene expression [Citation16]. Presently, approximately 70% of known miRNAs are expressed in the nervous system and their expression usually shows a high degree of spatial and temporal specificity [Citation17]. The specificity of miRNA targeting is determined by the nature and extent of the complementarity between a miRNA and its target sequence in the 3′ untranslated region (3′UTR) of mRNA [Citation18]. Huang et al. [Citation18,Citation19] reported that miR-504 increased the DRD1 expression by targeting the 3′UTR and this up-regulation was attenuated by the G allele of rs686 polymorphism. Tobon et al. showed that the 1277 bp 3′UTR of the mouse DRD1 mRNA was necessary for mediating the post-transcriptional regulation and recognized by miRNA miR-142-3p to inhibit the DRD1 expression in the mouse CATH.a-derived catecholaminergic cell line [Citation20]. Additionally, the overexpression of miR-382 significantly attenuated the increasing of DRD1 induced by alcohol and then decreased the voluntary intake of and preference for alcohol in the rats [Citation21].
In this study, we used four cell lines (HEK293, U87, SK-N-SH and SH-SY5Y) as the in vitro model to investigate the underlying post-transcriptional regulation of the human DRD1. We demonstrated that the –12 to +1135 bp (all numbers given are relative to the next base [+1] after the stop codon) of 3′UTR is essential and necessary for DRD1 post-transcriptional regulation using luciferase receptor gene assay and real-time polymerase chain reaction (RT-PCR). The deletion of –12 to +154 bp fragment significantly increased the luciferase expression but not the mRNA expression in all of the four cell lines. After miRNA prediction, we subsequently examined the effects of miR-15a, miR-15b, miR-16, miR-424 and miR-497 on the DRD1 expression and found that miR-15a, miR-15b and miR-16 exhibited the various inhibitions on the endogenous DRD1 expression in the four cell lines.
Materials and methods
Recombined vector construction of DRD1 3′UTR fragment
Primers for PCR were designed according to the genomic sequence of the human DRD1 gene (). A fragment spanning from –12 to +1135 bp of DRD1 3′UTR was first amplified and then used as the template to generate the other amplicons (+155 to +1135 bp, +272 to +1135 bp, +348 to +1135 bp, +443 to +1135 bp, +498 to +1135 bp, +633 to +1135 bp, +709 to +1135 bp and +865 to +1135 bp) using PCR. The primers contained a NheI or XhoI site at the 5′ end. The purified fragments were cloned into pGM-T vector using pGM-T Ligation® Kit (TIANGEN, Beijing, China) and subsequently transformed into Trans5α competent cells (TRANSGEN BIOTECH, Beijing, China) using the heat shock method [Citation22]. Plasmids were extracted with SanPrep® Column Enodotoxin-Free Plasmid Mini-Preps Kit (Sangon Biotech, Shanghai, China) for sequencing confirmation. The recombined pGM-T vectors containing the different 3′UTR fragments were sub-cloned into the pmirGLO dual-luciferase miRNA target expression vector (Promega, Madison, WI) using NheI and XhoI sites.
Table 1. Primers for recombined vector construction of DRD1 gene 3′UTR fragment.
Cell culture
The human embryonic kidney HEK293 and the human glioblastoma U87 cell lines were cultured in HyClone® DMEM/high glucose medium with 10% fetal bovine serum (FBS) and 100 units/mL penicillin/streptomycin (Thermo Fisher Scientific, Waltham, MA). The human neuroblastoma SK-N-SH cell line was cultured in DMEM high-glucose medium with 0.110 g/L sodium pyruvate containing 15% FBS and 100 units/mL penicillin/streptomycin (KeyGEN BioTECH, Nanjing, China). The human neuroblastoma SH-SY5Y cell line was cultured in HyClone DMEM/F12 (1:1) medium with 10% FBS and 100 units/mL penicillin/streptomycin (Thermo Fisher Scientific).
All of the four cell lines were cultured in a 37 °C incubator with a humidified 5% CO2. The cells were plated and grown about 90% confluence before transfection.
Transient transfection and luciferase receptor assay
Transient transfection of pmirGLO-recombined vectors of DRD1 3′UTR fragment
After grown to 90% confluence, the cells were seeded in 24-well plates (2 × 10⁵ cells per well) and then cultured 24–36 h. The constructed pmirGLO vectors (1.0 μg per well) were transfected into the cells using Lipofectamine® 2000 reagent in light of the manufacturer’s protocol (Invitrogen™, California). After incubation for 24 h, the cell lysates and the total RNA were collected and used in the following luciferase receptor assay and RT-PCR, respectively. Transfection of every vector was conducted in triplicate in 24-well plates in three independent experiments.
Transient co-transfection of pmirGLO-recombined vectors of DRD1 3′UTR fragment
The constructed pmirGLO vectors (0.1 μg per well) were co-transfected with 1 μL miRNA mimic/inhibitor (0.264 μg) or miRNA negative control (NC) mimic/inhibitor (GenePharma, Shanghai, China) into the exponential growth cells using Lipofectamine® 2000 (Invitrogen™). After incubation for 24 h, the cell lysates were collected and used in the following luciferase receptor assay. Transfection of every vector was conducted in triplicate in 24-well plates in three independent experiments.
Transient transfection of miRNA mimic/inhibitor
After grown to 90% confluence, the cells were seeded in 6-well plates (1 × 10⁶ cells per well). Five microlitre of miRNA mimic/inhibitor (1.32 μg) or miRNA NC mimic/inhibitor was transfected into the cells using Lipofectamine® 2000 reagent (Invitrogen™). After incubation for 48 h, the cell proteins and the total RNA were extracted from SK-N-SH cells. After incubation for 72 h, the cell proteins and the total RNA were extracted from HEK293, U87 and SH-SY5Y cells. Subsequently, the expression of the endogenous DRD1 was measured using Western blot and RT-PCR.
Luciferase receptor assay
The cell lysates were prepared and measured using Dual-Luciferase® Reporter Assay System (Promega) according to the manufacturer’s protocol. Firefly luciferase activity (LUC) from cell lysates for the pmirGLO recombined vectors was normalized to Renilla luciferase activity (TK). Normalized activities (LUC/TK) were the relative fluorescence intensity. Each assay was performed in triplicate in three independent experiments.
Quantitative RT-PCR
The total RNA was extracted from HEK293, U87, SK-N-SH and SH-SY5Y cell lines after transfection according to the following procedures. The 0.4-ml Trizol was added to each well in 24-well plates or the 0.6-ml Trizol was added to each well in 6-well plates. The cell lysate was successively treated with chloroform, isopropanol and 75% ethanol. Then, the total RNA was dissolved in 15 μL DEPC for several hours and quantified by the UV spectrophotometer. Quantitative RT-PCR was performed with SYBR Premix Ex Taq II (TAKARA BIO INC, Dalian, China) using the 7900HT fast RT PCR system (Thermo Fisher Scientific). Reverse transcription conditions consisted of 37 °C for 15 min, 85 °C for 5 s and 4 °C for 10 min. Forty cycles of PCR were performed at 95 °C for 15 s and 60 °C for 1 min according to the manufacturer’s instructions. β-Actin was used as the reference gene. The relative levels of gene expression were calculated as ΔCt = Ct, gene – Ct, reference, and the fold change of gene expression was calculated using the 2–ΔΔCt method. The experiments were performed in triplicate using the following primers: pmirGLO-LUC, Forward: 5′-TACACCTTCGTGACTTCCCATTT-3′ and Reverse: 5′-ATGACTGAATCGGACACAAGCG-3′; pmirGLO-TK, Forward: 5′-GGGAAGGGACTGGCTGCTAT-3′ and Reverse: 5′-TGCTCTTCGTCCAGATCATCCT-3′; DRD1, Forward: 5′-AAGGCAAGGCGTTTGGAGAGC-3′ and Reverse: 5′-GCTGTTGCTTTTCTGGTGGTGACAG-3′; β-actin, Forward 5′-ATCAGCAAGCAGGAGTATGACGAGT-3′ and Reverse 5′-GCTGTCACCTTCACCGTTCCA-3′. Each assay was performed in triplicate in three independent experiments.
Western blot
The total protein of HEK293, U87, SK-N-SH and SH-SY5Y cell lines after transfection was extracted by the NP-40 and PMSF, respectively. The protein samples were quantified by bicinchoninic acid assay [Citation23], separated by electrophoresis in the 10% denatured polypropylene gel and transferred using the PVDF membrane for 1 h at 100 V. After blocking with 8% skimmed milk, the primary antibody of DRD1 (Abcam, Cambridge, USA) and β-actin (Abbkine, California, USA) was diluted with the TBS-T at a ratio of 1:750 and 1:2000, respectively. Then, the membrane was incubated overnight at 4 °C. After being washed three times with the TBS-T, the diluted secondary antibody (Abbkine) (1:5000) was incubated with the membrane for 2 h. Finally, the expression of the target protein was detected by ECL luminescent solution and the Tanon-5500 chemiluminescence imaging analysis system (Tanon, Shanghai, China). Each sample was repeated by three complete experiments. The molecular weight of DRD1 and β-actin protein are 75 and 42 kDa, respectively. The protein expression of each sample was qualified by the gray value using ImageJ software [Citation24].
Prediction of miRNA
The miRNAs that potentially bound DRD1 3′UTR were predicted by TargetScanHuman 7.2 (www.targetscan.org) [Citation25] and microRNA.org (http://www.microrna.org) [Citation26]. The miRNAs screened by both of the databases were finally selected and analyzed in our study.
Statistics
The relative fluorescence intensity (LUC/TK) of each sample was presented as the mean () ± standard deviation (SD). The mean differences between multiple samples were determined by one-way analysis of variance (ANOVA), whereas the pairwise comparisons between the means of multiple samples were determined using LSD T-test. The differences of the mRNA expression between multiple samples were measured by 2–ΔΔCt method. The p value of < .05 indicated statistically significant differences. The differences of the protein expression between multiple samples were compared using independent sample T-test. All the statistical analyses were calculated using SPSS 20.0 software (IBM Corp., Armonk, NY).
Results
Identification of the DRD1 essential 3′UTR and its inhibitory effects on gene expression
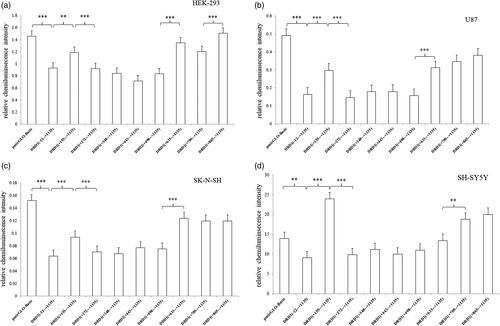
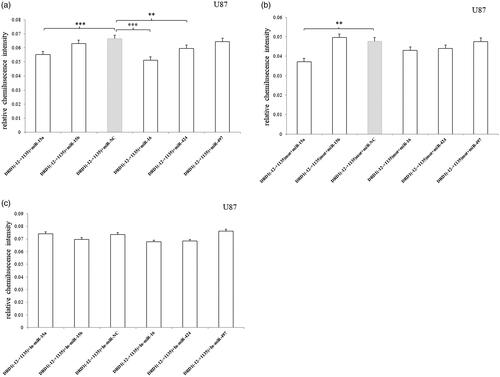
A series of DRD1 gene 3′UTR-truncated fragments between –12 (position immediately downstream the stop codon) and +1135 were cloned into pmirGLO vector. The luciferase activities driven by these fragments were measured after transient transfection in HEK293, U87, SK-N-SH and SH-SY5Y cell lines. As shown in , the 1147 bp fragment ranging from –12 to +1135 bp of 3′UTR significantly decreased the luciferase expression about 35–66% over the negative pmirGLO-Basic control in the four cell lines, suggesting that the essential 3′UTR is located in this region. After a series of deletion in the 3′UTR region, only the deletion of the region –12 to +154 bp strikingly increased the luciferase expression about 28–163% over the pmirGLO vector containing –12 to +1135 bp fragment in all of the four cell lines. Accordingly, the segment of –12 to +154 bp in DRD1 3′UTR has a potential inhibitory effect on gene expression, regardless of the cell lines. Additionally, the deletion of +498 to +632 bp region showed a significant increase in the luciferase expression in three cell lines except for SH-SY5Y cell.
Figure 1. Relative luciferase activity of pmirGLO recombinant vector containing a series of DRD1 3′UTR-truncated fragments. (a) The 1147 bp fragment ranging from –12 to +1135 bp of 3′UTR significantly decreased the luciferase expression compared to the negative pmirGLO-Basic control in HEK-293 cell line. The deletions of –12 to +154 bp, +498 to +632 bp and +709 to +864 bp increased the luciferase expression compared to the pmirGLO vector containing –12 to +1135 bp fragment in HEK-293 cell line. (b) The 1147 bp fragment ranging from –12 to +1135 bp of 3′UTR significantly decreased the luciferase expression compared to the negative pmirGLO-Basic control in U87 cell line. The deletions of –12 to +154 bp and +498 to +632 bp increased the luciferase expression compared to the pmirGLO vector containing –12 to +1135 bp fragment in U87 cell line. (c) The 1147 bp fragment ranging from –12 to +1135 bp of 3′UTR significantly decreased the luciferase expression compared to the negative pmirGLO-Basic control in SK-N-SH cell line. The deletions of –12 to +154 bp and +498 to +632 bp increased the luciferase expression compared to the pmirGLO vector containing –12 to +1135 bp fragment in SK-N-SH cell line. (d) The 1147 bp fragment ranging from –12 to +1135 bp of 3′UTR significantly decreased the luciferase expression compared to the negative pmirGLO-Basic control in SH-SY5Y cell line. The deletions of –12 to +154 bp and +498 to +632 bp increased the luciferase expression compared to the pmirGLO vector containing –12 to +1135 bp fragment in SH-SY5Y cell line. Normalized activities of all the 3′UTR fragments were compared with the control vector (pmirGLO-Basic). *p < .05, **p < 0.01 and ***p < .001. The error bars were standard deviation of the mean.
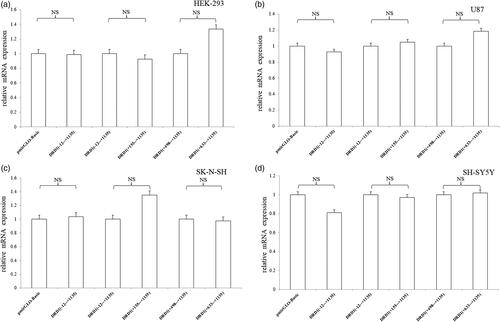
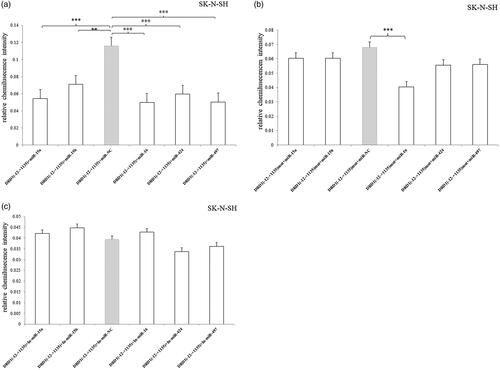
We also measured the mRNA expression of luciferase receptor gene of the recombined pmirGLO vectors (). The results showed that a series of DRD1 gene 3′UTR-truncated fragments had no effect on the mRNA expression. We can infer that DRD1 gene 3′UTR was involved only in the initial translation regulation.
Figure 2. Relative mRNA expression of pmirGLO recombinant vector containing DRD1 3′UTR truncated fragments. (a) A series of DRD1 gene 3′UTR-truncated fragments had no effect on the mRNA expression in HEK-293 cell line. (b) A series of DRD1 gene 3′UTR-truncated fragments had no effect on the mRNA expression in U87 cell line. (c) A series of DRD1 gene 3′UTR-truncated fragments had no effect on the mRNA expression in SK-N-SH cell line. (d) A series of DRD1 gene 3′UTR-truncated fragments had no effect on the mRNA expression in SH-SY5Y cell line. NS represents p > .05. The error bars were standard deviation of the mean.
Prediction and conformation of potential miRNA binding –12 to +154 bp region of DRD1 3′UTR
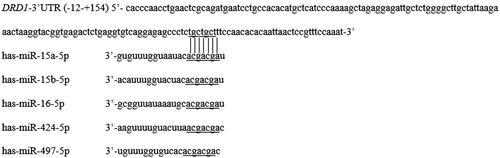
The –12 to +154 bp region of DRD1 3′UTR was selected to predict the potential miRNA that regulated the expression of DRD1 gene, taking into account that this segment exhibited the most significant inhibition in the luciferase expression in the cell lines. A total of five miRNAs, including has-miR-15a-5p (miR-15a), has-miR-15b-5p (miR-15b), has-miR-16-5p (miR-16), has-miR-424-5p (miR-424) and has-miR-497-5p (miR-497), were predicted by the databases of TargetScanHuman and microRNA.org (). Interestingly, all of these miRNAs recognized and bound the same DNA sequence (5′-tgctgct-3′).
Figure 3. Prediction of potential miRNA binding –12 to +154 bp region of DRD1 3′UTR. Note: A total of five miRNAs, including has-miR-15a-5p (miR-15a), has-miR-15b-5p (miR-15b), has-miR-16-5p (miR-16), has-miR-424-5p (miR-424) and has-miR-497-5p (miR-497), were predicted by the databases of TargetScanHuman and microRNA.org.
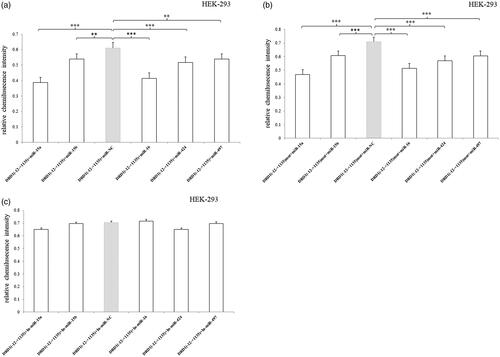
We then used the dual-luciferase receptor assay system to determine whether the predicted miRNAs interact with the 3′UTR of DRD1 gene, and hence inhibiting the luciferase expression. Thus, pmirGLO-recombined vectors containing 3′UTR –12 to +1135 bp fragment or 3′UTR –12 to +1135 bp-mutated fragment (the binding sequence 5′-tgctgct-3′ was deleted) were transiently co-transfeced into the cells with miRNA mimic/inhibitor or miRNA negative control (miR-NC).
In HEK293 cell, all of the five miRNAs significantly inhibited the luciferase expression compared to the miR-NC (). However, they also decreased the luciferase expression of 3′UTR-mutated fragment, suggesting that there were other binding sequences of the target miRNAs in the –12 to +1135 bp region besides the predicted sequence (5′-tgctgct-3′) (). Additionally, no effects were observed after the miRNA inhibitors were transfected ().
Figure 4. Relative luciferase activity of pmirGLO-recombined vectors containing 3′UTR –12 to +1135 bp fragment or mutated fragment after transfection of miRNA mimic/inhibitor in HEK293 cell. (a) All of the five miRNAs significantly inhibited the luciferase expression compared to the miR-NC. (b) All of the five miRNAs also decreased the luciferase expression of 3′UTR-mutated fragment. (c) No effects were observed after the miRNA inhibitors were transfected. Normalized activities were compared with the NC (miR-NC/In-miR-NC). *p < .05, **p < .01 and ***p < .001. The error bars were standard deviation of the mean.
In U87 cell, miRNA-15a, miRNA-16 and miRNA-424 significantly inhibited the luciferase expression compared to the miR-NC () and only miRNA-15a decreased the luciferase expression of 3′UTR-mutated fragment (). The results indicated that miRNA-15a could effect on the other sequence of the –12 bp to +1135 bp, whereas miRNA-16 and miRNA-424 just only recognized the mutated segment. Additionally, no effects were observed after the miRNA inhibitors were transfected ().
Figure 5. Relative luciferase activity of pmirGLO-recombined vectors containing 3′UTR –12 to +1135 bp fragment or mutated fragment after transfection of miRNA mimic/inhibitor in U87 cell. (a) miRNA-15a, miRNA-16 and miRNA-424 significantly inhibited the luciferase expression compared to the miR-NC. (b) Only miRNA-15a decreased the luciferase expression of 3′UTR-mutated fragment. (c) No effects were observed after the miRNA inhibitors were transfected. Normalized activities were compared with the NC (miR-NC/In-miR-NC). *p < .05, **p < .01 and ***p < .001. The error bars were standard deviation of the mean.
In SK-N-SH cell, all of the five miRNAs significantly inhibited the luciferase expression compared to the miR-NC () and only miRNA-16 decreased the luciferase expression of 3′UTR-mutated fragment (). The results indicated that miRNA-16 could effect on the other sequence of the –12 to +1135 bp, whereas miRNA-15a, miRNA-15b, miRNA-424 and miRNA-497 just only recognized the mutated segment. Additionally, no effects were observed after the miRNA inhibitors were transfected ().
Figure 6. Relative luciferase activity of pmirGLO-recombined vectors containing 3′UTR –12 to +1135 bp fragment or mutated fragment after transfection of miRNA mimic/inhibitor in SK-N-SH cell. (a) All of the five miRNAs significantly inhibited the luciferase expression compared to the miR-NC. (b) Only miRNA-16 decreased the luciferase expression of 3′UTR-mutated fragment. (c) No effects were observed after the miRNA inhibitors were transfected. Normalized activities were compared with the NC (miR-NC/In-miR-NC). *p < .05, **p < .01 and ***p < .001. The error bars were standard deviation of the mean.
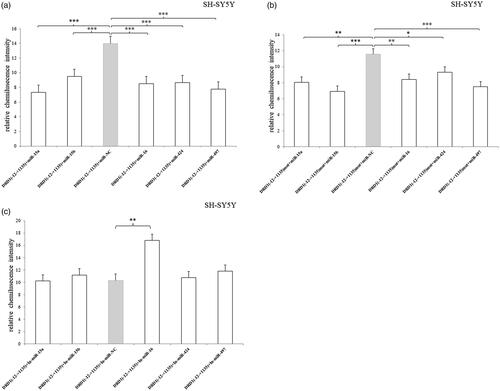
In SH-SY5Y cell, all of the five miRNAs significantly inhibited the luciferase expression compared to the miR-NC () and they also decreased the luciferase expression of 3′UTR-mutated fragment (). It suggested that there were other binding sequences of the target miRNAs in the –12 to +1135 bp region besides the predicted sequence (5′-tgctgct-3′). Additionally, miRNA-16 inhibitor significantly increased the luciferase expression (), which indicated that the inhibitor abolished the inhibitory effect of the endogenous miRNA-16.
Figure 7. Relative luciferase activity of pmirGLO-recombined vectors containing 3′UTR –12 to +1135 bp fragment or mutated fragment after transfection of miRNA mimic/inhibitor in SH-SY5Y cell. (a) All of the five miRNAs significantly inhibited the luciferase expression compared to the miR-NC. (b) All of the five miRNAs decreased the luciferase expression of 3′UTR-mutated fragment. (c) miRNA-16 inhibitor significantly increased the luciferase expression. Normalized activities were compared with the NC (miR-NC/In-miR-NC). *p < .05, **p < .01 and ***p < .001. The error bars were standard deviation of the mean.
Effects of target miRNA on endogenous expression of DRD1
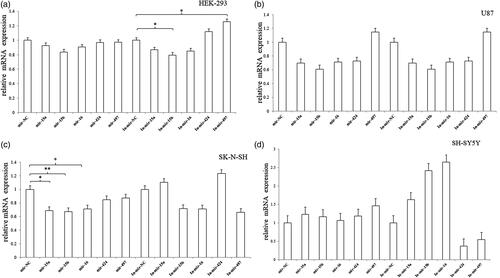
We first detected the role of the miRNAs in the mRNA expression of DRD1. In HEK293 cell, miRNA-15b inhibitor significantly decreased the mRNA expression of DRD1, whereas miRNA-497 inhibitor significantly increased the mRNA expression (). In SK-N-SH, there was an obvious inhibitory effect on the mRNA expression after transfection of miRNA-15a, miRNA-15b and miRNA-16, respectively (). The results showed that miRNAs could be involved in the post-transcription regulation and influence the mRNA expression.
Figure 8. The mRNA expression of endogenous DRD1 after transfection of miRNA mimic/inhibitor. (a) In HEK293 cell, miRNA-15b inhibitor significantly decreased the mRNA expression of DRD1, whereas miRNA-497 inhibitor significantly increased the mRNA expression. (b) In U87 cell, no significant change was observed in the mRNA expression of DRD1. (c) In SK-N-SH, miRNA-15a, miRNA-15b and miRNA-16 significantly decreased the mRNA expression. (d) In SH-SY5Y cell, no significant change was observed in the mRNA expression of DRD1. Normalized activities were compared with the NC (miR-NC/In-miR-NC). *p < .05, **p < .01 and ***p < .001. The error bars were standard deviation of the mean.
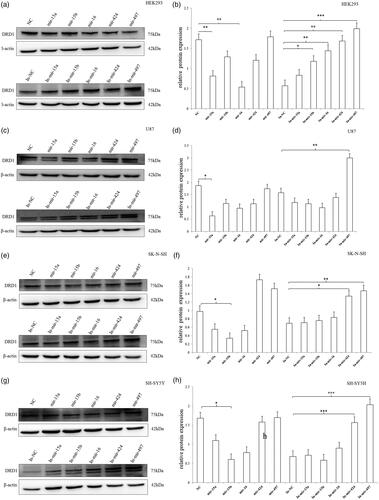
Subsequently, we measured the protein expression of DRD1 after transient transfection of the miRNAs (). In HEK293 cell, the mimics of miRNA-15a and miRNA-16 significantly inhibited the DRD1 expression, whereas the inhibitors of miRNA-15b, miRNA-16, miRNA-424 and miRNA-497 could obviously stimulate the DRD1 expression by abolishing the inhibitory effect of the corresponding endogenous miRNAs (). In U87 cell, the expression of DRD1 significantly decreased only after the transfection of miRNA-15a mimic. The inhibitor of miRNA-497 effectively increased the DRD1 expression (). In SK-N-SH cell, just the mimic of miRNA-15b significantly inhibited the DRD1 expression, whereas the inhibitors of miRNA-424 and miRNA-497 obviously increased the DRD1 expression (). In SH-SY5Y cell, the expression of DRD1 significantly declined only after the transfection of miRNA-15b mimic. The inhibitor of miRNA-424 and miRNA-497 effectively increased the DRD1 expression ().
Figure 9. The protein expression of endogenous DRD1 after transfection of miRNA mimic/inhibitor. (a,b) In HEK293 cell, the mimics of miRNA-15a and miRNA-16 significantly inhibited the DRD1 expression, whereas the inhibitors of miRNA-15b, miRNA-16, miRNA-424 and miRNA-497 could obviously stimulate the DRD1 expression. (c,d) In U87 cell, the expression of DRD1 significantly decreased only after the transfection of miRNA-15a mimic. The inhibitor of miRNA-497 effectively increased the DRD1 expression. (e,f) In SK-N-SH cell, just the mimic of miRNA-15b significantly inhibited the DRD1 expression, whereas the inhibitors of miRNA-424 and miRNA-497 obviously increased the DRD1 expression. (g,h) In SH-SY5Y cell, the expression of DRD1 significantly declined only after the transfection of miRNA-15b mimic. The inhibitor of miRNA-424 and miRNA-497 effectively increased the DRD1 expression. Normalized activities were compared with the NC (NC/In-NC). *p < .05, **p < .01 and ***p < .001. The error bars were standard deviation of the mean.
Discussion
Dopamine D1 receptor plays an important role in dysregulation of dopamine signalling pertinent to schizophrenia. We first time showed that the 3′UTR ranging from –12 to +1135 bp was essential for the post-transcriptional regulation of miRNAs. The deletion of –12 to + 154 bp fragment significantly increased the luciferase expression but not the mRNA expression, suggesting that miRNA was involved in the initial translation regulation. After prediction of miRNAs, we finally confirmed that the miRNA-15a, miRNA-15b and miRNA 16 affected DRD1 expression in HEK293, U87, SK-N-SH and SH-SY5Y cell lines.
However, it was not consistent of the effect of miRNAs on the endogenous DRD1 expression in the four cell lines. The heterogeneity might be due to the discrepancy in cell type. Although originates from human embryonic kidney, HEK293 cell line expresses the moderate DRD1 and dopamine transporter [Citation18]. This cell is also used for identifying the role of calcium signalling regulated by the dopamine D1–D2 receptor heteromer [Citation27]. Thus, HEK293 cell is critical and appropriate for exploring the 5′ regulatory activity of DRD1 gene. For human glioblastoma U87 cell, the previous studies used it to study the formation of DNA adducts by dopamine in the developmental neurodegenerative disease and d-serine and l-proline in the risk of schizophrenia [Citation28–30]. For human neuroblastoma SK-N-SH cell line, it contains the dopaminergic profile [Citation31] and expresses DRD1 [Citation32]. Moreover, it is widely used as a dopaminergic cell line in methamphetamine-induced toxicity, dopamine-induced toxicity and effect of mood stabilizers on DNA methylation [Citation33–35]. Human neuroblastoma SH-SY5Y cell line was widely used as in vitro cell model of dopaminergic neurons in schizophrenia and Parkinson’s disease [Citation36–39]. Regrettably, though the choosing of the four cell lines seems proper, there is still a big discrepancy that gives rise to the differences of the miRNA effects.
Several miRNAs have been reported to modulate the DRD1 expression in initial translation process. Huang et al. [Citation18] reported that miR-504 increased the endogenous expression of DRD1 by directly binding the 3′UTR in HEK293 cell line. Moreover, DRD1 was a direct target gene of miR-382 in both the cultured neuronal cells in vitro and the nucleus accumbens in vivo. Via DRD1, miR-382 is involved in alcohol addiction by modulating DeltaFosB expression [Citation21]. Additionally, miR-132 was up-regulated after the infection with Toxoplasma and then decreased the DRD1 expression in the striatum of mouse brain [Citation16].
Our study showed that miRNA-15a, miRNA-15b and miRNA 16 affected DRD1 expression in vitro. The miR-15 family consists of six highly conserved miRNAs (miR-15a/b, miR-16, miR-195, miR-497 and miR-322) [Citation40]. The study showed that miR-15 family was a novel regulator of cardiac hypertrophy and fibrosis acting by inhibiting TGF-β-pathway [Citation41]. Navarro et al. [Citation42] reported that miR-16 levels in tumour samples may be a prognostic maker in non-small-cell lung cancer and its maturation process is regulated by p53. The expression of MiR-15a and miR-16 was inversely associated with Bcl2 expression in chronic lymphocytic leukaemia and that both microRNAs negatively regulated Bcl2 at a post-transcriptional level. BCL2 repression by these microRNAs induced apoptopsis in a leukaemic cell line model [Citation43]. Moreover, there was a significant decreasing of survival and checkpoint response after UV damage after microRNA-mediated gene-silencing inhibition via knock-down essential components of the microRNA-processing pathway. The UV-inducible miR-16 was involved in the response by down-regulating checkpoint-gene CDC25a and regulating cell proliferation [Citation44]. Additionally, miR-15/16 controlled the NK cell maturation programme by regulating transcription factor c-Myb [Citation45]. They also targeted p70S6 kinase 1 and controlled cell proliferation in MDA-MB-231 breast cancer cell [Citation46].
There were an obviously inhibitory effect on the mRNA expression in SK-N-SH after transfection of miRNA-15a, miRNA-15b and miRNA-16, respectively. MiRNAs have also been reported to modulate the gene expression by targeting non-coding antisense transcripts in human cells [Citation47]. The study revealed that miR-671 was involved in the stabilization of a sense transcript by a circular non-coding antisense RNA and destabilization of the antisense by a nuclear localized miRNA via an Ago2-mediated cleavage [Citation48]. The miRNAs can also repress the expression of their natural targets through mRNA cleavage in addition to inhibiting productive translation [Citation49]. Therefore, it was reasonable that the transfections of miRNA-15a, miRNA-15b and miRNA-16 inhibited the endogenous DRD1 mRNA level in SK-N-SH cell.
We acknowledge the limitations of our simplified cellular model for study miRNA-medicated DRD1 regulation. The in vivo model is needed to validate our results and solve the discrepancy among the different cell lines. Furthermore, we examined only the miRNA-medicated 3′UTR post-transcriptional regulatory effect on the DRD1 expression, but not took into account of the possible interaction with the promoter, splicing and coding SNPs [Citation50]. Additionally, it is better to explore whether there is an association between miR-15 family and the risk of schizophrenia in the epidemiology, such as case–control study or family-associated study.
Conclusions
In summary, we first time showed that the 3′UTR ranging from –12 to +1135 bp was essential for the post-transcriptional regulation of miRNAs. The deletion of –12 to + 154 bp fragment significantly increased the luciferase expression but not the mRNA expression. The miRNA-15a, miRNA-15b and miRNA 16 inhibit the DRD1 expression in HEK293, U87, SK-N-SH and SH-SY5Y cell lines.
Authors’ contributions
Jun Yao and Xue Wu conceived and designed the experiments. Xue Wu, Feng-ling Xu and Xi Xia performed the experiments. Feng-ling Xu and Bao-jie Wang analyzed the data. Jun Yao wrote the article.
Disclosure statement
The authors declare that they have no competing interests.
Availability of data and materials
The data sets used and/or analyzed during this study are available from the corresponding author on reasonable request.
Additional information
Funding
References
- Tiihonen J, Lonnqvist J, Wahlbeck K, et al. 11-Year follow-up of mortality in patients with schizophrenia: a population-based cohort study (FIN11 study). Lancet. 2009; 374(9690):620–627.
- Howes OD, Kapur S. The dopamine hypothesis of schizophrenia: version III – the final common pathway. Schizophr Bull. 2009;35(3):549–562.
- Abi-Dargham A, Moore H. Prefrontal DA transmission at D1 receptors and the pathology of schizophrenia. Neuroscientist. 2003;9(5):404–416.
- Masana M, Santana N, Artigas F, et al. Dopamine neurotransmission and atypical antipsychotics in prefrontal cortex: a critical review. Curr Top Med Chem. 2012;12(21):2357–2374.
- Beaulieu JM, Gainetdinov RR. The physiology, signaling, and pharmacology of dopamine receptors. Pharmacol Rev.. 2011;63(1):182–217.
- Missale C, Nash SR, Robinson SW, et al. Dopamine receptors: from structure to function. Physiol Rev. 1998;78(1):189–225.
- Undieh AS. Pharmacology of signaling induced by dopamine D(1)-like receptor activation. Pharmacol Therap. 2010; 128(1):37–60.
- Kern A, Mavrikaki M, Ullrich C, et al. Hippocampal dopamine/DRD1 signaling dependent on the ghrelin receptor. Cell. 2015;163(5):1176–1190.
- Baetu I, Burns NR, Urry K, et al. Commonly-occurring polymorphisms in the COMT, DRD1 and DRD2 genes influence different aspects of motor sequence learning in humans. Neurobiol Learn Mem. 2015;125:176–188.
- Homberg JR, Olivier JD, VandenBroeke M, et al. The role of the dopamine D1 receptor in social cognition: studies using a novel genetic rat model. Dis Model Mech. 2016;9(10):1147–1158.
- Zhu F, Yan CX, Wang Q, et al. An association study between dopamine D1 receptor gene polymorphisms and the risk of schizophrenia. Brain Res. 2011;1420:106–113.
- Sedvall G, Pauli S, Karlsson P, et al. PET imaging of neuroreceptors in schizophrenia. Eur Neuropsychopharmacol. 1995;5:25–30.
- Ota VK, Spindola LN, Gadelha A, et al. DRD1 rs4532 polymorphism: a potential pharmacogenomic marker for treatment response to antipsychotic drugs. Schizophr Res. 2012;142(1–3):206–208.
- Azogu I, de la Tremblaye PB, Dunbar M, et al. Acute sleep deprivation enhances avoidance learning and spatial memory and induces delayed alterations in neurochemical expression of GR, TH, DRD1, pCREB and Ki67 in rats. Behav Brain Res. 2015;279:177–190.
- Azkona G, Sagarduy A, Aristieta A, et al. Buspirone anti-dyskinetic effect is correlated with temporal normalization of dysregulated striatal DRD1 signalling in L-DOPA-treated rats. Neuropharmacology. 2014;79:726–737.
- Xiao J, Li Y, Prandovszky E, et al. MicroRNA-132 dysregulation in Toxoplasma gondii infection has implications for dopamine signaling pathway. Neuroscience. 2014;268:128–138.
- Krichevsky AM, King KS, Donahue CP, et al. A microRNA array reveals extensive regulation of microRNAs during brain development. RNA. 2003;9(10):1274–1281.
- Huang W, Li MD. Differential allelic expression of dopamine D1 receptor gene (DRD1) is modulated by microRNA miR-504. Biol Psychiat. 2009;65(8):702–705.
- Huang W, Ma JZ, Payne TJ, et al. Significant association of DRD1 with nicotine dependence. Hum Genet. 2008;123(2):133–140.
- Tobon KE, Chang D, Kuzhikandathil EV. MicroRNA 142-3p mediates post-transcriptional regulation of D1 dopamine receptor expression. PLoS One. 2012;7(11):e49288.
- Li J, Li J, Liu X, et al. MicroRNA expression profile and functional analysis reveal that miR-382 is a critical novel gene of alcohol addiction. EMBO Mol Med. 2013;5(9):1402–1414.
- Froger A, Hall JE. Transformation of plasmid DNA into E. coli using the heat shock method. J. Vis. Exp. 2007;6(6):253.
- Walker JM. The bicinchoninic acid (BCA) assay for protein quantitation. Methods Mol Biol. 1994;32:5–8.
- Girish V, Vijayalakshmi A. Affordable image analysis using NIH Image/ImageJ. Indian J Cancer. 2004;41(1):47.
- Agarwal V, Bell GW, Nam JW, et al. Predicting effective microRNA target sites in mammalian mRNAs. Elife. 2015;4:e05005.
- Betel D, Wilson M, Gabow A, et al. The microRNA.org resource: targets and expression. Nucleic Acids Res. 2007;36(Database):D149–D153.
- Blasiak E, Lukasiewicz S, Szafran-Pilch K, et al. Genetic variants of dopamine D2 receptor impact heterodimerization with dopamine D1 receptor. Pharmacol Rep. 2017;69(2):235–241.
- Levay G, Bodell WJ. Detection of dopamine–DNA adducts: potential role in Parkinson’s disease. Carcinogenesis. 1993;14(6):1241–1245.
- Caldinelli L, Sacchi S, Molla G, et al. Characterization of human DAAO variants potentially related to an increased risk of schizophrenia. Biochimica et Biophysica Acta. 2013;1832(3):400–410.
- Cappelletti P, Tallarita E, Rabattoni V, et al. Proline oxidase controls proline, glutamate, and glutamine cellular concentrations in a U87 glioblastoma cell line. PLoS One. 2018;13(4):e0196283.
- Wang J, Bannon MJ. Sp1 and Sp3 activate transcription of the human dopamine transporter gene. J Neurochem. 2005;93(2):474–482.
- Gangolli EA, Conneely OM, O’Malley BW. Neurotransmitters activate the human estrogen receptor in a neuroblastoma cell line. J Steroid Biochem Mol Biol. 1997;61(1–2):1–9.
- Ajjimaporn A, Shavali S, Ebadi M, et al. Zinc rescues dopaminergic SK-N-SH cell lines from methamphetamine-induced toxicity. Brain Res Bull. 2008;77(6):361–366.
- Moszczynska A, Saleh J, Zhang H, et al. Parkin disrupts the alpha-synuclein/dopamine transporter interaction: consequences toward dopamine-induced toxicity. J Mol Neurosci. 2007;32(3):217–227.
- Asai T, Bundo M, Sugawara H, et al. Effect of mood stabilizers on DNA methylation in human neuroblastoma cells. Int J Neuropsychopharmacol. 2013;16(10):2285–2294.
- Xie HR, Hu LS, Li GY. SH-SY5Y human neuroblastoma cell line: in vitro cell model of dopaminergic neurons in Parkinson’s disease. Chin Med J. 2010;123(8):1086–1092.
- Shin JH, Park SJ, Kim ES, Jo YK, et al. Sertindole, a potent antagonist at dopamine D- receptors, induces autophagy by increasing reactive oxygen species in SH-SY5Y neuroblastoma cells. Biol Pharm Bull. 2012;35(7):1069–1075.
- Deslauriers J, Lefrancois M, Larouche A, et al. Antipsychotic-induced DRD2 upregulation and its prevention by alpha-lipoic acid in SH-SY5Y neuroblastoma cells. Synapse. 2011;65(4):321–331.
- Millar JK, Pickard BS, Mackie S, et al. DISC1 and PDE4B are interacting genetic factors in schizophrenia that regulate cAMP signaling. Science. 2005;310(5751):1187–1191.
- Liu LF, Wang Y. Cellular function of microRNA-15 family. Sheng li Xue Bao. 2012;64(1):101–106.
- Tijsen AJ, van der Made I, van den Hoogenhof MM, et al. The microRNA-15 family inhibits the TGFbeta-pathway in the heart. Cardiovasc Res. 2014;104(1):61–71.
- Navarro A, Diaz T, Gallardo E, et al. Prognostic implications of miR-16 expression levels in resected non-small-cell lung cancer. J Surg Oncol. 2011;103(5):411–415.
- Cimmino A, Calin GA, Fabbri M, et al. miR-15 and miR-16 induce apoptosis by targeting BCL2. Proc Natl Acad Sci USA. 2005;102(39):13944–13949.
- Pothof J, Verkaik NS, van IW, et al. MicroRNA-mediated gene silencing modulates the UV-induced DNA-damage response. EMBO J. 2009;28(14):2090–2099.
- Sullivan RP, Leong JW, Schneider SE, et al. MicroRNA-15/16 antagonizes Myb to control NK cell maturation. J Immunol. 2015;195(6):2806–2817.
- Janaki Ramaiah M, Lavanya A, Honarpisheh M, et al. MiR-15/16 complex targets p70S6 kinase 1 and controls cell proliferation in MDA-MB-231 breast cancer cells. Gene. 2014;552(2):255–264.
- Hansen TB, Wiklund ED, Bramsen JB, et al. Kjems J: miRNA-dependent gene silencing involving Ago2-mediated cleavage of a circular antisense RNA. EMBO J. 2011;30(21):4414–4422.
- Rossi JJ. A novel nuclear miRNA mediated modulation of a non-coding antisense RNA and its cognate sense coding mRNA. EMBO J. 2011;30(21):4340–4341.
- Yekta S, Shih IH, Bartel DP. MicroRNA-directed cleavage of HOXB8 mRNA. Science. 2004;304(5670):594–596.
- Shi S, Leites C, He D, et al. MicroRNA-9 and microRNA-326 regulate human dopamine D2 receptor expression, and the microRNA-mediated expression regulation is altered by a genetic variant. J Biol Chem. 2014;289(19):13434–13444.