
Abstract
LncRNA PTENP1 is a competitive endogenous RNA (ceRNA) involved in decoying miR-106b in multiple diseases. This study investigates the interaction of PTENP1 and miR-106b in cell proliferation, apoptosis and epithelial–mesenchymal transition (EMT) in cervical cancer. The expressions of PTENP1, miR-106b and PTEN were determined in cervical cancer tissues, adjacent normal tissues, cervical cancer cells (HeLa, SiHa, C33A and CasKi) and normal cervical epithelial H8 cells. Up-regulation of PTENP1 and down-regulation of miR-106b were conducted in HeLa and CasKi cells by transfecting cells with corresponding miRNA mimics and inhibitors. Bioinformatics analysis, luciferase reporter assay and RNA-pull down assay were performed to verify the association of miR-106b, PTEN, and PTENP1. Cell growth and cell apoptosis were determined by CCK-8 and flow cytometry analysis. It was found that the expressions of PTENP1 and PTEN were up-regulated and that of miR-106b were down-regulated in cervical cancer tissues and cells. PTENP1 localized in cytoplasm and competitively bound to miR-106b. Up-regulation of PTENP1 and down-regulation of miR-106b contributed to increased expressions of PTEN and E-cadherin. Decreased expression of miR-106b, ZEB1, Snail and Vimentin, resulted in inhibiting cell proliferation and promoting cell apoptosis. Over-expression of PTENP1 and miR-106b accelerated cell proliferation and slowed down cell apoptosis. miR-106b inhibited the expression of PTEN. Our results suggest that LncRNA PTENP1 inhibits cervical cancer progression by competitively binding to miR-106b, leading to promote PTEN expression, inhibit cell proliferation and EMT and induce cell apoptosis in cervical cancer cells
Keywords:
Introduction
Cervical cancer is the fourth most prevalent female cancer and causes approximately 265,700 annual death worldwide [Citation1,Citation2]. The incidence of this disease varies across the world with the highest incidence in Eastern Africa and lowest incidence in Western Asia [Citation3]. Numerous efforts, include primary screening and expansion of human papillomavirus (HPV) vaccine coverage, have been made to prevent cervical cancer [Citation4], that reduce the disease in developed countries [Citation5,Citation6]. As for the treatment of this disease, radical hysterectomy has gained increasing popularity and broad acceptance across Europe and the Americas in the last 20 years [Citation7].
It was known that non-coding RNAs (ncRNAs) are commonly dysregulated in multiple tumours [Citation8]. Non-coding RNAs are the general term of long ncRNAs (lncRNAs) and small ncRNAs (sncRNAs). LncRNAs consist of antisense, intronic and intergenic transcripts, and pseudogenes [Citation9]. In recent years, pseudogenes were discovered to function as competitive endogenous RNAs (ceRNAs) that sequester miRNAs by binding to their ancestral genes [Citation10,Citation11]. LncRNA PTENP1, the pseudogene of PTEN tumour suppressor, has been reported to exert its tumour-suppressive function via modulating PTEN expression in many malignancies [Citation12]. Although PTENP1 has been demonstrated to function as a tumour suppressor in several cancer cells [Citation13,Citation14], its role as a ceRNA in cervical cancer was not well understood.
MicroRNAs (miRNAs) are small non-coding RNA molecules that possess regulatory functions for gene expression. Depending on their gene targets, miRNAs were found to be involved in cancer development [Citation15,Citation16]. miR-106b plays an essential role in a variety of human cancers involving cell invasion and metastasis. Previous data showed that miR-106b contributed to invasion and metastasis of oesophageal squamous cell carcinoma (ESCC) by regulating PTEN-mediated epithelial-to-mesenchymal transition (EMT) [Citation17]. In the current study, we explore the role of LncRNA PTENP1 in cell proliferation, apoptosis and EMT in cervical cancer. It was found that PTENP1 exerts these biological functions by suppressing miR-106b and promoting PTEN.
Results
Decreased LncRNA PTENP1 expression in cervical cancer tissues and cervical cancer cells
Quantitative RT-PCR was applied to detect the expressions of PTENP1 in cervical cancer tissues and adjacent normal tissues. The results showed that PTENP1 expression in cervical cancer tissues was substantially decreased compared with adjacent normal tissues (p < .01) (). The relationship between PTENP expression and patients’ clinical parameters was observed. As shown in , among the five clinicopathological features, the FIGO stage and the lymph node metastasis had significant correlation with PTENP1 expression (p <.05), the other clinicopathological features showed no significant correlation with PTENP1 expression (p>.05).
Figure 1. Expression of PTENP1 in cervical cancer tissues and cells. (A) qRT-PCR on expression of PTENP1 in cervical cancer and adjacent normal tissues; (B) qRT-PCR on expression of PTENP1 in HeLa, SiHa, C33A, CasKi and H8 cells; (C) The level of PTENP1 in cytoplasm was higher than that in nucleus in subcellular fractionations; (D) Overexpression of PTENP1 in CasKi and HeLa cells was successfully established; **compared with adjacent normal tissues, p < .01; *compared with H8 cells, or blank group, p < .05
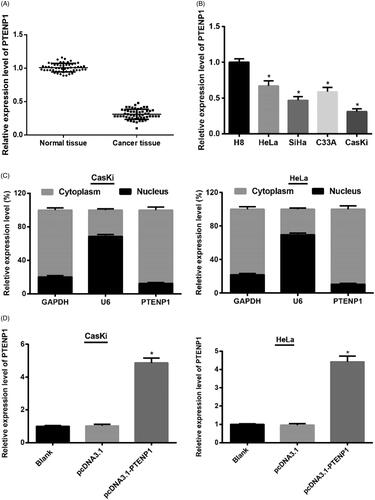
Table 1. Association between PTENP1 expression and clinicopathological features of patients with cervical cancer.
Quantitative RT-PCR was also applied to detect the expressions of PTENP1 in cervical cancer and normal cervical epithelial cells. It was found that PTENP1 expression was reduced in cervical cancer HeLa, SiHa, C33A and CasKi cells in contrast to that in normal cervical epithelial H8 cells (p < .05). Among the four cervical cancer cell lines, CasKi had the lowest PTENP1 expression and HeLa had the highest PTENP1 expression (); therefore, CasKi and HeLa cells were selected for further experiments.
The localization of PTENP1 in CasKi and HeLa cells were investigated using subcellular fractionation. It was found that PTENP1 localized in both cell nucleus and cytoplasm of CasKi and HeLa cells, with higher expression in cytoplasm than in nucleus, indicating an important role of PTENP1 in cytoplasm of cervical cancer cells ().
qRT-PCR results showed that in both CasKi and HeLa cells, cells in pcDNA3.1-PTENP1 group had substantially higher expression of PTENP1 than those in pcDNA3.1 group (both p < .05) (), suggesting that overexpression of PTENP1 in CasKi and HeLa cells was successfully established.
Over-expression of PTENP1 inhibits proliferation and promotes apoptosis of cervical cancer cells
CCK-8 assay was applied to determine the effect of over-expression of PTENP1 on cell proliferation. The results demonstrated that there was no significant difference in cell proliferation in pcDNA3.1 group compared with blank group (both p > .05). However, cell proliferation in pcDNA3.1-PTENP1 group was inhibited (both p < .05) ().
Figure 2. CCK-8 assay and FCM on over-expression of PTENP1 on cell proliferation and apoptosis on CasKi and HeLa cells. (A,B) CCK-8 assay. Decreased cell proliferation in CasKi and Hela cells in pcDNA3.1-PTENP1 group; (C) Increased cell apoptosis in pcDNA3.1-PTENP1 group in both CasKi and HeLa cells; *compared with blank group, p < .05
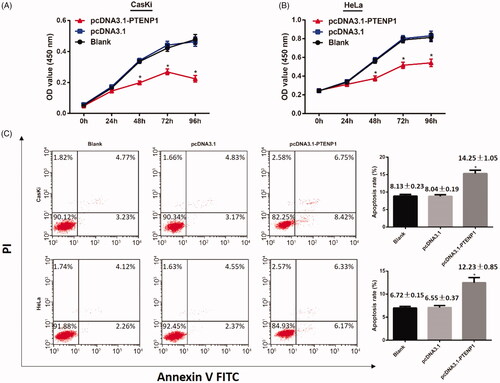
Cell apoptosis was examined with the application of flow cytometry. The results suggested that there was no difference on cell apoptosis between blank groups and pcDNA3.1 group (both p > .05). Cell apoptosis in pcDNA3.1-PTENP1 group increased in contrast to pcDNA3.1 group (both p < .05) (). These results indicated that over-expression of PTENP1 inhibits proliferation and promote apoptosis in cervical cancer cells.
Over-expression of PTENP1 inhibits EMT in cervical cancer
Under an inverted microscope, it was found that CasKi and HeLa cells in blank groups were fusiform similar to mesenchymal cells. The cells in pcDNA3.1 group were similar to that of blank groups, while cells in pcDNA3.1-PTENP1 group gradually changed to round shape ().
Figure 3. Over-expression of PTENP1 on EMT biomarkers in CasKi and HeLa cells. (A) cell morphology of CasKi and HeLa cells under an inverted microscope (×100); (B) qRT-PCR showed decreased mRNA expression of ZEB1 and Snail in cells of pcDNA3.1-PTENP1 group; (C) elevated expression of E-cadherin and decreased expression of Vimentin in cells of pcDNA3.1-PTENP1 group; (D) Immunofluorescence showed overexpressed E-cadherin and reduced Vimentin in pcDNA3.1-PTENP1 group; *compared with blank group, p < .05
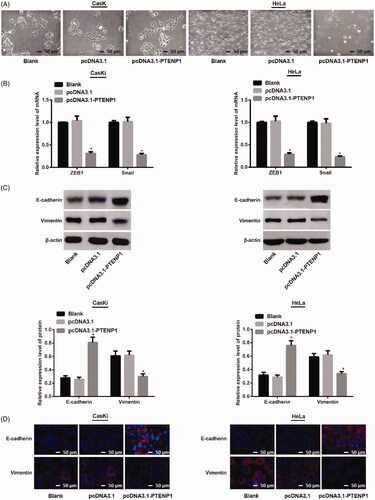
qRT-PCR was utilized to determine the mRNA expression of EMT-related genes (ZEB1 and Snail). There was no difference in the mRNA expression of ZEB1 and Snail in blank groups and pcDNA3.1 groups of both CasKi cells and HeLa cells (both p > .05). In contrast, the mRNA expressions of ZEB1 and Snail in pcDNA3.1-PTENP1 group were substantially reduced compared to pcDNA3.1 group (both p < .05) ().
Western blot was utilized to determine the expression of EMT-related proteins (E-cadherin and vimentin). There was no difference in the expression of E-cadherin and vimentin in blank groups and pcDNA3.1 groups of both CasKi cells and HeLa cells (both p > .05). However, cells in pcDNA3.1-PTENP1 group showed elevated expression of E-cadherin, and decreased expression of Vimentin compared with cells in pcDNA3.1 group (both p < .05) ().
Immunofluorescent staining revealed that CasKi and HeLa cells in blank group had similar expression of E-cadherin and vimentin in contrast to pcDNA3.1 group. The comparison between blank group and pcDNA3.1-PTENP1 group showed overexpressed E-cadherin and reduced Vimentin expression in pcDNA3.1-PTENP1 group (). These results suggested that overexpression of PTENP1 inhibits EMT in cervical cancer cells.
Increased expression of miR-106b in cervical cancer tissues and cells
qRT-PCR was applied to detect the expression of miR-106b in cervical cancer tissues and adjacent normal tissues. The results showed that compared with adjacent normal tissues, cervical cancer tissues had increased expression of miR-106b (p < .05) ().
Figure 4. miR-106b overexpressed in both cervical cancer tissues and cells. (A,B) qRT-PCR showed increased expression of miR-106b in cervical cancer tissues and cervical cancer cells; (C,D) decreased expression of miR-106b in miR-106b inhibitors group of CasKi and Hela cells; **compared with adjacent normal tissues, p < .01; *compared with H8 cells, or blank group, p < .05
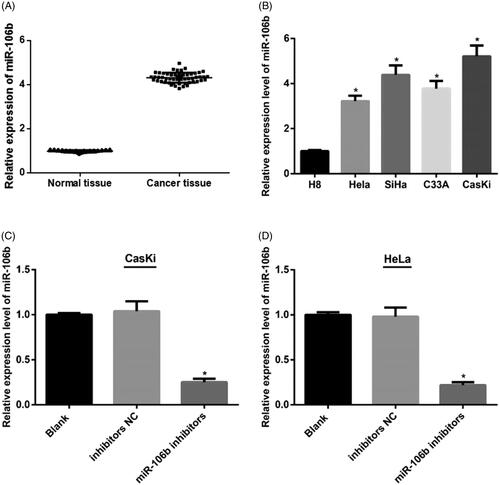
In comparison with normal cervical epithelial H8 cells, miR-106b expression in cervical cancer cells (HeLa, SiHa, C33A and CasKi) was elevated (p < .05). Among the cervical cancer cells, CasKi had the highest miR-106b expression and HeLa had the lowest miR-106b expression ().
qRT-PCR detection showed that in both CasKi and HeLa cells, expression of miR-106b in miR-106b inhibitors group was higher than those in inhibitors NC group (both p < .05) (), indicating the successfully establishment of low-expression of miR-106b in both CasKi and HeLa cells.
Down-regulation of miR-106b inhibits cell proliferation and promotes cell apoptosis in cervical cancer
CCK-8 assay in both CasKi and HeLa cells showed that, cells transfected with miR-106b inhibitors inhibited cell proliferation, while transfection with NC had no effect on cell proliferation (both p < .05) ().
Figure 5. miR-106 on cell proliferation and cell apoptosis in CasKi and HeLa cells. (A,B) CCK-8 assay showed down-regulation of miR-106 inhibits cell proliferation of CasKi and HeLa cells; (C) Cell apoptosis in CasKi cells and HeLa cells detected by FCM; *compared with blank group, p < .05
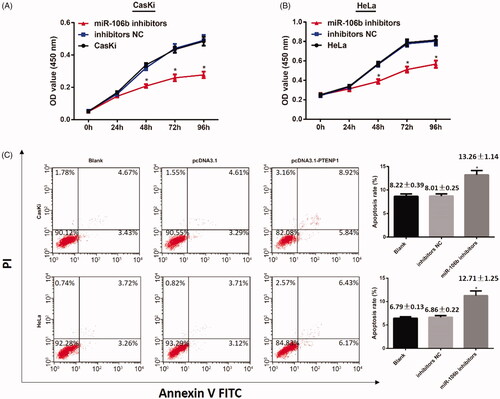
Flow cytometric analysis showed that cell apoptosis rate in miR-106b inhibitors group was substantially elevated, while there was no difference in cell apoptosis between blank group and NC group (both p > .05). (). These results showed that down-regulation of miR-106b inhibited cells proliferation and promoted cell apoptosis in cervical cancer.
Down-regulation of miR-106b inhibits EMT in cervical cancer
Cell morphology was observed under an inverted microscope. CasKi cells and HeLa cells transfected with inhibitors NC showed no change in cell morphology. The cells transfected with miR-106b inhibitors gradually became round shape ().
Figure 6. Down-regulation of miR-106b on EMT biomarkers in CasKi and HeLa cells. (A) cell morphology of CasKi and HeLa cells under an inverted microscope (×100); (B) qRT-PCR showed decreased mRNA expressions of ZEB1 and Snail in miR-106b inhibitors group; (C) Western blotting showed cells in miR-106b inhibitors group had elevated expression of E-cadherin, and decreased expression of vimentin; (D) Immunofluorescence showed E-cadherin overexpressed in miR-106b inhibitors group and vimentin reduced in miR-106b inhibitors group; *compared with blank group, p <.05
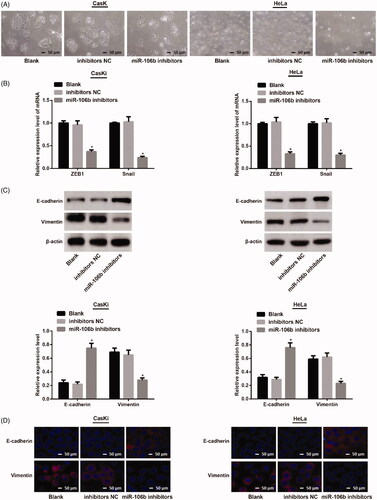
qRT-PCR showed that there was no difference in mRNA expressions of ZEB1 and Snail in blank group and NC group in both CasKi cells and HeLa cells (both p > .05). In contrast to cells in NC group, the mRNA expressions of ZEB1 and Snail in miR-106b inhibitors group were substantially reduced (both p < .05) ().
Western Blot showed no significant difference on expressions of E-cadherin and Vimentin in both CasKi cells and HeLa cells transfected with inhibitors NC (both p > .05). Cells transfected with miR-106b inhibitors had increased expression of E-cadherin, but decreased expression of Vimentin in both CasKi and HeLa cells, (both p < .05) ().
Immunofluorescent staining revealed that CasKi and HeLa cells in blank group had similar expressions of E-cadherin and Vimentin in contrast to NC group. The comparison between blank group and miR-106b inhibitors group showed that E-cadherin was overexpressed and vimentin expression decreased in miR-106b inhibitors group (). These results suggested that down-regulation of miR-106b can inhibit EMT in cervical cancer cells.
Overexpression of miR-106b reverses the effect of PTENP1 on cell proliferation, apoptosis and EMT in cervical cancer
In both CasKi and HeLa cells, cell proliferation in pcDNA3.1-PTENP1 + miR-106b mimics group increased compared to that in pcDNA3.1-PTENP1 + mimics NC group (both p < .05) ().
Figure 7. Cell proliferation, cell apoptosis and EMT of CasKi and HeLa cells. (A) CCK-8 assay showed increased cell proliferation in pcDNA3.1-PTENP1 + miR-106b mimics group; (B) FCM showed inhibited cell apoptosis in pcDNA3.1-PTENP1 + miR-106b mimics group; (C) Cell morphology of CasKi and HeLa cells in each group (×100); (D) increased mRNA expressions of ZEB1 and Snail in pcDNA3.1-PTENP1 + miR-106b mimics group; (E) decreased expression of E-cadherin, and increased expression of Vimentin in pcDNA3.1-PTENP1 + miR-106b mimics group; (F) Immunofluorescence staining showed decreased E-cadherin and increased Vimentin in pcDNA3.1-PTENP1 + miR-106b mimics group (×200); *compared with pcDNA3.1-PTENP1 + mimics NC group, p < .05
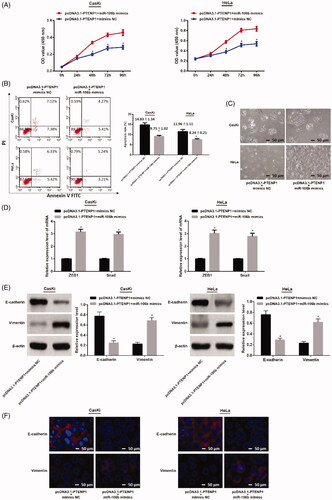
FCM showed that cell apoptosis in pcDNA3.1-PTENP1 + miR-106b mimics group was inhibited compared to that in pcDNA3.1-PTENP1 + mimics NC group in both CasKi and HeLa cells (both p < .05) ().
Observation of cell morphology showed that CasKi or HeLa cells co-transfected with pcDNA3.1-PTENP1 and miR-106b mimics changed to fusiform shape similar to mesenchymal cells ().
The mRNA expressions of ZEB1 and Snail in pcDNA3.1-PTENP1 + miR-106b mimics group were substantially higher than that in pcDNA3.1-PTENP1 + mimics NC group in both CasKi and HeLa cells (both p < .05) ().
Western blot confirmed that in CasKi and HeLa cells, the pcDNA3.1-PTENP1 + miR-106b mimics group had decreased expression of E-cadherin and increased expression of vimentin when compared with pcDNA3.1-PTENP1 + mimics NC (both p < .05) (). These results indicated that PTENP1 regulates cell proliferation, apoptosis and EMT in cervical cancer by interacting with miR-106b.
Immunofluorescence staining revealed that the expression of E-cadherin decreased but that of Vimentin increased in pcDNA3.1-PTENP1 + miR-106b mimics group comparison with pcDNA3.1-PTENP1 + mimics NC group (). These results indicated that inhibition of miR-106b can inhibit EMT of cervical cancer.
Over-expression of PTENP1 and inhibition of miR-106b up-regulated PTEN expression
qRT-PCR and western blot were applied to detect the mRNA and protein expression of PTEN in both cervical cancer tissues and cells. The mRNA and protein expression of PTEN in cervical cancer tissues decreased compared with adjacent normal tissues (p < .05) (). The mRNA and protein expression of PTEN in cervical cancer cells decreased compared with normal cervical cells (p < .05) ().
Figure 8. mRNA (A,C,E,G) and protein expression (B,D,F,H) of PTEN in both cervical cancer tissues and cells. *compared with adjacent normal tissues, or H8 cells or blank group, p <.05.
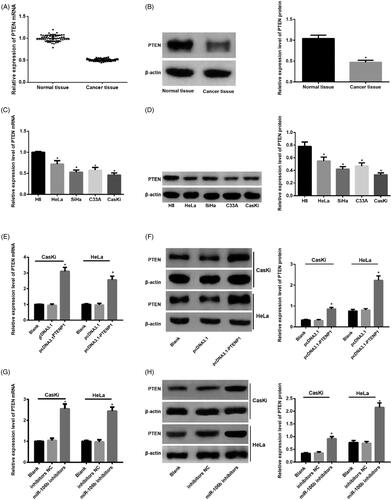
In both CasKi and HeLa cells, the mRNA and protein expression of PTEN in pcDNA3.1-PTENP1 group elevated when compared with pcDNA3.1 group. In addition, increased mRNA and protein expression of PTEN was seen in miR-106b inhibitors group compared with inhibitors NC group (p < .05) ().
Correlation between PTENP1 and miR-106b expression and between PTENP1 and PTEN mRNA expression
The correlation between PTENP1 and miR-106b expression was investigated, results showed that miR-106b expression was negatively correlated with PTENP1 expression (r = −0.6705, p<.05, Supplementary Figure 1A); Meanwhile, PTEN mRNA expression was positively correlated with PTENP1 expression (r = 0.6611, p < .05, Supplementary Figure 1B).
PTENP1 competitively bound to miR-106b to promote PTEN function
The above results showed that there may be a negative targeting relationship between PTENP1 and miR-106b in cervical cancer. qRT-PCR further verified that the expression of miR-106b in pcDNA3.1-PTENP1 group was inhibited when compared with pcDNA3.1 group, while the expression of PTENP1 in miR-106b inhibitors group increased in both CasKi and HeLa cells compared with inhibitors NC group (p <.05) ().
Figure 9. Binding relationship of PTENP1 with miR-106b and the target relationship between miR-106b and PTEN. (A) reduced expression of miR-106b in in pcDNA3.1-PTENP1 group of both CasKi cells and HeLa cells; (B) increased expression of PTENP1 in miR-106b inhibitors group of both CasKi cells and HeLa cells; (C) Online software showed binding relationship of PTENP1 with miR-106b in both CasKi cells and HeLa cells; (D) RNA-pull down assay showed binding relationship of PTENP1 with miR-106b in both CasKi cells and HeLa cells; (E) online software and luciferase activity assay confirmed the targeting relationship between miR-106b and PTEN; *compared with blank group, or NC group, p < .05.
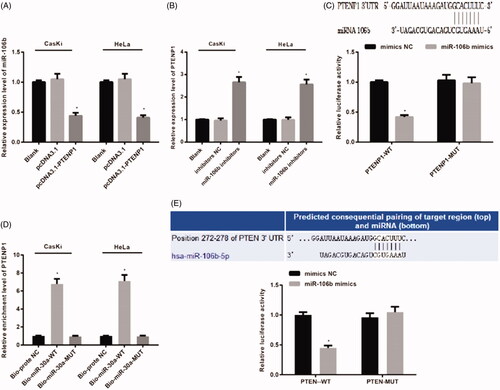
Online software analysis showed that there is a specific binding site of PTENP1 with miR-106b gene sequence. Dual-luciferase reporter system identified that compared with mimics NC group, the luciferase activity of PTENP1 + miR-106b mimic group was inhibited (p < .05), while difference was found in comparison with mutant PTENP1 + miR-106b mimics group (p >.05). These results supported the binding relationship between PTENP1 and miR-106b ().
RNA-pull down assay in both CasKi and HeLa cells showed that the expression of PTENP1 in Bio-miR-106b-WT group was higher than that in Bio-probe NC group (p < .05). Comparison between Bio-miR-106b –MUT group and Bio-probe NC group showed no difference (p > .05). Those data supported that Bio-miR-106b-WT, but not Bio-106b-MUT, can gather PTENP1 around. PTENP1 can compete the binding site of miR-106b, thus decreasing the activity of miR-106b ().
Target scan (http://www.targetscan.org) predicted that there is a targeting relationship between miR-106b and PTEN. Luciferase activity assay showed that compared with PTEN-3′UTR-WT + mimics NC group, PTEN-3′UTR-WT + miR-106b mimics had suppressed luciferase activity (p < 0.05). The luciferase activity of PTEN-3′UTR-MUT + miR-106b mimics was similar to that in PTEN-3′UTR-MUT + mimics NC group (p >.05) (). These results supported that PTEN is a direct target gene of miR-106b.
Discussion
Previous studies indicated that networks regulated by ceRNAs involved in various biological activities, such as modulating gene expressions in cancer initiation and progression [Citation11,Citation18,Citation19]. This study explored the mechanism of lncRNA PTENP1 as a ceRNA in cell proliferation, apoptosis and EMT in cervical cancer. Our results showed that PTENP1 and PTEN were reduced, while miR-106b was overexpressed in cervical cancer tissues and cells, implying the involvement of PTENP1 and PTEN as tumour suppressors in cervical cancer. We verified the relationship of PTEN and miR-106b using online software, as well as by RNA-pull down and double luciferase reporter assays. Data supported that PTEN is a direct target gene of miR-106b. In addition, we explore the effect of up-regulation of PTENP1 and inhibition of miR-106b on cell proliferation, apoptosis and EMT in cervical cancer cells. Our data showed that LncRNA PTENP1 up-regulated PTEN by targeting miR-106b to inhibit cell proliferation and promote EMT in cervical cancer.
LncRNA PTENP1 is a pseudogene of the tumour suppressor gene PTEN [Citation20]. As a tumour suppressor, PTENP1 and PTEN usually decreased in cancer tissues and cells, which was consistent with the observation in the current study. MiR-106b, a member of the miR-106b-25 cluster, lies within the 13th intron of the DNA replication gene MCM7 on chromosome 7 of human [Citation21]. Previous studies on the expression of miR-106b demonstrated that miR-106b was consistently up-regulated in gastric cancer and hepatocellular carcinoma [Citation22,Citation23]. The role of miR-106b in tumorigenesis was related to many signalling pathways, including PTEN tumour-suppressive pathway and TGF-β signalling pathway [Citation24,Citation25]. Double luciferase reporter assay in current study provided evidence supporting the negatively targeting relationship of miR-106b with PTEN. LncRNAs act as an endogenous “sponge” or ceRNA interacting with miRNA and exert their biological function by binding to their target genes [Citation26]. The lncRNA PTENP1 exerts its tumour suppressing function by inhibiting miR-106b. To confirm whether lncRNA PTENP1 interacts with miR-106b, we applied RNA-pull down assay and the results supported the binding relationship between PTENP1 and miR-106b. Therefore, lncRNA PTENP1 by competitively binding to miR-106b regulated PTEN expression in cervical cancer.
Our results also demonstrated the effect of overexpression of PTENP1 and down-regulation of miR-106b on cell proliferation, apoptosis and EMT in cervical cancer cells. Previous study showed that the miR-106 family was implicated in many diseases through several cellular signalling pathways, for example, p21 signalling pathway and transforming growth factor-β (TGF-β) signalling pathway, to regulate cell cycle [Citation24,Citation27]. In colorectal cancer, two major regulating pathways were TGF-β signalling pathway and PI3K-AKT signalling pathway. PTEN was an important negative regulator of the PI3K-AKT signalling pathway, which supported the implication of PTEN and PTENP1 in regulating cell apoptosis in tumour progression [Citation28]. In addition, overexpression of PTENP1 and down-regulation of miR-106b was believed to inhibit EMT in cervical cancer as supported by increased expression of E-cadherin and decreased expression of Vimentin [Citation29]. Apart from that, EMT is considered to be one of the most important mechanisms of tumour cells invasion and metastasis, in which epithelial cells obtain mesenchymal and fibroblast-like properties [Citation30]. A previous study showed that loss of PTEN or activation of PI3K/AKT signalling pathway can promote EMT and tumour progression in prostate cancer cells [Citation31]. Our study was consistent with this observation as overexpression of PTENP1 and down-regulation of miR-106b can inhibit EMT in cervical cancer cells.
In summary, this study elucidated that PTENP1 competitively binds to miR-160b to regulate expression of PTEN. Overexpression of PTENP1 and inhibition on miR-160b contributed to the suppression of cell proliferation and accelerating cell apoptosis in cervical cancer cells. PTENP1 could be a potential therapeutic target for cervical cancer.
Materials and method
Ethical statement
This study was approved by the Ethics committee of TaikangXianlin Drum Tower hospital. All patients signed written informed consents and had the right to know the experiment prior to the study.
Study subjects
A total of 54 patients with cervical cancer diagnosed from August 2014 to 2017 in our hospital were included in this study. The cervical cancer tissues and adjacent normal tissues (5 cm away from the cancer tissues) were collected. The inclusion criteria were: 1. Patients were pathologically diagnosed with cervical cancer; and 2. No prior history of radiotherapy, chemotherapy and other adjuvant therapy. Subjects were eliminated from inclusion if they: 1. Had distant metastasis; 2. Had other malignant tumours; and 3. Were pregnant or lactating.
Cell cultures
Cervical cancer cell lines (HeLa, SiHa, C33A and CasKi) and normal cervical epithelial cell H8 were purchased from Shanghai Institutes for Biological Sciences, CAS (Shanghai, China). All cells were incubated in DMEM culture medium (Gibco, Grand Island, NY, USA) which contains 10% FCS (Gibco, Grand Island, NY, USA) in an incubator at 37 °C with 5% CO2. The culture medium was replaced every 2 to 3 days. Sub-culture was conducted when cells reach 80–90% confluence. The expressions of PTENP1 and miR-106b in each cell lines were determined using qRT-PCR. The CasKi and HeLa cells showed the biggest difference of expression compared with normal epithelial cells and were selected for further experiments.
Cell grouping and corresponding treatment
HeLa and CasKi cells at their logarithmic growth phase were divided into the following 7 groups: 1. Blank group (no treatment), 2. pcDNA3.1 group (transfected with pcDNA3.1), 3. pcDNA3.1-PTENP1 group (transfected with pcDNA3.1-PTENP1); 4. inhibitors NC group (negative control, transfected with inhibitors NC). 5. miR-106b inhibitors group (transfected with miR-106b inhibitors), 6. pcDNA3.1-PTENP1 + mimics NC group (transfected with pcDNA3.1-PTENP1 and mimics NC), and 7. pcDNA3.1-PTENP1 + miR-106b mimics group (transfected with pcDNA3.1-PTENP1 and miR-106b mimics). pcDNA3.1, pcDNA3.1-PTENP1, inhibitors NC, miR-106b inhibitors, mimics NC and miR-106b mimics were purchased from Sangon Biotech (Shanghai, China). Cell transfection was conducted according to the instruction of Lipofectamine 2000 (Invitrogen, Carlsbad, CA, USA). Transfected cells were incubated for 48 h and subjected to morphology evaluation with an inverted microscope.
Determining the localization of PTENP1 in cells
PARIS™ Kit (Ambion, Austin, Texas, USA) was used for subcellular fractionation. HeLa and CasKi cells were harvested, washed with PBS and put on ice. Then, 500 μl of pre-cold cell fractionation buffer was used to re-suspend cells, followed by dissolution on ice for 10 min. After cells were centrifuged for 5 min, the supernatant (cytoplasm) was separated from sediment (cell nucleus). The separated supernatant was added with same volume of 2 × Lysis/Binding Solution for full mixture to prevent RNA from degradation. Anhydrous alcohol of the same volume of supernatant was then added before the mixture was added into the filter candle of the kit. The liquid was abandoned after the filter candle was washed for several times. The RNA on the filter was collected, which was the dissolved cytoplasmic RNA, by centrifugation for 30 s. Cell nucleus sediment was harvested based on the above process, which was the final nuclear RNA. Then cytoplasmic RNA and nuclear RNA were collected for reverse transcription using M-MLV kit (No. 28025013. ThermoFisher Scientific, USA). Expressions of PTENP1 in cytoplasm and nucleus were determined using qRT-PCR.
Dual luciferase reporter assay
Bioinformatics software (http://www.targetscan.org) was used to predict the relationship of lncRNA PTENP1 and miR-106b. Luciferase reporter assay was used to verify the relationship between lncRNA PTENP1 and miR-106b. The artificially synthesised PTENP1 3′UTR gene sequence was introduced to pMIR-reporter (Beijing Huayue Biotechnology Co., Ltd, Beijing, China) through restriction enzyme sites Bamh1 and Ecor1. A mutant site of the complementary sequence of PTENP1 wide target sequence was designed and the target segment was inserted into the pMIR-reporter plasma through restriction enzyme digested T4 DNA. The confirmed WT and MUT plasmids were separately transfected with mimics NC and miR-106b mimics into 293 T cells (Shanghai Beinuo Bio-tech Co., Ltd, Shanghai, China). Cells were harvested after being transfected for 48 h and subjected to cell lysis. Glomax20/20 luminometer (Promega, Madison, Wisconsin, USA) and Luciferase kit (BioVision, San Francisco, CA, USA) were used to detect the activity of luciferase. Experiments in each group were repeated three times.
Bioinformatics software (http://www.targetscan.org) was used to predict the relationship of miR-106b and PTEN, as well as the binding site of miR-106b and PTEN 3’UTR. The PTEN 3′UTR promoter sequence with binding site of miR-106b was synthesised to construct PTEN 3’UTR wild type plasmid (PTEN 3′UTR-WT). PTEN 3′UTR mutant plasmid (PTEN 3′UTR -MUT) was also constructed. The plasmid was established according to the procedure instructed on the plasmid extraction kit (Promega, Madison, Wisconsin, USA). Then cells at logarithmic phase were seeded into a 96 well plate and when cell density reached 70%, PTEN 3′UTR-WT and PTEN-3′UTR-MUT plasmids were transfected with mimics NC and miR-106b mimics into 2106bT cells using Lipofectamine 2000 regent. Cells were harvested after being transfected for 48 h and subjected to cell lysis.
Verifying the relationship of PTENP1 and miR-106b by RNA-pull down
A total volume of 50 nM miR-106b transfected with biotin labelled WT and 50 nM of miR-106b transfected with biotin labelled MUT were separately transfected into cells. After being transfected for 48 h, cells were harvested and washed with PBS before being incubated with special cell lysis buffer (Ambion, Austin, Texas, USA) for 10 min. Then 50 ml of cell lysates were prepared and incubated with M-280 streptavidin MagneSphere (Sigma, St. Louis, MO, USA) pre-coated with RNase-free yeast tRNA (Sigma, St. Louis, MO, USA) at 4 °C for 3 h. The cells were washed with cold lysis buffer twice, low salt buffer solution three times and high salt buffer solution once. Antagonism miR-106b probe was used as negative control. qRT-PCR was applied to determine the expression of PTENP1.
Quantitative reverse transcript polymerase chain reaction
Trizol (Invitrogen, Carlsbad, CA, USA) reagent was applied to extract the total RNA from tissue samples and cells. Ultraviolet analysis and formaldehyde denaturation electrophoresis were applied to verify the quality of extracted RNA. Then l μg of RNA was subjected to AMV reverse transcriptase to obtain cDNA. PCR primers were designed and synthesised by Sangon Biotech (Shanghai, China) (). GAPDH was used as an internal control and U6 was used as an internal control for RNA in cell nucleus. PCR was amplified on following conditions: pre-denature at 94 °C for 5 min, followed by 40 cycles of denature at 94 °C for 40 s, anneal at 60 °C for 40 s and extend at 72 °C for 1 min, and finally extend at 72 °C for 10 min. The PCR product was verified through agarose gel electrophoresis. The lowest point in the parallel rising of the logarithmic amplification curve was manually selected to obtain the cycle threshold. Data were analysed by 2-ΔΔCt method, in which 2-ΔΔCt presents the ratio of gene expressions between the experimental group and control group. ΔΔCt = [Ct (target gene) – Ct (control gene)] experimental group – [Ct (target gene) – Ct (control gene)] control group. Each test was repeated three times to obtain the average value.
Table 2. Primer sequences for qRT-PCR.
Western blot
The proteins from cells and tissue samples in each group were extracted and measured using BCA kit (Wuhan Boster Biological Technology, LTD). Loading buffer was added for boiling at 95 °C for 10 min. 30 µg of proteins were separated in 10% polyacrylamide gel (Wuhan Boster Biological Technology, LTD). The resolving proteins were transferred into PVDF membrane. The blocking was performed using 5% BSA at room temperature. The primary antibodies of PTEN, E-cadherin, Vimentin (1:1000) and β-actin (1:3000) were purchased from Abcam Cambridge, MA, USA. The primary antibodies were added and incubated at 4 °C overnight. Then, the membrane was washed in TBST for 3 times/5 min. The corresponding secondary antibodies (Shanghai MT-bio, China) were added for incubation for 1 h at room temperature. The membrane was washed for 3 times/5 min before colour development. Bio-rad Gel Dol EZ imager (GEL DOC EZ IMAGER, Bio-rad, California, USA) was used to obtain images. The intensity of the target strip was analysed by Image J software. Each test was repeated 3 times to obtain the average value.
Immunofluorescent staining
Cells of each group in logarithmic phase were seeded into slide chambers with the cell density of 50–60%. When cells adhered to walls, they were washed with pre-cold PBS twice before adding 4% paraformaldehyde for fixation at room temperature for 30 min. After that, cells were washed in PBS twice and 0.1% Triton X-100 were added at room temperature. About 10 min later, normal goat serum was added and blocked at room temperature for 1–2 h. Antibodies for E-cadherin and vimentin, and PE-Flag monoclonal antibody (Abcam, Cambridge, MA, USA) were added at a shaking bed at 37 °C for incubation for 2 h. Then, PBST was used to wash the slides for three times, 10 min for each time. Cells were then stained with DAPI for 3–5 min, followed by PBS wash for 3 to 5 times and mounted in mounting medium. Cell staining was observed under a fluorescence microscope.
CCK-8 assay
Cell suspension in each group was diluted and inoculated in a 96-well plate with 1 × 10³/100 μl/well. Each group has 15 parallel wells. According to the incubation time, cells in each group were sub-grouped into five groups (0 h, 24 h, 48 h, 72 h and 96 h), with each subgroup has three duplicate well. The culture medium without cells was served as blank control. The plate was incubated at 37 °C with 5% CO2. A total of 10 μl of CCK-8 regent (Sigma, St. Louis, MO, USA) was added in corresponding wells at each time point and incubated for 4 h. Later, the optical density (OD) was measured using a micro-plate reader (Bio-Rad, USA) under 450 nm wavelength.
Flow cytometry (FCM)
The flow cytometry was performed using CytoFLEX (Beckman Coulter, Inc., USA). Cells in logarithmic growth phase of each group was digested with pancreatic enzymes and centrifuged. The supernatant was removed and cells collected. After cells were washed with pre-cold PBS, centrifugation was performed at 1000 rpm for 5 min twice. Then, cell density was adjusted into 106/ml and a total volume of 200 μl cells were washed with 1 ml PBS twice before centrifugation. Cells were re-suspended in 100 μl of binding buffer, added with 2 μl of Annexin-V-FITC (20 μg/ml) and mixed at ice without light exposure. After 15 min, cells were transferred into the testing tube and 300 μl of PBS was added. Each sample was added with 1 μl PI (50 μg/ml) before detection within 30 min. Using AnnexinV as horizontal axis, PI as vertical axis, cells in upper left area were mechanical damaged cells, upper right area were late apoptotic cells or necrotic cells, lower left area were negative normal cells and lower right area were early apoptotic cells.
Statistical analysis
SPSS 21.0 (SPSS, Inc, Chicago, IL, USA) software was used for data analysis. The obtained data were expressed as mean ± standard deviation. Data were analysed using Kolmogorov–Smirnov if data were in normal distribution. Comparisons between two groups were analysed using t-test, while comparisons among multiple groups were analysed by one-way ANOVA. Pairwise comparison after ANOVA analysis was conducted using Fisher’s least significant difference t-test (LSD-t). p Value was based on two-sided test. p<.05 was considered as statistical difference.
Supplemental Material
Download MS Word (118.8 KB)Disclosure statement
No potential conflict of interest was reported by the authors.
Additional information
Funding
Related Research Data
References
- Chauhan SR, Bharadwaj M. Gearing up T-cell immunotherapy in cervical cancer. Curr Probl Cancer. 2018;42(2):175–188.
- Torre LA, Bray F, Siegel RL, et al. Global cancer statistics, 2012. CA Cancer J Clin. 2015;65(2):87–108.
- Shrestha AD, Neupane D, Vedsted P, et al. Cervical cancer prevalence, incidence and mortality in low and middle income countries: a systematic review. Asian Pac J Cancer Prev. 2018;19(2):319–324.
- Ouh YT, Lee JK. Proposal for cervical cancer screening in the era of HPV vaccination. Obstet Gynecol Sci. 2018;61(3):298–308.
- Vaccarella S, Franceschi S, Engholm G, et al. 50 years of screening in the Nordic countries: quantifying the effects on cervical cancer incidence. Br J Cancer. 2014;111(5):965–969.
- Vaccarella S, Franceschi S, Zaridze D, et al. Preventable fractions of cervical cancer via effective screening in six Baltic, central, and eastern European countries 2017-40: a population-based study. Lancet Oncol. 2016;17(10):1445–1452.
- Kimmig R, Ind T. Minimally invasive surgery for cervical cancer: consequences for treatment after LACC Study. J Gynecol Oncol. 2018;29(4):e75.
- Chiu HS, Somvanshi S, Patel E, et al. Pan-cancer analysis of lncRNA regulation supports their targeting of cancer genes in each tumor context. Cell Rep. 2018;23(1):297–312.
- Zhang R, Guo Y, Ma Z, et al. Long non-coding RNA PTENP1 functions as a ceRNA to modulate PTEN level by decoying miR-106b and miR-93 in gastric cancer. Oncotarget. 2017;8(16):26079–26089.
- Kotake Y, Nakagawa T, Kitagawa K, et al. Long non-coding RNA ANRIL is required for the PRC2 recruitment to and silencing of p15(INK4B) tumor suppressor gene. Oncogene. 2011;30(16):1956–1962.
- Poliseno L, Salmena L, Zhang J, et al. A coding-independent function of gene and pseudogene mRNAs regulates tumour biology. Nature. 2010;465(7301):1033–1038.
- Guo X, Deng L, Deng K, et al. Pseudogene PTENP1 suppresses gastric cancer progression by modulating PTEN. ACAMC. 2016;16(4):456–464.
- Kovalenko TF, Morozova KV, Ozolinya LA, et al. The PTENP1 pseudogene, unlike the PTEN gene, is methylated in normal endometrium, as well as in endometrial hyperplasias and carcinomas in middle-aged and elderly females. Acta Naturae. 2018;10(1):43–50.
- Yu G, Yao W, Gumireddy K, et al. Pseudogene PTENP1 functions as a competing endogenous RNA to suppress clear-cell renal cell carcinoma progression. Mol Cancer Ther. 2014;13(12):3086–3097.
- Kapodistrias N, Bobori C, Theocharopoulou G. MiR-140-3p downregulation in association with PDL-1 overexpression in many cancers: a review from the literature using predictive bioinformatics tools. Adv Exp Med Biol. 2017;988:225–233.
- Liu Y, Ding Y, Huang J, et al. MiR-141 suppresses the migration and invasion of HCC cells by targeting Tiam1. PLoS One. 2014;9(2):e88393.
- Zhang J, Chen D, Liang S, et al. miR-106b promotes cell invasion and metastasis via PTEN mediated EMT in ESCC. Oncol Lett. 2018;15(4):4619–4626.
- Karreth FA, Tay Y, Perna D, et al. In vivo identification of tumor-suppressive PTEN ceRNAs in an oncogenic BRAF-induced mouse model of melanoma. Cell. 2011;147(2):382–395.
- Tay Y, Kats L, Salmena L, et al. Coding-independent regulation of the tumor suppressor PTEN by competing endogenous mRNAs. Cell. 2011;147(2):344–357.
- Chen CL, Tseng YW, Wu JC, et al. Suppression of hepatocellular carcinoma by baculovirus-mediated expression of long non-coding RNA PTENP1 and microRNA regulation. Biomaterials. 2015;44:71–81.
- Khuu C, Utheim TP, Sehic A. The three paralogous microRNA clusters in development and disease, miR-17-92, miR-106a-363, and miR-106b-25. Scientifica (Cairo). 2016;2016:1379643–1379610.
- Kim BH, Hong SW, Kim A, et al. Prognostic implications for high expression of oncogenic microRNAs in advanced gastric carcinoma. J Surg Oncol. 2013;107(5):505–510.
- Yau WL, Lam CS, Ng L, et al. Over-expression of miR-106b promotes cell migration and metastasis in hepatocellular carcinoma by activating epithelial-mesenchymal transition process. PLoS One. 2013;8(3):e57882.
- Petrocca F, Vecchione A, Croce CM. Emerging role of miR-106b-25/miR-17-92 clusters in the control of transforming growth factor beta signaling. Cancer Res. 2008;68(20):8191–8194.
- Poliseno L, Salmena L, Riccardi L, et al. Identification of the miR-106b∼25 microRNA cluster as a proto-oncogenic PTEN-targeting intron that cooperates with its host gene MCM7 in transformation. Sci Signal. 2010;3(117):ra29–ra29.
- Qian YY, Li K, Liu QY, et al. Long non-coding RNA PTENP1 interacts with miR-193a-3p to suppress cell migration and invasion through the PTEN pathway in hepatocellular carcinoma. Oncotarget. 2017;8(64):107859–107869.
- Ivanovska I, Ball AS, Diaz RL, et al. MicroRNAs in the miR-106b family regulate p21/CDKN1A and promote cell cycle progression. Mol Cell Biol. 2008;28(7):2167–2174. Cleary MA,
- Yu M, Trobridge P, Wang Y, et al. Inactivation of TGF-beta signaling and loss of PTEN cooperate to induce colon cancer in vivo. Oncogene. 2014;33(12):1538–1547.
- Xu Z, Zheng G, Wang Y, et al. Aqueous Huaier extract suppresses gastric cancer metastasis and epithelial to mesenchymal transition by targeting twist. J Cancer. 2017;8(18):3876–3886.
- Pal M, Bhattacharya S, Kalyan G, et al. Cadherin profiling for therapeutic interventions in epithelial mesenchymal transition (EMT) and tumorigenesis. Exp Cell Res. 2018;368(2):137–146.
- Mulholland DJ, Kobayashi N, Ruscetti M, et al. Pten loss and RAS/MAPK activation cooperate to promote EMT and metastasis initiated from prostate cancer stem/progenitor cells. Cancer Res. 2012;72(7):1878–1889.