
Abstract
Microvascular disturbance, excessive inflammation and gliosis are key pathophysiologic changes in relation to functional status following the traumatic spinal cord injury (SCI). Continuous release of vascular endothelial growth factor (VEGF) to the lesion site was proved be able to promote the vascular remodelling, whereas the effects on reduction of inflammation and gliosis remain unclear. Currently, aiming at exploring the synergistic roles of VEGF and neurotrophin-3 (NT-3) on angiogenesis, anti-inflammation and neural repair, we developed a technique to co-deliver VEGF165 and NT-3 locally with a homotopic graft of tissue-engineered acellular spinal cord scaffold (ASCS) in a hemisected (3 mm in length) SCI model. As the potential in secretion of growth factors (GFs), bone mesenchymal stem cells (BMSCs) were introduced with the aim to enhance the VEGF/NT-3 release. Our data demonstrate that sustained VEGF/NT-3 release from ASCS significantly increases the local levels of VEGF/NT-3 and angiogenesis, regardless of whether it is in combination with BMSCs transplantation that exhibits positive effects on anti-inflammation, axonal outgrowth and locomotor recovery. This study verifies that co-delivery of VEGF/NT-3 reduces inflammation and gliosis in the hemisected spinal cord, promotes axonal outgrowth and results in better locomotor recovery, while the BMSCs transplantation facilitates these functions limitedly.
Introduction
Traumatic spinal cord injury (SCI) results in destruction of capillary network, activation of inflammation, loss of neural connectivity and formation of glial scar in the injured spinal cord [Citation1–3]. Microvascular disturbance was proved to be one of key factors to induce the deterioration of inflammation, neurodegeneration and dysfunction [Citation4,Citation5]. Several therapeutic methods based on reconstruction of vasculature have been reported [Citation6,Citation7]. Vascular endothelial growth factor (VEGF) is a pro-angiogenic substance with confirmed benefits for neuroprotection and neurotrophy [Citation8]. In our preliminary study, we found that continuous release of VEGF to the lesion site promotes vascular remodelling and functional recovery [Citation9], whereas the effects on reduction of inflammation and gliosis remain unclear. Dozens of reports indicate that diverse growth factors (GFs) such as neurotrophins, platelet-derived growth factor (PDGF), brain-derived neurotrophic factor (BDNF) have various effects on neural regeneration, anti-apoptosis, anti-inflammation, angiogenesis and inhibition of glial scarring. Co-delivery of GFs with synergistic effects to the lesion site is a promising treatment for SCI.
Several researchers have attempted to investigate the various combinations of GFs for SCI treatment. BDNF, PDGF, nerve growth factor (NGF), neurotrophin-3 (NT-3), fibroblast growth factor (FGF) and glial cell-derived neurotrophic factor (GDNF) are most commonly used and carefully appraised. NT-3 in combination with BDNF, NGF or PDGF promotes axonal re-entry into the distal cord and prevents excessive neural degeneration after acute SCI [Citation10–13]. NT-3 is a member of the neurotrophin family with neuroprotective effects on neuron survival, differentiation and synapse formation [Citation11,Citation14]. It was confirmed to be a high-affinity ligand for tropomyosin receptor kinase C (TrkC) [Citation15]. Ligand-receptor binding leads to activation of downstream signalling pathways including phosphatidylinositol 3-kinase (PI3K)/protein kinase B (Akt) and Ras/mitogen-activated protein kinase (Ras/MAPK), which were known to play important roles on neural repair [Citation16]. Further, NT-3 has also been found to participate in modulation of cutaneous microvascular network and promotion of vascularization and VEGF mRNA expression in bone marrow stromal cells [Citation17,Citation18]. Although the detailed mechanisms involved remain unclear, it can be speculated that NT-3 may be an angiogenic factor and at least in part mediated by VEGF action [Citation18].
Traditional strategies targeted at GFs delivery include local injection, osmotic pumps and well-constructed viral or cellular vectors [Citation19–22]. In recent years, delivery systems, such as biological or biosynthetic microspheres, nanoparticles (NPs) and porous scaffolds, have been developed [Citation23–25]. Poly (lactic-co-glycolic acid) (PLGA) is well known as its excellent biocompatibility, biodegradability and non-toxic degradation products [Citation26]. Also as a vector, PLGA is the most widely used biomaterial for fabricating the delivery system that can release GFs in a controlled manner. According to the ideal requisites, degradation time, initial burst and sustained releases of GFs are controllable. In this study, VEGF or NT-3 encapsulated PLGA-NPs were produced and conjugated into the acellular spinal cord scaffold (ASCS) with the aim to release the GFs controllably. ASCS has been investigated in recent years through chemical extraction methods [Citation27,Citation28]. The technique was applied to remove the immunogenic components of cellular constituents, debris and myelin sheaths, leaving behind the native extracellular matrix of collagen-rich 3D scaffold.
Bone mesenchymal stem cells (BMSCs) have low immunogenicity and potential ability to promote axonal outgrowth and differentiate into cells that express mature neuronal markers, and therefore, can be served as the seed cell for the engineering spinal cord [Citation29,Citation30]. However, there is still a prominent problem of low survival rate need to be solved [Citation31]. It was reported that BMSCs disappeared from the spinal cord in 3–4 weeks after transplantation [Citation32]. Studies have proved that BMSCs support the neural tissue repair by secretion of cytokines and GFs, such as VEGF, IGF-1 and HGF, although there is insufficient evidence that the transplanted BMSCs were differentiated into neural cells or integrated into the host tissue.
In summary, we planned to combine the GFs co-delivery technique and BMSCs transplantation on basis of the ASCS for the treatment of SCI in a hemisected rat model, with the aim to enhance the VEGF/NT-3 release through the GFs secretion by BMSCs, and to investigate the therapeutic effects on angiogenesis, anti-inflammation, anti-glial scarring and axonal outgrowth within the injured spinal cord.
Materials and methods
Preparation of VEGF165 or NT-3 encapsulated PLGA-NPs (V-NPs/N-NPs), ASCS and NPs conjugated ASCS
VEGF165 or NT-3 encapsulated PLGA-NPs were produced by double emulsion solvent evaporation technique reported previously with minor modifications [Citation33]. Briefly, the organic phase was prepared by dissolving 135 mg PLGA (50% (w:w) lactic acid, 50% (w:w) glycolic acid) (Jinan Daigang Biomaterial Co., Ltd, China) and 15 mg 1,2-distearoyl-sn-glycero-3-phosphoethanolamine-N-[methoxy(polyethylene glycol)-amine] (DSPE-PEG-NH2, Avanti, USA) in 3 mL dichloromethane (DCM, Sinopharm Chemical Reagent Co., Ltd, China). Then, 150 μg VEGF (VEGF165 recombinant protein, GeneTex, USA) or NT-3 (Cloud-Clone Corp, USA) was dissolved in 200 µL phosphate-buffered saline (PBS, Sigma, USA) containing 0.25% (W/V) bovine serum albumin (BSA, Sigma-Aldrich, USA) to produce an aqueous phase. These two phases were sonicated for 30 s at 50 W (JY92-II DN, Ningbo Scientz Biotechnology Co., Ltd, China) to form an O/W emulsion and then poured into 15 mL of 5% (W/V) polyvinyl alcohol (PVA, TCI America, USA) aqueous solution and sonicated again for 1 min to obtain a W1/O/W2 emulsion. The final emulsion was added to 25 mL of 2% (V/V) isopropanol and stirred to evaporate off the solvent at 42 °C using a mechanical stirrer (R210D, Shanghai, China). The entire procedure was carried out under aseptic conditions. Blank NPs (B-NPs) without VEGF165/NT-3 were produced as control.
Procedures for the preparation of ASCS were previously published [Citation9]. All animal procedures in the study were in accordance with the guidelines for the Welfare and Use of Laboratory Animals and approved by the Laboratory Animal Welfare & Ethics Committee of Fujian Medical University. The procedures were performed twice to remove the cellular constituents completely. The spinal cords were then free-dried and cut into 3-mm-long, 2.0-mm-diameter cylinders. Ultraviolet (UV) radiation for 30 min is necessary for in vitro and in vivo studies.
For NPs conjugated ASCS preparation, briefly, a segment of ASCS (3-mm-long, 2.0-mm-diameter) was incubated with 2 mL of 0.5% (W/V) genipin (GP) deionized water solution containing 5 mg of V-NPs and 5 mg of N-NPs (or 10 mg of B-NPs) on a percussion table (under vacuum condition) at 100 rpm for 48 h for complete crosslinking. The resultant scaffold (marked as VN-ASCS or B-ASCS, respectively) was rinsed with deionized water three times and freeze-dried for 24 h.
Characterization of NPs
V-NPs, N-NPs and B-NPs were characterized by morphology, particle size, zeta potential and polydispersity index (PDI). The morphology of the NPs was examined using a scanning electron microscopy (SEM, S-4800, Hitachi, Japan). For measurement of the mean particle size, zeta potential and PDI, NPs were dispersed in deionized water and sonicated for 5 min, and then transferred to plastic cuvette for measurements at 25 °C using laser particle & zeta potential analyzer (ZS90, Malvern Instruments Ltd, England). Each measurement was carried out in triplicate.
Determination of entrapment efficiency (EE, %) of V-NPs/N-NPs and crosslinking efficiency (CE, %) of VN-ASCS
EE (%) of V-NPs or N-NPs was calculated by an extraction method with an equation: EE (%) = (W1/W2) ×100%. For EE (%) of N-NPs, for example, 5 mg of N-NPs containing theoretical known weight of NT-3 (W2) was dissolved in 1 mL DCM, vortexed together with 5 mL PBS and then centrifuged at 25,200 rcf for 30 min to collect the supernatant. For calculation of the practical amount of NT-3 in N-NPs (W1), the supernatant was analysed by enzyme-linked immunosorbent assay (ELISA) following the manufacturer’s instructions (Rat Neurotrophin 3 & Vascular Endothelial Cell Growth Factor ELISA kit, CUSABIO, China) at 450 nm (BioTek Instruments, USA). W1 was then determined by comparing with the standard curve generated from known NT-3 concentrations (0 to 500 ng/mL). Each determination was carried out in triplicate.
CE (%) of VN-ASCS was calculated with the following equation: CE (%) = W3/(W1 + W2) × 100% where W1 is the weight of ASCS, W2 is the known weight of V-NPs and N-NPs added and W3 is the weight of resultant VN-ASCS following the steps of crosslinking, rinsing and freeze-drying. All measurements were carried out in triplicate.
Release kinetics of V-NPs, N-NPs and VN-ASCS
Procedures for determining VEGF165/NT-3 release kinetics from NPs or VN-ASCS are abbreviated below in accordance with the previously published technique. Weighted NPs or scaffolds were placed into a 1.5-mL microcentrifuge tube filled with 1 mL of PBS and then transferred into an incubator at 37 °C. Samples were centrifuged at 2800 rcf for 5 min to collect the supernatants after 1-, 3-, 9-, 24-, 48-, 96-, 168-, 240-, 360-, 480-, 600- and 720-h incubations. The supernatants were analysed by ELISA at 450 nm to calculate the amount of NT-3 or VEGF (μg mg NPs−1 or μg mg VN-ASCS−1) release during each time interval. PBS was completely changed every time. Each measurement was carried out in triplicate.
VEGF and NT-3 bioactivity assay
The bioactivity of VEGF or NT-3 released from NPs was determined by comparing the supernatant collected at 96-h incubation (see section “Release kinetics of V-NPs, N-NPs and VN-ASCS”) with the same concentration of VEGF/NT-3 aliquoted from fresh stock solution (positive control), or with the same volume of PBS (negative control). The activity of VEGF was evaluated by determining the proliferative capacity of human umbilical vein endothelial cells (HUVEC) [Citation34]. The proliferation of HUVEC exposed to the released VEGF or control medium for 48 h was presented as the optical density (OD) by the application of MTS reagent. The activity of NT-3 was evaluated by the neurite outgrowth bioassay of dorsal root ganglion (DRG) [Citation35]. After 48 h of culture in released NT-3 or control medium, the axonal outgrowth of DRGs was examined under a microscope. Each determination was carried out in triplicate.
Isolation, culture and identification of rat BMSCs
Isolation of primary rat BMSCs was based on our previous study [Citation36]. Briefly, four male Sprague-Dawley (SD) rats (age, 4 weeks; weight, 80–100 g) were sacrificed by cervical dislocation, and then, the femurs and tibias were aseptically excised from the hind limbs. Both ends of the bones were cut, and the marrow cavity was rinsed with 5 mL of PBS to acquire bone marrow cells/PBS suspension. The suspension was then centrifuged, resuspended in 4.5 g/L glucose Dulbecco’s Modified Eagle Medium (DMEM, Gibco, USA) supplemented with 2 mM L-glutamine (Gibco, USA), 10% fetal bovine serum (FBS, Gibco, USA), 1% penicillin-streptomycin and 0.3 µg/mL amphotericin B (Sigma, USA). Finally, the resuspension was plated into 25-cm2 culture flasks at 5 × 10⁵ cells/mL. After incubation in a 5% CO2 incubator at 37 °C, cells were subcultured when they reached approximately 90% confluence. Culture medium was changed every 3 days to remove haemocytes and non-adherent cells. For BMSCs identification, the third passage cells were osteogenic and adipogenic induced and stained for Alizarin Red S and Oil Red O, respectively. The induction and staining procedures were consistent with the published methods [Citation36,Citation37].
Co-culture of ASCS with BMSCs
For co-culture of ASCS (VN-, or B-ASCS) with BMSCs, cells were trypsinized and resuspended in the medium, and then dropwised on the top of the ASCS at a density of 1 × 10⁶ cells/mL. Thirty microlitres of cell suspension was added to each scaffold. After 3-h incubation for the initial cell attachment, 1.0 mL of medium per scaffold was added to continue culture at 37 °C. ASCS/BMSCs constructs were incubated for 3 days before implantation. The adhesion and proliferation of cells in the scaffolds were visualized with haematoxylin and eosin (H&E) staining and scanning electron microscopy (SEM, Quanta 450, FEI, USA).
Procedures for hemisected SCI and transplantations
Adult female SD rats (n = 64, 230–250 g) were used for hemisected SCI models. Briefly, after anaesthesia with an intraperitoneal injection of 0.3% pentobarbital sodium (30–40 mg/kg) and fur removal, a dorsal midline incision was made and the paravertebral muscles were retracted to expose the vertebral plates from T9 to T11. Followed by a laminectomy on the left side, the spinal cord was exposed to process the epidural cut, unilateral hemisection (a 3-mm-long gap was made) and ASCS (or ASCS/BMSCs-construct) transplantation. After haemostasis, the wound was closed in layers. Intramuscular injection of gentamicin (0.05 mL/200 g per day) and subcutaneous infusion of normal saline (NS, 5 mL per day) were performed within one week post-operatively. Bladder massage was performed twice a day until the recovery of urinary function.
Experimental groups
In the study, four experimental groups were established: (1) control group (n = 16) in which the rats underwent laminectomy and hemisected SCI; (2) BBC group (n = 16) in which the rats underwent hemisected SCI followed by implantation of B-ASCS/BMSCs-constructs; (3) VNA group (n = 16) in which the rats underwent hemisected SCI followed by implantation of VN-ASCS; (4) VNBC group (n = 16) in which the rats underwent hemisected SCI followed by implantation of VN-ASCS/BMSCs-constructs. The scheduled rats in each group were sacrificed at 1, 4 and 8 weeks post-operatively to study the angiogenesis, inflammation, gliosis and axonal outgrowth. The motor behaviour of the rats was assessed using the Basso, Beattie, and Bresnahan (BBB) locomotor rating scale at 3 days, and 1, 2, 4, 6 and 8 weeks post-injury before euthanasia. The assessment was performed by two examiners who were blinded to the treatment.
Determination of the VEGF/NT-3 levels in spinal cord homogenates
To study the VEGF/NT-3 levels within the injured spinal cord, the rats were deeply anaesthetized with pentobarbital sodium (60 mg/kg) and transcardially perfused with 200 mL of ice-cold PBS followed by the harvest of 1.0 cm of spinal cords centred at the epicentre on ice for determination. Briefly, fresh spinal cords were dissected and homogenized in lysis buffer (50 mM Tris, pH 7.4, 1% NP-40,150 mM NaCl, 0.5% sodium deoxycholate, 1 mM EDTA and protease inhibitor) and centrifuged for 10 min at 1500 g at 4 °C. The VEGF/NT-3 levels were determined with the ELISA kit (Rat Neurotrophin 3 & Vascular Endothelial Cell Growth Factor ELISA kit, CUSABIO, China) at 450 nm following the recommended manufacturer’s protocol. The levels were normalized against total protein. Each determination was performed in triplicate.
Immunofluorescence and quantitative analysis
At each time point post-injury, ten-millimetre-long segment of the spinal cords centred at the injury epicentre was harvested, post-fixed in 4% paraformaldehyde for 6 h and transferred to 30% sucrose solution overnight at 4 °C. Samples were then embedded in OCT (Miles-Bayer, Milano, Italy), frozen in a cryostat at –20 °C and sectioned into 20-µm-thick longitudinal sections for immunofluorescent staining. Briefly, after rewarming for 30 min at room temperature, the frozen sections were permeabilized with 0.5% Triton X-100 for 20 min and blocked with a solution of 5% bovine serum albumin (BSA, SW3015, Solarbio Life Sciences, China) for 30 min. The slides were incubated at 4 °C overnight with single or combinations of the following primary antibodies: (1) mouse anti-RECA1 (1:50, ab22492, Abcam, UK); (2) mouse anti-hypophosphorylated neurofilament H (anti-NF–H, 1:100, ab82259, Abcam, UK); (3) rabbit anti-glial fibrillary acidic protein (anti-GFAP, 1:500, ab7260, Abcam, UK) and (4) rabbit anti-CD68 (1:200, ab125212, Abcam, UK), and then incubated with the single or both secondary antibodies of Cy3 (or Alexa 488)-conjugated goat anti-rabbit IgG (1:500, CW0159, Cwbio, China) and Alexa 488 (or Cy3)-conjugated goat anti-mouse IgG (1:500, A0428, Beyotime, China) for 30 min at 25 °C. All slides were counterstained with DAPI (Jiangsu KeyGEN BioTECH Corp., Ltd, China) for 5 min and examined under a Laser Scanning Confocal Microscope (LSM780, Zeiss, Germany). All images were exported from the ZEN 2012 (blue edition) software.
As mentioned above, the spinal cord centred at the lesion site was continuously longitudinal-sectioned into 20 μm in thickness. For quantitative analysis, the sections were serially numbered as No.1 to No.50, and one in every five of the chosen sections (sections No.16 to No.40 were chosen) from each animal was selected. Three random 0.215 mm × 0.215 mm (or 0.430 mm × 0.215 mm) areas within the lesion site from each of the selected section were included for analysis. Thus, at each time point, a total of 15 areas per animal (n = 4 per group) were analysed. Images were imported into Fiji image J (version 1.51n, National Institutes of Health, NIH, USA) for calculations of biomarker-positive areas. Quantitative results were expressed as the percentages of the total area.
Statistical analysis
Statistical analyses were conducted using the SPSS 19.0 (SPSS Inc., Chicago, IL, USA). Experiment data were presented as mean ± standard deviation. One-way analysis of variance (ANOVA) with the Fisher LSD post hoc test was used for multiple group comparisons. Dunnett’s T3 test was performed when variances were unequal. The correlation analysis was carried out by Pearson’s test. A statistically significant difference was considered at a level of p < .05.
Results
Characterizations of NPs, ASCS and NPs conjugated ASCS
The high-magnification SEM images in present the spherical appearance of B-, V-, and N-NPs respectively, all with smooth surfaces in morphology. As shown in the images, particle sizes of NPs are predominately in the range of 120–280 nm in diameter. The size distribution was further detected by laser particle & zeta potential analyser. Due to the entrapment of GFs, particle sizes of V-NPs and N-NPs were bigger than B-NPs (). Other parameters including zeta potential and PDI are also displayed in . The zeta potential of NPs was determined to be positive, which was ascribed to the presence of amine groups on the surface.
Figure 1. High-magnification SEM images presented the spherical appearance of B-NPs (A), V-NPs (B) and N-NPs (C), respectively, all with smooth surfaces in morphology. High magnification SEM images shown in (D,E) displayed the morphology of VN-ASCS before and after the GP crosslinking, indicating that numerous NPs were conjugated into the ASCS internal surface successfully. Scale bar: A for 2.0 μm; B,C for 200 nm; D,E for 5.0 μm.
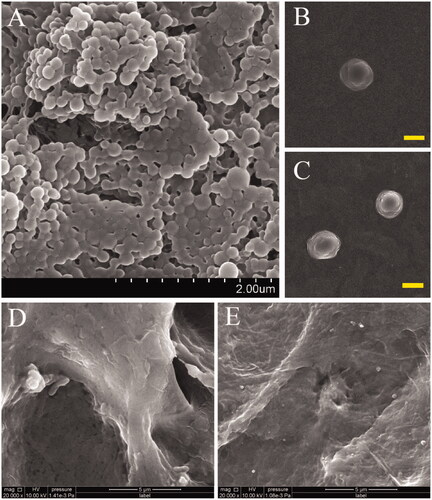
Table 1. Particle characteristics of NPs.
Since the preparation and characterization of ASCS was published in our previous work [Citation9], here we merely show the morphology of VN-ASCS before and after the GP crosslinking in high-magnification SEM images (). Numerous NPs were conjugated into the ASCS internal surface successfully.
Entrapment efficiency (EE, %), release kinetics and bioactivities of V-NPs and N-NPs
Based on the linear equation generated by VEGF or NT-3 ELISA standard curve, EE (%) of V-NPs and N-NPs was figured out as (62.4 ± 2.6)% and (68.4 ± 3.0)%, respectively (n = 3). The in vitro VEGF and NT-3 release profiles in the first 720 h are shown in and summarized in . Both V-NPs and N-NPs displayed an initial burst release within the first 24 h, followed by a relatively rapid release from 24 up to 96 h and a sustained release until 720 h.
Figure 2. In vitro VEGF and NT-3 release from V-NPs and N-NPs, respectively, in the first 720 h are shown in (A) and (B). And the release profiles of VEGF and NT-3 from VN-ASCS are similar, with an initial burst release within the first 24 h, followed by a relatively rapid release from 24 up to 96 h and a sustained release during the period of up to 720 h (C,D). Bioactivity assay for VEGF and NT-3 (E–H). As indicated by the OD value, HUVEC proliferation in VEGF release medium was significantly enhanced (p < .01), as compared with that of the negative control, and relatively lower (p < .05) than that of the positive control (E). After 48 h of culture, compared to the negative control (H), DRGs cultured in NT-3 release medium (G) extended significant neurite outgrowth, whereas the positive control (F) exhibited the most robust extension of the neurites and the highest density of DRG axons. Scale bar: F–H for 100 μm; *p < .05, **p < .01
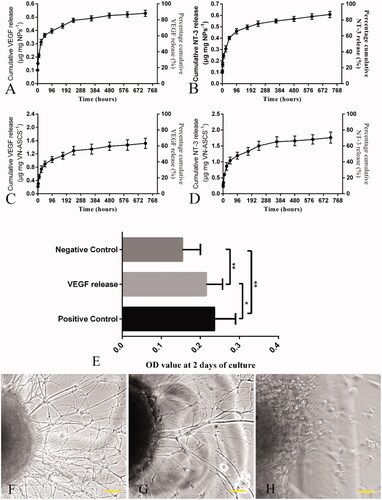
Table 2. Summary of VEGF/NT-3 release from V-NPs, N-NPs (μg mg NPs–1) and VN-ASCS (μg mg VN-ASCS–1).
After 48 h of culture in VEGF release medium, as indicated by the OD value, HUVEC proliferation was significantly enhanced (p < .01) as compared with that of the negative control, and relatively lower (p < .05) than that of the positive control (). As shown in , compared to the negative control (H), DRGs cultured in NT-3 release medium (G) extended significant neurite outgrowth, whereas the positive control (F) exhibited the most robust extension of the neurites and the highest density of DRG axons.
Crosslinking efficiency (CE, %) and release kinetics of VN-ASCS
CE (%) of VN-ASCS was calculated as percentage ratio of known weighted VN-ASCS to total amount of NPs and ASCS added for crosslinking. The result was (74.3 ± 5.2)% (n = 3). As shown in , the release profiles of VEGF and NT-3 from VN-ASCS were similar to that from NPs with an initial burst release within the first 24 h, followed by a relatively rapid release from 24 up to 96 h and a sustained release during the period of up to 720 h. Due to the drug loss within the entrapment and crosslinking process, we increased the dosage of V- and N-NPs for crosslinking in this study, and the kinetic details are summarized in .
Culture and differential identification of BMSCs
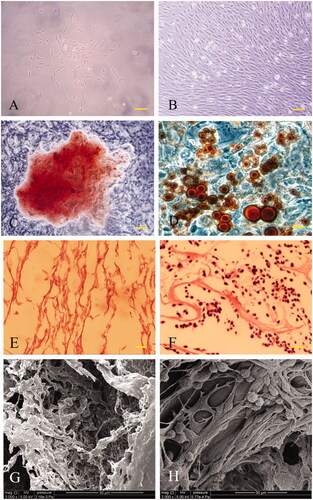
A small number of cells were seen to adhere to the dish surfaces after 24 h in primary culture. The adherent cells increased over time and appeared as a long fusiform or spindly in shape, which was the typical morphology of BMSCs (). As shown in , BMSCs exhibited a typical gyrate growth when they reached at least 90% of fusion. The osteogenic differentiation potential of BMSCs was verified by osteogenic induction for 3 weeks followed by Alizarin Red S staining for calcium nodules (). Moreover, after 2 weeks of adipogenic induction, BMSCs were successfully differentiated into adipocytes and confirmed by Oil Red O staining, which demonstrated the numerous intracellular lipid droplets ().
Figure 3. Light microscopic images showed the adherent BMSCs having an appearance of a long fusiform or spindly in shape (A) and a typical gyrate growth when they reached at least 90% of fusion (B). The osteogenic and adipocyte differentiation potentials of BMSCs were verified by Alizarin Red S staining for calcium nodules (C) and Oil Red O staining for adipocytes (D), respectively. ASCS exhibited a regular reticular, interconnected porous structure and was observed by H&E staining (E) and SEM (G). The adhesion and proliferation of BMSCs in the 3D porous scaffolds were also observed by H&E staining (F) and SEM (H). Scale bar: A,B for 100 μm; C–F for 200 μm.
Morphological observation of ASCS and co-culture of ASCS and BMSCs
After decellularization and lyophilization, the cellular components within the spinal cord were completely wiped off and a regular reticular structure was formed and observed by H&E staining (). Under SEM observation, ASCS exhibited an interconnected porous structure together with the similar pore size and porosity to the previously published results () [Citation9]. After co-culture of ASCS and BMSCs for 2 weeks in vitro, the constructs were examined by histology and SEM. The images displayed in verified the adhesion and proliferation of BMSCs in the 3D porous scaffolds.
Post-operative VEGF and NT-3 levels at the epicentre of injury
As shown in , compared to Control and BBC groups, conjugation of VEGF/NT-3-NPs to the ASCS in VNA and VNBC groups significantly increased (p < .001) the levels of VEGF and NT-3 within the injured spinal cord, although the detected levels declined sharply from 1 week to 4 weeks post-injury (p < .001). Compared to Control, BMSC transplantation in BBC group increased the VEGF levels at both 1 and 4 weeks (p < .001), while the NT-3 was unaffected at 1 week (p > .05). Both VEGF and NT-3 levels showed no statistically significant differences between VNA and VNBC groups at both 1 week and 4 weeks (p > .05). All data are summarized in .
Figure 4. Post-operative levels of VEGF (A) and NT-3 (B) at the lesion site determined by ELISA. Compared to Control and BBC groups, conjugation of VEGF/NT-3-NPs to the ASCS in VNA and VNBC groups significantly increased (p < .001) the levels of VEGF and NT-3 within the injured spinal cord, although the detected levels declined sharply from 1 week to 4 weeks post-injury (p < .001). Compared to Control, BMSC transplantation in BBC group increased the VEGF levels at both 1 and 4 weeks (p < .001), while the NT-3 was unaffected at 1 week (p > .05). Both VEGF and NT-3 levels showed no statistically significant differences between VNA and VNBC groups at both 1 week and 4 weeks (p > .05).
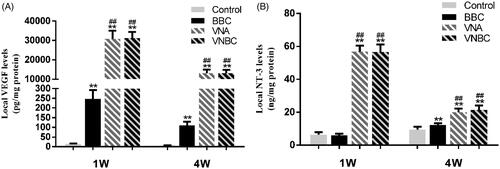
Table 3. Summary of VEGF/NT-3 levels within the spinal cord at 1 W and 4 W post-injury.
Post-operative blood vessel changes within the spinal cords
To visualize the blood vessels, an antibody specific for rat endothelial cell (RECA1) was used for immunofluorescent staining. Rats were sacrificed 1 week and 8 weeks post-operatively to study the changes of the vasculature at the epicentre, the rostral/caudal border and both ends far from the lesion site. Immunofluorescence microscopy revealed generally greater density of RECA1+ blood vessels at the lesion site (within or around the epicentre) than at both ends far from the lesion site, and greater at the rostral/caudal border than at the epicentre in all injured spinal cords (). The schematic diagram shown in indicated the five sections taken from one spinal cord from left end to right end, which are displayed in in sequence (A for Control; B for BBC group; C for VNA group; D for VNBC group). At both post-operative time points, the densities of RECA1+ blood vessels in BBC, VNA and VNBC groups were obviously higher than in Control group (p < .001). Moreover, the blood vessels in both VNA and VNBC groups were more intensive than in BBC group (p < .001). It is worth mentioning that there was no statistically significant difference between VNA and VNBC groups at two time points (p > .05). Quantitative results are given in and , and the statistical comparisons among the four groups are also displayed in the figure. The blood vessels within the spinal cord were obviously decreased from 1 week to 8 weeks, especially at the rostral border, epicentre and caudal border of the lesion site in all four groups.
Figure 5. Vascular changes at the rostral border, epicentre and caudal border of the lesion site, and at both ends far from the lesion site within the spinal cord were visualized by immunofluorescent staining for RECA-1 positive endothelial cells (red). Cell nuclei were counterstained with DAPI (blue). Immunofluorescent images shown in (A–D) revealed the greater density of RECA1+ blood vessels at the lesion site (within or around the epicentre) than at both ends far from the lesion site and greater at the rostral/caudal border than at the epicentre in all injured spinal cords at 1 week post-injury. The schematic diagram shown in (E) indicated the five sections taken from a segment of spinal cord from left end to right end, which are displayed in (A–D) in sequence (A for Control group; B for BBC group; C for VNA group; D for VNBC group). Quantitative results shown in (F,G) demonstrate that at both post-operative time points, the densities of RECA1+ blood vessels in BBC, VNA and VNBC groups were obviously higher than in Control group (p < .001). Moreover, the blood vessels in both VNA and VNBC groups were more intensive than in BBC group (p < .001). Further, there was no statistically significant difference between VNA and VNBC groups at two time points (p > .05). The blood vessels within the spinal cord were obviously decreased from 1 week to 8 weeks, especially at the rostral border, epicentre and caudal border of the lesion site in all four groups. Vascular densities at both ends far from the lesion site were ordinarily lower than at the lesion site, and significantly higher densities in VEGF/NT-3-treated rats than the others were shown at the rostral ends, indicating that newly formed vessels might originate from the rostral of lesion site and enriched at the lesion site. Scale bar (A–D): 50 μm. *p < .05 versus Control group; **p < .01 versus Control group; ##p < .01 versus BBC group.
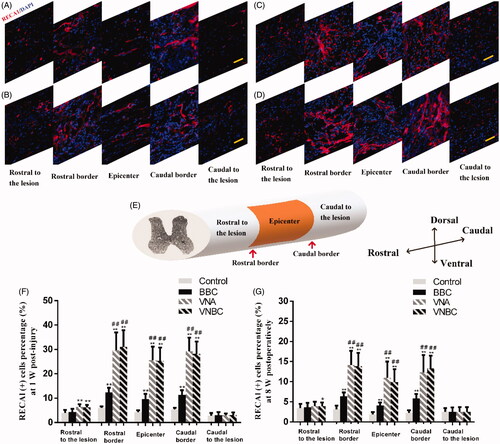
Table 4. Quantitative immunofluorescent analysis of RECA1+ blood vessels percentage (%) at 1 W and 8 W post-injury.
Post-operative expressions of CD68+ macrophages and correlation with RECA1+ vessels
To study the infiltration of inflammatory cells into the lesion site, CD68 was used to stain the macrophages at 8 W post-injury. As shown in , the highest level of infiltrated macrophages was observed in Control, while the least of CD68+ cells was seen in VN-ASCS-treated groups (VNA and VNBC groups). Quantitative analysis indicate that the percentage of CD68+ cells was the highest in Control group [(37.21 ± 10.13)%], higher in BBC group [(23.53 ± 7.24)%] and the lowest in VNBC group [(14.48 ± 4.13)%] (p < .001). Although the data in VNA group [(16.86 ± 5.25)%] was close to those in VNBC group, statistical comparison revealed a significant difference between these two groups (p < .05) ().
Figure 6. Immunofluorescent staining for CD68+ macrophages demonstrates the different intensities of CD68+ cells within the lesion site in Control, BBC, VNA and VNBC groups (A–D). Quantitative analysis (E) indicate the percentage of CD68+ cells was the highest in Control group [(37.21 ± 10.13)%], higher in BBC group [(23.53 ± 7.24)%] and the lowest in VNBC group [(14.48 ± 4.13)%] (p < .001). Images of the double immunofluorescent staining for CD68 and RECA1 show the positional relationship between macrophages and blood vessels within the lesion site in VNA and VNBC groups (F, G for VNA group, and H, I for VNBC group, respectively). More intensive blood vessels ordinarily accompany with lower infiltration of macrophages, and vice versa. Pearson’s test indicated the negative correlation (correlation coefficient r = –0.803, p < .001 and r = –0.876, p < .001 for VNA and VNBC group, respectively) between CD68+ macrophages and RECA1+ vessels (J–K). Scale bar: A–D for 100 μm; F–I for 50 μm. **p < .01 versus Control group; ##p < .01 versus BBC group; ∧p < .05 versus VNA group.
![Figure 6. Immunofluorescent staining for CD68+ macrophages demonstrates the different intensities of CD68+ cells within the lesion site in Control, BBC, VNA and VNBC groups (A–D). Quantitative analysis (E) indicate the percentage of CD68+ cells was the highest in Control group [(37.21 ± 10.13)%], higher in BBC group [(23.53 ± 7.24)%] and the lowest in VNBC group [(14.48 ± 4.13)%] (p < .001). Images of the double immunofluorescent staining for CD68 and RECA1 show the positional relationship between macrophages and blood vessels within the lesion site in VNA and VNBC groups (F, G for VNA group, and H, I for VNBC group, respectively). More intensive blood vessels ordinarily accompany with lower infiltration of macrophages, and vice versa. Pearson’s test indicated the negative correlation (correlation coefficient r = –0.803, p < .001 and r = –0.876, p < .001 for VNA and VNBC group, respectively) between CD68+ macrophages and RECA1+ vessels (J–K). Scale bar: A–D for 100 μm; F–I for 50 μm. **p < .01 versus Control group; ##p < .01 versus BBC group; ∧p < .05 versus VNA group.](/cms/asset/714d3057-7cd9-4944-817e-855b901493f0/ianb_a_1709860_f0006_c.jpg)
To further study the positional relationship between macrophages and blood vessels within the lesion site, double immunofluorescent staining for CD68 and RECA1 was applied. Random areas in VNA and VNBC groups at 8 weeks post-injury were analysed. The correlation analysis was based on the percentages of CD68 and RECA1 positive areas. As shown in (F, G for VNA group, and H, I for VNBC group, respectively), more intensive blood vessels within the lesion site ordinarily accompany with lower infiltration of macrophages, and vice versa. Pearson’s test indicated the negative correlation (correlation coefficient r = −0.803, p < .001 and r = −0.876, p < .001 for VNA and VNBC groups, respectively) between CD68+ macrophages and RECA1+ vessels ().
Post-operative expressions of axonal marker neurofilament-H (NF–H) and astrocyte-specific marker GFAP
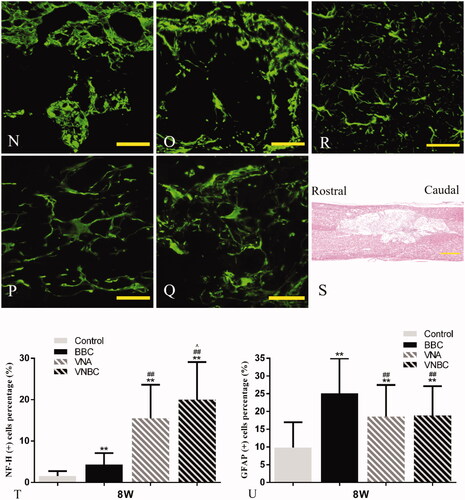
To assess the presence of axons and astrocytes within the different groups, NF–H and GFAP were used to double stain the neuron-specific cytoskeletal components and reactive/unreactive astrocytes within the glial scar at 8 weeks post-injury. Random areas captured from rostral, epicentre and caudal of the lesion site were analysed. As shown in , immunolabeling for NF–H revealed that compared to Control, NF–H+ axons across the lesion site increased amazingly due to the treatment of VNA or VNBC, while comparatively slight increase of red fluorescent signal was displayed in BBC group. The robust extension of NF–H+ axons (white arrows) could be found across the rostral border, epicentre and caudal border of the lesion site in VNA and VNBC groups. Comparatively single BMSCs-loaded ASCS transplantation in BBC group did not exhibit robust axons extension following the SCI. On the other hand, GFAP+ astrocytes were visualized extensively covering the epicentre and the borders of the lesion site in all injured spinal cords. Relative to BBC-treated rats, the GFAP+ scarring in VNA and VNBC groups was significantly decreased (p < .001). Due to the formation of extensive cavities shown in , the least amount of GFAP+ scarring (p < .001) was found in Control group. Normal NF–H+ axons and GFAP+ astrocytes within the spinal cord are shown in as a control. Morphological details of the astrocytes in each group are shown in with the normal morphology shown in as a control. Compared to the astrocytes with long, thin branched processes in VNA and VNBC groups similar in morphology to that in normal control, astrocytes in Control and BBC groups exhibited larger cell soma with thicker and shorter processes. Quantitative results demonstrated that the percentage of NF–H+ cells was the highest in VNBC group [(19.98 ± 9.12)%], higher in VNA group [(15.48 ± 8.13)%] and BBC group [(4.35 ± 2.74)%], and the lowest in Control group [(1.57 ± 1.16)%] (p < .001, ). Quantitative results for the percentages of GFAP+ astrocytes in all groups were listed below: Control group: (9.84 ± 7.11)%; BBC group: (25.10 ± 9.87)%; VNA group: (18.57 ± 8.89)%; VNBC group: (18.82 ± 8.30)% (). There are no significant differences between VNA and VNBC groups (p > .05). Other statistical comparisons among the four groups were all displayed in the figure.
Figure 7. Double immunofluorescent staining for NF–H (for axons, red) and GFAP (for astrocytes, green) at the rostral border (A,D,G,J), epicentre (B,E,H,K) and caudal border (C,F,I,L) of the lesion site at 8 weeks post-injury demonstrates the differences among Control (A–C), BBC (D–F), VNA (G–I) and VNBC (J–L) groups. Details of normal NF–H+ axons and GFAP+ astrocytes within the spinal cord are shown in (M) as a normal control. As the rostral or caudal intact/injured border discerned by dotted lines, the robust extension of NF–H+ axons (white arrows) could be found across the rostral border, epicentre and caudal border of the lesion site in VNA and VNBC groups, indicating the combination of VEGF and NT-3 delivery could bridge the injury site and extend the axonal processes into the caudal host tissue. Comparatively single BMSCs-loaded ASCS transplantation did not exhibit robust axons extension. GFAP+ astrocytes were visualized extensively covering the epicentre and the borders of the lesion site in all injured spinal cords. Due to the formation of extensive cavities shown in (S), the least amount of GFAP+ scarring was found in Control. Relative to BBC-treated rats, the GFAP+ scarring in VNA and VNBC groups was significantly decreased, indicating that higher density of axonal extension ordinarily accompanies with lower formation of gliosis within the lesion site. Morphological details of the astrocytes in each group are shown in (N–Q) with the normal morphology shown in (R) as a control. Compared to the astrocytes with long, thin branched processes in VNA (P) and VNBC (Q) groups similar in morphology to those in normal control, and astrocytes in Control (N) and BBC (O) groups exhibited larger cell soma with thicker and shorter processes. Quantitative analysis (T,U) demonstrates the percentages of NF–H+ and GFAP+ cells and statistical comparisons among the four groups. Scale bar: A–M for 50 μm; N–R for 50 μm; S for 500 μm. **p < .01 versus Control group; ##p < .01 versus BBC group; ∧p < .05 versus VNA group.

Locomotor recovery determined by BBB scores
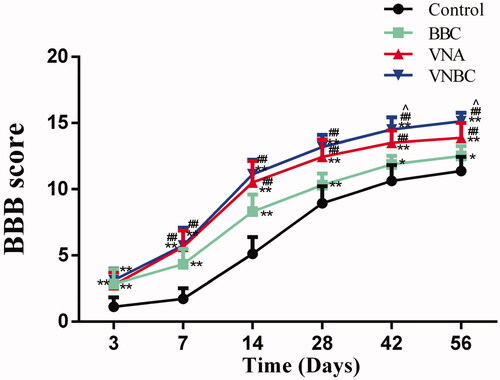
As shown in , BBB locomotor scores in the injured rats were all increased with time. Compared to Control, rats underwent BBC, VNA or VNBC treatment achieved significantly higher scores at all time points post-injury (p < .01 or <.05). Further, comparisons between the BBC and VNA groups revealed that equally combined with the ASCS, release of VEGF and NT-3 from the tissue-engineered scaffolds always associated with better locomotor recovery than that implant of scaffolds loaded with BMSCs at all time points except Day 3 (p < .01). In addition, there are no significant differences (p > .05) between VNA and VNBC groups before Day 42. At days 42 and 56, the rats underwent VNBC scored significantly higher than those in VNA group with p < .05 (scored 14.50 ± 0.93 vs 13.50 ± 0.93 for Day 42, 15.13 ± 0.64 vs 13.88 ± 1.13 for Day 56, respectively). Results indicated that co-delivery of VEGF and NT-3 facilitated functional recovery in the hemisected SCI model, and the combined treatment of GFs co-delivery and BMSCs transplantation further promoted locomotor recovery at the chronic phase of SCI.
Figure 8. The line chart displays the BBB locomotor scores in Control, BBC, VNA and ABVN groups. Relative to Control group, rats underwent BBC, VNA or VNBC treatment achieved significantly higher scores at all time points post-injury (p < .01 or <.05). Comparisons reveal that the release of VEGF and NT-3 from the tissue-engineered scaffolds always associated with better locomotor recovery at all time points except Day 3 (p < .01). At days 42 and 56, the rats underwent VNBC scored significantly higher than those in VNA group with p < .05. **p < .01 versus Control group; *p < .05 versus Control group; ##p < .01 versus BBC group; ∧p < .05 versus VNA group.
Discussion
The newly formed vessels are capable of eliminating necrotic cells, debris, reactive oxygen species and metabolic products within the injured spinal cord, resulting in the improvement of neural repair. Enhanced angiogenesis, increased local vascular density and promoted axonal survival as well as improved BBB scores were observed in the VEGF-delivered rats [Citation38,Citation39]. With the purpose of further promotion of therapeutic effects on traumatic SCI, NT-3 was chosen as a synergy to release within the lesion site. Co-delivery of VEGF and NT-3 has the potential to play synergistic roles on nerve repair via both vascular and neural approaches. In the study, NPs encapsulating VEGF or NT-3 were synthesized at a nano-scale with low PDI (<0.2), which means a narrow size distribution and a high homogeneity in the particle population. The high entrapment efficiency might be attributed to homogeneous formulation of NPs. Although the bioactivity of the GFs was probably decreased due to the NPs encapsulation, VEGF and NT-3 applied in this study still exhibited significant effects on HUVEC proliferation and DRG neurite outgrowth, respectively. The VEGF or NT-3 was released from ASCS in a controlled manner, to some extent consistent with the previously published data [Citation10,Citation35,Citation40]. Further, VEGF and NT-3 levels at the lesion epicentre were detectable by ELISA. Results indicated that VN-ASCS implants obviously increased the VEGF and NT-3 levels, while loaded with or without BMSC might not change them. These results might mainly ascribe to (1) relatively lower level of BMSCs VEGF secretion than the exogenous VEGF; (2) undetectable level of NT-3 secretion by BMSCs and (3) the rapid elimination of BMSCs after transplantation.
After a partial spinal cord transection injury, the vasculature was significantly decreased during the first 48 h for the tissue loss, followed by a significant increase in vessel density at around 5 days. Finally, the number of blood vessels declined beginning at 1-week post-lesion concurrent with the cavity formation [Citation41]. In the present work, results disclosed that BMSCs-loaded ASCS transplantation promoted the angiogenesis limitedly, whereas the co-delivery of VEGF and NT-3 in VNA or VNBC group enhanced the formation of neovasculature dramatically as compared to that in BBC group. Further, vascular densities at both ends far from the lesion site were ordinarily lower than at the lesion site, and significantly higher densities in VEGF/NT-3-treated rats than the others were shown at the rostral ends, indicating that newly formed vessels might originate from the rostral of lesion site and enriched at the lesion site. In addition, the angiogenesis across the lesion site visualized by immunofluorescence was roughly parallel to the levels of VEGF/NT-3 determined by the ELISA.
How the enhanced angiogenesis promote functional recovery? As we know, vascular damage following SCI originates the onset of spinal cord ischaemia, haemorrhage, oedema and destruction of the blood-spinal cord barrier (BSCB). Therapies aimed at restoring or regenerating the vasculature would mediate the improvement of blood vessel-related pathological changes. Further, the influx of inflammatory cells into the spinal cord would be reduced by restoring proper blood flow [Citation42]. We assume that inflammatory reaction might be inhibited by clearing up the local apoptotic cells, debris, metabolic products and inflammatory cytokines through the new formed blood vessels. As these harmful substances were engulfed by macrophages, the RECA1+ blood vessels, CD68+ macrophages and their mutual correlation were studied. Results indicated the extent of infiltration of macrophages into the lesion site was the highest in Control and decreased from Control-, BBC- and VNA- to VNBC-treated rats. Further, results also demonstrated a common phenomenon in which plenty blood vessels ordinarily accompanied with relatively low density of macrophages at the lesion site. We conclude that enhanced angiogenesis induced by co-delivery of VEGF and NT-3 or/and BMSCs transplantation reduces inflammation in the hemisected spinal cord.
In the study, co-delivery of VEGF and NT-3 exhibited a promising effect on axonal regeneration and a potential to bridge the lesion cavity by extending the axonal processes. Further, enhanced axonal extension ordinarily accompanied with lower formation of glial scarring within the lesion site. Although the anticipated effect of GFs-release enhancement seemed limited, BMSCs transplantation in combination with GFs co-delivery slightly increases the NF–H+ axons compared to the co-delivery therapy alone, and the amount or the activity of GFAP+ astrocytes was not affected by BMSCs transplantation. Reactive gliosis has been considered as the major cause of regenerative failure following SCI, while the astrocyte morphology is an indicator of its activity (reactive or unreactive) in response to the injury [Citation43]. Normally unreactive astrocytes have long, thin branched processes, in contrast to the reactive astrocytes with enlarged cell soma, thick and short processes [Citation44]. Details of astrocyte morphology revealed that higher density of reactive astrocytes was found in Control and BBC groups than in VNA and VNBC groups, indicating that VEGF/NT-3 co-delivery reduced the glial reactivity and resulted in the significantly decrease of GFAP+ glial scarring. The least amount of GFAP+ scarring in Control group might ascribe to the most extensive formation of cavities within the injured spinal cord. BMSCs transplantation alone in BBC group showed limited improvement of axonal regeneration and slight inhibition of glial formation as compared to Control. Locomotor recovery appraised by BBB scores verified the highest improvement in VNBC-treated rats, higher in VNA-treated rats and the lowest in BBC-treated rats at 42 and 56 days post-injury, as compared to Control. In conclusion, co-delivery of VEGF/NT-3 reduced inflammation and gliosis in the hemisected spinal cord, promoted axonal outgrowth and resulted in better locomotor recovery, while the BMSCs transplantation facilitated these functions limitedly.
Although positive results regarding the effects of GFs co-delivery on histological and functional recovery were verified, there are still several drawbacks in this study that needs to be considered. First, BMSCs were chosen as the seed cell with the aim to enhance the GFs release through the cell secretion. Relatively low level of GFs secretion might inhibit the therapeutic effects as expected. More sufficient alternatives could be considered as the seed cells for GFs co-delivery study. Second, detailed mechanisms underlying the interaction between VEGF and NT-3, and their synergetic effects on neural repair are still unclear that remain to be investigated. Single VEGF or NT-3 delivery could be studied as the control to illuminate the above-mentioned mechanisms. Third, more targets such as neural differentiation, synapse formation and specific nerve tracts regeneration should be introduced to acquiring more knowledge for further investigating the co-delivery method on functional recovery.
Conclusions
In this study, co-delivery of VEGF165 and NT-3 in combination with BMSCs transplantation on basis of ASCS was applied for treating a spinal cord hemisected injury model in rats. Transplantation of VEGF/NT-3-NPs conjugated ASCS significantly increases the levels of VEGF/NT-3 (detectable by ELISA) and angiogenesis at the lesion site, regardless of whether it is in combination with BMSCs transplantation that exhibits positive effects on anti-inflammation, axonal outgrowth and locomotor recovery. This study verifies that co-delivery of VEGF/NT-3 reduces inflammation and gliosis in the hemisected spinal cord, promotes axonal outgrowth and results in better locomotor recovery, while the BMSCs transplantation facilitates these functions limitedly.
Disclosure statement
No potential conflict of interest was reported by the authors.
Additional information
Funding
References
- Lai BQ, Che MT, Du BL, et al. Transplantation of tissue engineering neural network and formation of neuronal relay into the transected rat spinal cord. Biomaterials. 2016;109:40–54.
- Mautes AE, Weinzierl MR, Donovan F, et al. Vascular events after spinal cord injury: contribution to secondary pathogenesis. Phys Ther. 2000;80:673–687.
- Wen Y, Yu S, Wu Y, et al. Spinal cord injury repair by implantation of structured hyaluronic acid scaffold with PLGA microspheres in the rat. Cell Tissue Res. 2016;364(1):17–28.
- Popa C, Popa F, Grigorean VT, et al. Vascular dysfunctions following spinal cord injury. J Med Life. 2010;3(3):275–285.
- Esposito E, Mazzon E, Paterniti I, et al. Olprinone attenuates the acute inflammatory response and apoptosis after spinal cord trauma in mice. PLoS One. 2010;5(9):e12170.
- Kundi S, Bicknell R, Ahmed Z. The role of angiogenic and wound-healing factors after spinal cord injury in mammals. Neurosci Res. 2013;76(1–2):1–9.
- Hu JZ, Long H, Wu TD, et al. The effect of estrogen-related receptor alpha on the regulation of angiogenesis after spinal cord injury. Neuroscience. 2015;290:570–580.
- Ruiz de Almodovar C, Lambrechts D, Mazzone M, et al. Role and therapeutic potential of VEGF in the nervous system. Phys Rev. 2009;89(2):607–648.
- Xu ZX, Zhang LQ, Wang CS, et al. Acellular spinal cord scaffold implantation promotes vascular remodeling with sustained delivery of VEGF in a rat spinal cord hemisection model. Curr Neurovascular Res. 2017;14(3):274–289.
- Johnson PJ, Tatara A, Shiu A, et al. Controlled release of neurotrophin-3 and platelet-derived growth factor from fibrin scaffolds containing neural progenitor cells enhances survival and differentiation into neurons in a subacute model of SCI. Cell Transplant. 2010;19(1):89–101.
- Keefe KM, Sheikh IS, Smith GM. Targeting neurotrophins to specific populations of neurons: NGF, BDNF, and NT-3 and their relevance for treatment of spinal cord injury. Int J Mol Sci. 2017;18(3):548.
- Bamber NI, Li H, Lu X, et al. Neurotrophins BDNF and NT-3 promote axonal re-entry into the distal host spinal cord through Schwann cell-seeded mini-channels. Eur J Neurosci. 2001;13:257–268.
- Brock JH, Rosenzweig ES, Blesch A, et al. Local and remote growth factor effects after primate spinal cord injury. J Neurosci. 2010;30(29):9728–9737.
- McCall J, Weidner N, Blesch A. Neurotrophic factors in combinatorial approaches for spinal cord regeneration. Cell Tissue Res. 2012;349(1):27–37.
- Huang EJ, Reichardt LF. Neurotrophins: roles in neuronal development and function. Annu Rev Neurosci. 2001;24(1):677–736.
- Blum R, Konnerth A. Neurotrophin-mediated rapid signaling in the central nervous system: mechanisms and functions. Physiology (Bethesda, MD). 2005;20:70–78.
- Blais M, Levesque P, Bellenfant S, et al. Nerve growth factor, brain-derived neurotrophic factor, neurotrophin-3 and glial-derived neurotrophic factor enhance angiogenesis in a tissue-engineered in vitro model. Tissue Eng A. 2013;19(15–16):1655–1664.
- Su YW, Chung R, Ruan CS, et al. Neurotrophin-3 induces BMP-2 and VEGF activities and promotes the bony repair of injured growth plate cartilage and bone in rats. J Bone Miner Res. 2016;31(6):1258–1274.
- Lee JY, Giusti G, Friedrich PF, et al. Effect of vascular endothelial growth factor administration on nerve regeneration after autologous nerve grafting. J Reconstr Microsurg. 2015;32(03):183–188.
- Coumans JV, Lin TT, Dai HN, et al. Axonal regeneration and functional recovery after complete spinal cord transection in rats by delayed treatment with transplants and neurotrophins. J Neurosci. 2001;21(23):9334–9344.
- Koda M, Kamada T, Hashimoto M, et al. Adenovirus vector-mediated ex vivo gene transfer of brain-derived neurotrophic factor to bone marrow stromal cells promotes axonal regeneration after transplantation in completely transected adult rat spinal cord. Eur Spine J. 2007;16:2206–2214.
- Gunther MI, Weidner N, Muller R, et al. Cell-seeded alginate hydrogel scaffolds promote directed linear axonal regeneration in the injured rat spinal cord. Acta Biomater. 2015;27:140–150.
- Li W, Lan Y, Guo R, et al. In vitro and in vivo evaluation of a novel collagen/cellulose nanocrystals scaffold for achieving the sustained release of basic fibroblast growth factor. J Biomater Appl. 2015;29(6):882–893.
- Mohtaram NK, Montgomery A, Willerth SM. Biomaterial-based drug delivery systems for the controlled release of neurotrophic factors. Biomed Mater. 2013;8(2):022001.
- Li G, Che MT, Zhang K, et al. Graft of the NT-3 persistent delivery gelatin sponge scaffold promotes axon regeneration, attenuates inflammation, and induces cell migration in rat and canine with spinal cord injury. Biomaterials. 2016;83:233–248.
- Han FY, Thurecht KJ, Whittaker AK, et al. Bioerodable PLGA-based microparticles for producing sustained-release drug formulations and strategies for improving drug loading. Front Pharmacol. 2016;7:185.
- Guo SZ, Ren XJ, Wu B, et al. Preparation of the acellular scaffold of the spinal cord and the study of biocompatibility. Spinal Cord. 2010;48(7):576–581.
- Chen J, Zhang Z, Liu J, et al. Acellular spinal cord scaffold seeded with bone marrow stromal cells protects tissue and promotes functional recovery in spinal cord-injured rats. J Neurosci Res. 2014;92(3):307–317.
- Woodbury D, Schwarz EJ, Prockop DJ, et al. Adult rat and human bone marrow stromal cells differentiate into neurons. J Neurosci Res. 2000;61(4):364–370.
- Qu J, Zhang H. Roles of mesenchymal stem cells in spinal cord injury. Stem Cells Int. 2017;2017:1–12.
- Lin L, Lin H, Bai S, et al. Bone marrow mesenchymal stem cells (BMSCs) improved functional recovery of spinal cord injury partly by promoting axonal regeneration. Neurochem Int. 2018;115:80–84.
- Nakano N, Nakai Y, Seo TB, et al. Characterization of conditioned medium of cultured bone marrow stromal cells. Neurosci Lett. 2010;483(1):57–61.
- Herran E, Perez-Gonzalez R, Igartua M, et al. VEGF-releasing biodegradable nanospheres administered by craniotomy: a novel therapeutic approach in the APP/Ps1 mouse model of Alzheimer's disease. J Controlled Release. 2013;170:111–119.
- Rui J, Dadsetan M, Runge MB, et al. Controlled release of vascular endothelial growth factor using poly-lactic-co-glycolic acid microspheres: in vitro characterization and application in polycaprolactone fumarate nerve conduits. Acta Biomater. 2012;8(2):511–518.
- Liu T, Xu J, Chan BP, et al. Sustained release of neurotrophin-3 and chondroitinase ABC from electrospun collagen nanofiber scaffold for spinal cord injury repair. J Biomed Mater Res. 2012;100:236–242.
- Xu ZX, Li T, Zhong ZM, et al. Amide-linkage formed between ammonia plasma treated poly(D,L-lactide acid) scaffolds and bio-peptides: enhancement of cell adhesion and osteogenic differentiation in vitro. Biopolymers. 2011;95(10):682–694.
- An Q, Wu D, Ma Y, et al. Suppression of evi1 promotes the osteogenic differentiation and inhibits the adipogenic differentiation of bone marrow-derived mesenchymal stem cells in vitro. Int J Mol Med. 2015;36(6):1615–1622.
- Yu S, Yao S, Wen Y, et al. Angiogenic microspheres promote neural regeneration and motor function recovery after spinal cord injury in rats. Sci Rep. 2016;6(1):33428.
- Gwak SJ, Yun Y, Yoon DH, et al. Therapeutic use of 3beta-[n-(n',n'-dimethylaminoethane) carbamoyl] cholesterol-modified PLGA nanospheres as gene delivery vehicles for spinal cord injury. PLoS One. 2016;11(1):e0147389.
- Tang S, Liao X, Shi B, et al. The effects of controlled release of neurotrophin-3 from PCLA scaffolds on the survival and neuronal differentiation of transplanted neural stem cells in a rat spinal cord injury model. PLoS One. 2014;9(9):e107517.
- Imperato-Kalmar EL, McKinney RA, Schnell L, et al. Local changes in vascular architecture following partial spinal cord lesion in the rat. Exp Neurol. 1997;145(2):322–328.
- Figley SA, Liu Y, Karadimas SK, et al. Delayed administration of a bio-engineered zinc-finger VEGF-A gene therapy is neuroprotective and attenuates allodynia following traumatic spinal cord injury. PLoS One. 2014;9(5):e96137.
- Pekny M, Nilsson M. Astrocyte activation and reactive gliosis. Glia. 2005;50(4):427–434.
- Lutton C, Young YW, Williams R, et al. Combined VEGF and PDGF treatment reduces secondary degeneration after spinal cord injury. J Neurotrauma. 2012;29(5):957–970.