
Abstract
Paclitaxel (PTX), a tubulin-binding agent, is widely used and has shown good efficacy in the initial period of treatment for non-small cell lung cancer (NSCLC). However, the relatively rapid acquisition of resistance to PTX treatments that is observed in virtually all cases significantly limits its utility and remains a substantial challenge to the clinical management of NSCLC. The aim of this study was to identify candidate genes and mechanisms that might mediate acquired paclitaxel resistance. In this work, we established paclitaxel-resistant cells (A549-T) from parental cell lines by step-dose selection in vitro. Using methylation chip analysis and transcriptome sequencing, 43,426 differentially methylated genes and 2,870 differentially expressed genes are identified. Six genes (KANK1, ALDH3A1, GALNT14, PIK3R3, LRG1, WEE2), which may be related to paclitaxel resistance in lung adenocarcinoma, were identified. Among these genes, KANK1 exhibited significant differences in methylation and expression between cell lines. Since KANK1 plays an important role in the development of renal cancer and gastric cancer, we hypothesised that it may also play a role in acquired resistance in lung adenocarcinoma. Transient transfection of SiKANK1 significantly reduced the expression of KANK1, reducing apoptosis, increasing cell migration, and enhancing the tolerance of A549 cells to paclitaxel. KANK1 acts as a tumour suppressor gene, mediating the resistance of lung adenocarcinoma A549 to paclitaxel. The reduction of KANK1 expression can increase the paclitaxel resistance of non-small cell lung cancer and increase the difficulty of clinical treatment.
Introduction
Lung cancer is the leading cause of cancer-associated deaths worldwide [Citation1]. In clinical treatment, it can be divided by histological type into non-small cell lung cancer (NSCLC) and small cell lung cancer (SCLC), with the former making up approximately 85% of lung cancers [Citation2,Citation3]. Surgical treatment, radiotherapy and chemotherapy are currently the main means of treatment for this cancer. Sixty percent of patients with NSCLC are diagnosed at the stage of advanced disease [Citation4]. For patients with advanced non-small cell lung cancer, chemotherapy is an effective treatment and is widely used in clinical treatment. However, the development of chemoresistance limits the curative effect of anti-cancer drugs [Citation5].
Paclitaxel (PTX) is an effective drug for the treatment of cancer, and is often used in chemotherapy for non-small cell lung cancer. Appropriate concentrations of the drug can inhibit the depolymerisation of tubulin, inhibit mitosis and induce apoptosis [Citation6]. Although paclitaxel has good therapeutic effects in a variety of tumours, drug resistance is the main factor limiting its use [Citation7]. Resistance in tumours usually involves multiple factors, and is accomplished through a series of modifications in the target cells. Several mechanisms have been suggested to explain paclitaxel resistance in tumour cells and tumour lines. For example, the overexpression of the multidrug transporter P-glycoprotein [Citation8] has been shown to alter metabolism of the drug and decrease sensitivity to death-inducing stimuli [Citation9], changes in microtubule dynamics, and paclitaxel binding to target microtubules [Citation10]. Currently, targeted therapy of drug resistance is the main approach to solving the problem of drug resistance in tumours. Therefore, it is of considerable clinical importance to understand drug resistance in patients with non-small cell lung cancer, and identify predictive biomarkers for the condition.
The occurrence and proliferation of cancer is regulated by both epigenetic and genetic events. Epigenetic modification is becoming increasingly important as a goal in cancer research [Citation11]. DNA methylation is one of the important epigenetic mechanisms that regulate cell proliferation, apoptosis, differentiation, cell cycle, and transformation, and is important in transcriptional repression in eukaryotes [Citation12,Citation13]. With the rapid development of sequencing technology, next generation sequencing technologies facilitate the sequencing of entire cancer genomes, leading to the discovery of new biological targets [Citation14]. Epigenetic studies have revealed associations with tumorigenesis, and have provided biomarkers for the early detection, diagnosis and prognosis of cancer patients [Citation13,Citation15]. In this study, methylated chip analysis and transcriptome sequencing were performed to compare the differences in a human lung adenocarcinoma which was paclitaxel-resistant (A549-T) to those of its progenitor, A549. Six genes were selected as possibly having changes in gene expression due to the modification of DNA methylation. Among these genes, we selected KANK1 for further investigation. KANK1 is a member of the KANK protein family, located at 9p24.3, whose function is to control cytoskeleton formation by regulating actin polymerisation [Citation16]. It has been reported that this gene is absent or down-regulated in renal cell carcinoma, nasopharyngeal carcinoma, gastric and other cancers, and plays a role as a tumour suppressor gene [Citation16–18]. In malignant peripheral nerve sheath tumours (MPNSTs), KANK1, as a tumour suppressor, affects cell proliferation and apoptosis and plays a role in the targeted therapy of human MPNSTs [Citation19]. However, the mechanism of this gene with respect to paclitaxel resistance in NSCLC remains unclear. Based on previous reports, we hypothesised that this gene may mediate tolerance to paclitaxel in lung cancer chemotherapy. In this work, we performed a series of cell function tests on kank1-expressing deletion cells, including cell tolerance, cell proliferation, and cell migration. These findings suggest that KANK1 may be a promising therapeutic target for paclitaxel resistance in lung cancer.
Materials and methods
Cell culture and single cell isolation
A human non-small cell lung cancer A549 cell line was purchased from the Chinese Academy of Sciences Committee Cell Bank (Shanghai, China). All cell lines used in the experiment were cultured with 90% RPMI 1640 (Gibco, Carlsbad, CA, USA), 10% foetal bovine serum (FBS) (Gibco, Carlsbad, CA, USA), and 100 U/mL penicillin and 100 μg/mL streptomycin (Gibco, Carlsbad, CA, USA) at 37°C in a humidified atmosphere containing 5% CO2. The paclitaxel-resistant strain A549-T was established from the parental cell lines by step-dose selection in vitro over six months.
We carried out single-cell derived cloning of A549 and A549-T cells as previously described [Citation20]. A549 and A549-T cells were digested using 0.25%Trypsin-EDTA (1×) (Gibco, Carlsbad, CA, USA) and seeded in 96-well culture plates. After 24 h, wells containing only one cell were made, and these single cells were cultured in a humid environment at 37 °C with 5% CO2 for sub culturing. Finally, 15 clones were established from A549 cells, and 18 clones were established from the A549-T cells.
Assay of cell sensitivity to paclitaxel in vitro
The single cell-derived clones A549 and A549-T were seeded on 96-well culture plates at a density of 1 × 10⁵ cells per well. After 24 h incubation, the medium was replaced with fresh medium with paclitaxel at concentrations of 0 ng/ml, 50 ng/ml, 100 ng/mL, 200 ng/mL, 400 ng/mL, 800 ng/mL, 1600 ng/mL, 3200 ng/mL, and 6400 ng/mL. To each well was added 100uL of the drug. After 48 h of incubation, a Cell Count Kit-8 (CCK-8; Dojindo, Kumamoto, Japan) was used to examine cell viability. The absorbance of each well was measured at 450 nm on a microplate reader. Half maximal inhibitory concentrations (IC50) of the parent and resistant strains were calculated by comparing the percentage of cell survival with that of untreated cells [Citation21].
DNA methylation chip analysis and transcriptome sequencing
A total of 500 ng DNA of each sample was used as input material for DNA sample preparation. Sulphite transformation was carried out using the Zymo EZ DNA Methylation Kit recommended by Illumina, following the manufacturer’s protocol. 0.1 N NaOH was added to the sample to denature the DNA. After neutralisation, genome-wide amplification reagent was added and the solution was incubated overnight at 37 °C. Isopropanol was added, and DNA fragments were precipitated by centrifugation at 4 °C, the precipitated DNA was air dried, and hybrid buffer reagent was added to re-dissolve the DNA precipitate. During the hybridisation process, the fragmented DNA was denatured and annealed to 50 bases attached to the bead of the chip at a specific site. The un-hybridised and non-specifically hybridised DNA was washed, and the captured DNA was used as a template for a single base extension reaction on the chip, adding fluorescent groups on the chip, in order to distinguish the methylation status of samples.
A total of 1 μg of RNA per sample was used as input to the RNA sample preparation. Sequencing libraries were generated using the NEB NextUltra TM RNA Library Prep Kit for Illumina (NEB). The libraries were sequenced using the Illumina platform, and generated paid-side reads. Adapter sequences and low-quality sequence reads were removed from the dataset. After the data was processed, the original sequence was converted to a clean read sequence. These clean read sequences were then mapped to reference genome sequences. Based on the reference genome, further analysis and annotation was carried out on perfectly matched and mismatched read sequences. Quantification and normalisation of gene expression levels were performed using the FPKM algorithm [Citation22].
RNA extraction and qRT-PCR analysis
The cells to be extracted were washed three times with PBS buffer, 1 mL Trizol was added, and the lytic fluid was slowly shaken to fully lyse the cells. The lytic fluid was transferred to 1.5 mL centrifuge tubes, inverted 10 times to mix, and left for five minutes. Two hundred microliters of chloroform was added, mixed for 15 s, and then left for five minutes at room temperature. The solution was then centrifuged for 15 min at 12,000 rpm at 4 °C. The supernatant was transferred to 1.5 mL centrifuge tubes and the waste liquid discarded. Isopropanol was added at the same volume as supernatant, the liquid blown evenly with a pipette, and the solution left to stand for 10 min at room temperature. The supernatant was centrifuged at 4 °C at 12,000 rpm for 10 min. After the centrifugation, the supernatant was discarded. In order to purify the extracted RNA, 1 mL of 75% pre-cooled ethanol was added and centrifuged at 4 °C and 7500 rpm for five minutes. Then 20 μL of DEPC water was added, and the resulting RNA was centrifuged after a slight mix using a vortex oscillator. The concentration of the RNA was determined using a Nano Drop 2000 C. The RNA concentration was 300–1500ng/mL, and OD260/OD280 was between 1.8–2.1.
Samples were amplified using One Step SYBR PrimeScript TM RT-PCR Kit II (Clontech Laboratories Inc, Takara Bio, Japan) as previously reported [Citation21]. The qRT-PCR reaction involved a total of 40 cycle reactions, including a pre-denaturation step at 42 °C for five seconds, then 95 °C for 10 s. The PCR reaction involved 95 °C for five seconds, and 60 °C for 34 s. GAPDH was used as the endogenous control, and all reactions were performed in triplicate. Relative gene expression was calculated using the comparative cycle threshold (2−△△CT) method. Correlation primers are shown in .
Table 1. Primer designs.
SiRNAs and cell transfection
We purchased SiRNAs for KANK1 from GenePharma (Shanghai, China). The three SiRNA sequences synthesised were KANK1-Homo-147, sense (5′−3′) GCUCACACCACAAAGGUUATT, antisense (5′−3′) UAACCUUUGUGGUGUGAGCTT; KANK1-Homo-1700 sense (5′−3′) GGUGCAGACCAGAGACCAATT, antisense (5′−3′) UUGGUCUCUGGUCUGCACCTT; KANK1-Homo-3251, sense (5′−3′) GGAGGAGGAGGAUGAAGACTT, antisense (5′−3′) GUCUUCAUCCUCCUCCUCCTT; negative control, sense (5′−3′) UUCUCCGAACGUGUCACGUTT, antisense (5′−3′) ACGUGACACGUUCGGAGAATT. Three segments of SiRNA were transfected into cells using Lipofectamine 2000 transfection reagent (Invitrogen, Carlsbad, CA, USA), following the manufacturer’s instructions. The interference efficiency of the three interference sequences was assessed using qRT-PCR. Finally, we selected KANK1-Homo-3251, which had the highest interference efficiency, as the fragment for subsequent cell function tests.
Apoptosis assay
Annexinv-fitc/PI Apoptosis Assay Kits (KeyGEN, Nanjing, China) were used to detect apoptosis in the treated cells. Percentages of apoptotic and necrotic cells were quantified using flow cytometry (BD FACSCalibur, San Jose, CA, USA) and the CellQuestTM software.
Cell migration assay
Cell migration was evaluated using a 24-well transwell Boyden chamber covered by a 8.0 mm-aperture polycarbonate membrane (CorningV R CostarV R, Corning,NY). Cells were seeded in the upper chamber at a density of 1 × 10⁵/mL, and 600 μL complete culture solution was added as the chemoattractant to the lower chamber. The solution was incubated at 37 °C under 5% CO2 for 24 h. The upper chamber liquid was gently wiped dry with cotton swabs, the cells were fixed with paraformaldehyde, and then stained with crystal violet dye at room temperature for 10 min. The number of cells migrating in three random microscope fields was counted and the cells were photographed using an optical microscope.
TCGA database analysis
The TCGA database contains a large amount of sequencing data, and related clinical data. In order to undertake data mining to investigate gene-related functions, the development team of Peking University established a Web server (http://gepia.cancer-pku.cn/index.html) based on TCGA, for the analysis of the expression of cancer and normal genes and their interactions [Citation23]. We performed a correlation of the expression of KANK1 with the survival of patients with lung adenocarcinoma and the expression of this gene with high incidence in other tumours.
Statistical analysis
All analyses were performed using GraphPad Prism Software Version 5.0 (GraphPad Software Inc., La Jolla, CA, USA) and SPSS 16.0 (SPSS, Inc., Chicago, IL, USA). The significance of data with normal distributions was analysed using two-sided Student’s t-tests. P values less than .05 were considered to be statistically significant; error bars in the figures represent the standard error of measurement (SEM). All experiments were repeated at least three times.
Results
Paclitaxel toxicity profile of A549 and A549-T cell lines
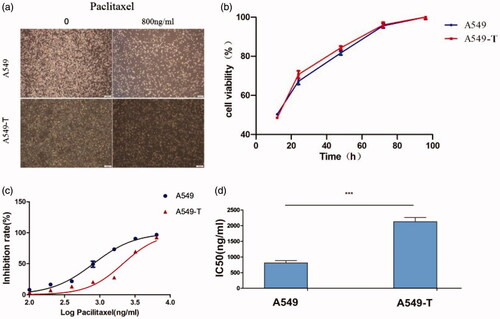
To explore the mechanism of paclitaxel resistance in lung adenocarcinoma A549 cells, an A549-T cell model was established by increasing the drug concentration in vitro. Single-cell-derived clones of A549 and A549-T cell lines were obtained by a limited dilution strategy, and were used for further study. After 48 h of incubation with a concentration of 800 ng/mL paclitaxel, drug-resistant cells were observed under an inverted microscope and showed no significant difference in morphology and growth rate compared with the original cells (). The 50% inhibitory concentration values (IC50) of paclitaxel (mean ± SD) in the A549 and A549-T cell lines were determined to be 808.7 ng/mL and 2127 ng/mL, respectively. The resistance index (RI) was 2.63 (p < .0001) and the curve of the cell inhibition rate is shown in .
Figure 1. (a). Morphological differences between A549 and A549-T cells were observed under a microscope after 48 h of paclitaxel incubation. (b) In 24–48 h, the growth rate of A549-T was slightly higher than that of A549, and there was no significant difference in overall cell growth rate. (c) The x-axis shows the logarithm value of the drug concentration, and the y-axis shows the inhibition rate of the cells. The inhibition rates of A549 and A549-T cells at different concentrations are plotted. (d) An A549 paclitaxel resistant strain (A549-T) was successfully developed in vitro and its resistance index (RI) was 2.63. ***p < .001 (Student’s t-test).
Identification of genes with different methylation and expression
DNA methylation is believed to be one of the causes of changes in mRNA expression during tumorigenesis [Citation24]. In order to identify the related PTX resistance genes that are regulated by methylation and mRNA expression, we performed methylation analysis and RNA-Seq of A549 and A549-T. The beta value is the main indicator of the DNA methylation level at the CPG locus. Values of β ≥ 0.5 or β ≤ −0.5 were set as the threshold for statistical significance. A total of 43,426 methylated differential genes were identified, including 22,648 hypermethylated genes and 20,778 hypomethylated genes in A549-T. meanwhile, a total of 2,870 differential expression genes (DEGs) were identified by RNA-Seq, 1,503 of which were upregulated and 1,367 of which were downregulated in A549-T. The degree of expression change of DEGs between the two samples is shown in a volcano diagram (). To further narrow the scope of target genes, |log 2 FC| ≥1, FDR ≤ 0.001 were used as the selection criteria. We identified three genes, KANK1, GALNT14 and LRG1, with hypermethylation and low expression, and three genes, ALDH3A1, PIK3R3, and WEE2 with hypomethylation and high expression ().
Figure 2. Differential gene identification and target gene expression verification by qRT-PCR. (a) Each dot in the volcano map represents a gene, with red dots representing up-regulated genes, green dots representing down-regulated genes, and black dots representing genes with no significant change in expression. The x-axis shows the difference in the expression level of the genes, while the y-axis shows the significance of the gene expression level. (b) The x-axis shows log2 (FPKM), which is the log value of the average expression quantity in the two samples. The y-axis shows log2 (FC), which is the logarithm of the multiple of gene expression differences between two samples, and is used to measure the difference in expression levels. (c) qRT-PCR was used to verify the expression of six candidate genes identified by methylation analysis and RNA-Seq, that may lead to drug resistance. Log 2 FC/RQ is the logarithm of the fold change or relative quantity in base 2. Error bars represent the standard deviation (STDEV) of the qRT-PCR analysis (n = 3).
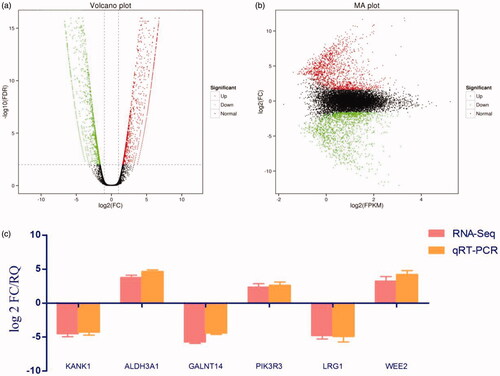
Table 2. Correlation screening indexes of genes with methylation and expression differences.
Most of these genes are related to the migration and apoptosis of cancer cells, and some of the genes are also involved in mitosis and signal transduction, which is probably related to tolerance to paclitaxel in lung adenocarcinoma [Citation25–30]. We verified the expression of six genes (KANK1, GALNT14, LRG1, ALDH3A1, PIK3R3, and WEE2) selected by qRT-PCR, and the results were consistent with the transcriptome sequencing results ().
KANK1 silencing increases the resistance of A549 cells to PTX treatment
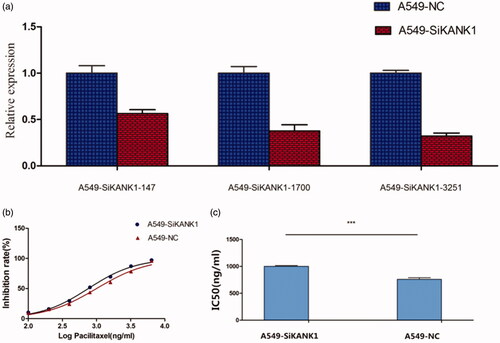
A549 cells were infected with SiRNA (KANK1-homo-147, KANK1-homo-1700, and KANK1-homo-3251) that target human KANK1, and non-silenced control SiRNA (a scrambled control SiCtrl). Compared with the non-silenced control group, the endogenous KANK1 level of SiKNK1 transfected decreased. Compared with the SiNC-treated A549 cells, the KANK1 mRNA expression level of the SiRNA-treated A549 cells was lower. qRT-PCR results showed that, among the three interference sequences, the knockdown rate of KANK1-homo-3251 was optimal, at about 67.8% (). As expected, the silencing of KANK1 in A549 cells resulted in a statistically significant increase in sensitivity to paxlitaxel. The IC50 of PTX in A549 cells treated with SiKANK1 and A549 cells treated with SiCtrl were 1002 ng/mL and 759.4 ng/mL, respectively (), suggesting that KANK1 is involved in the resistance of A549 cells to PTX.
Figure 3. Silencing KANK1 reduced the sensitivity of A549 lung adenocarcinoma cells to PTX. (a) Screening of the efficiency of interference of three SiRNAs in KANK1. GAPDH was used as the internal control. (b) Drug sensitivity of A549 cells transfected with SiKANK1 or SiNC. (c) IC50 of PTX in KANK1-homo-3251-treated A549 cells. Each experiment was performed in triplicate. *** p < .001 (Student’s t-test).
Knockdown of KANK1 decreased apoptosis and increased migration
To determine whether the paclitaxel cytotoxicity of KANK1-mediated A549 cells was related to apoptosis, flow cytometry was used to detect the percentage of early and late apoptotic cells. As shown in , compared with the negative control group, the knockdown of KANK1 in A549 cells at several different concentrations significantly reduced the apoptosis rate. These results indicate that a decrease in KANK1 expression can effectively reduce apoptosis in lung adenocarcinoma A549 cells, as previously reported in other cancers [Citation31,Citation32], and also plays an anti-oncogenic role in lung cancer cells.
Figure 4. Knockdown of KANK1 decreased apoptosis and increased migration of A549 cells, thereby increasing the resistance of A549 cells to PTX drugs. (a) Flow cytometry analysis showed that the knockdown of KANK1 reduced the rate of apoptosis. Different concentrations of paclitaxel led to different apoptosis rates. (b) In vitro migration experiments showed that KANK1 silencing increased the migration capacity of A549 cells. *p < .05, **p < .01, ***p < .001 (Student’s t-test).
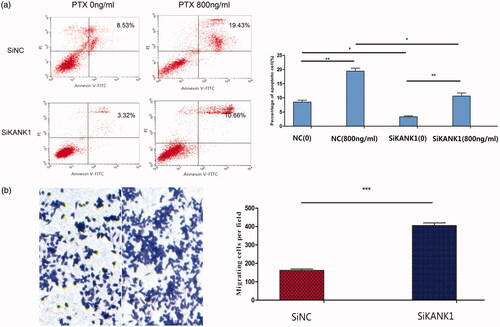
We examined the effect of KANK1 knockdown on cell migration in A549 cells. Transwell migration experiments showed that KANK1 silencing significantly increased the migration behaviour of A549 cells (). The results are consistent with previous reports that the KANK protein family plays an important role in cell migration.
These findings suggest that knocking down KANK1 reduces A549 cell apoptosis and increases cell migration, thereby mediating paclitaxel tolerance in lung cancer therapy.
TCGA database survival curve analysis
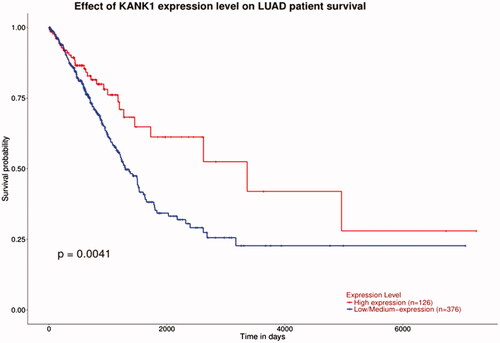
KANK1 mRNA expression data of 502 lung adenocarcinoma samples was downloaded from the TCGA database and we evaluated the correlation between KANK1 mRNA expressions and patient survival. As shown in , the survival probability of patients with high levels of KANK1 was significantly higher than that of patients with low expression of KANK1. The low expression of KANK1 is not conducive to prolong the survival of patients, which is consistent with the results of our study.
Figure 5. Correlation of KANK1 expression and the DFS of patients with lung adenocarcinoma. Red and blue lines indicate high and low expression groups, respectively. High expression of KANK1 is associated with improved DFS. p < .05 was considered to be statistically significant.
Discussion
In this study, we examined the genes associated with resistance to the drug paclitaxel, in order to develop targeted therapies for lung adenocarcinoma. New evidence suggests that there are significant differences in gene-specific and genome-wide epigenetic maps between resistant and sensitive cells [Citation33]. In order to explore the mechanism of drug resistance, we investigated differences in methylation and expression in cell lines with acquired drug resistance, using methylation chip analysis and transcriptome sequencing.
We identified six genes that may be involved in paclitaxel resistance. Among these genes, KANK1, GALNT14, and LRG1 were hypermethylated and downregulated, and ALDH3A1, PIK3R3, and WEE2 were hypomethylated and upregulated. Most of these genes are associated with changes in functions such as drug metabolism, bypassing of cancer signalling pathways, inhibition of apoptosis cascade and DNA repair. These factors are also believed to be associated with drug resistance.
Based on previous reports, GALNT14 expression is significantly correlated with breast cancer staging and disease-free survival (DFS) rate, and reduced chemical sensitivity can be restored by silencing GALNT14 in osx cells [Citation34]. LRG1 is a factor associated with hepatocellular carcinoma metastasis [Citation29]. The expression of ALDH3A1 is related to the growth inhibition effect of active aldehyde generated in membrane lipid peroxidation, and the downregulation of ALDH3A1 is related to the inhibition of cell proliferation, providing support for the role of ALDH3A1 in the cellular Defence mechanism of tumour cells [Citation35]. PIK3R3 affects the migration of colon cancer cells, and the activation of the PI3K/AKT signalling pathway affects migration, apoptosis, proliferation and promotion of angiogenesis. Targeted treatment of the PI3K/AKT pathway with PI3K inhibitors can improve the treatment of cancer [Citation28]. WEE2 plays an important role in the maintenance of meiosis in mouse oocytes. WEE2 mRNA copied in vivo and in vitro may lead to a dysfunctional meiosis [Citation30]. The proteins encoded by KANK1 belong to the KANK protein family, whose function is to control cytoskeleton formation by regulating actin aggregation. The up-regulation of KANK1 can lead to changes in the expression of the Bax and Bcl-2 genes, and prevent cell division at the G0/G1 phase of mitosis. The expression levels of the cell cycle-regulating proteins CDK4, CDK6, and cycloprotein D1 are also significantly reduced. However, translocation of Bax and Bcl-2 may lead to changes in mitochondrial membrane proteins resulting in the release of cytochrome C, activating the Caspase family and eventually leading to apoptosis [Citation36,Citation37]. Recently, it has been reported that the up-regulation of the KANK1 gene can inhibit the development of lung cancer both in vivo and in vitro, and its mechanism is closely related to cell apoptosis and tumour invasion and metastasis [Citation38].
Several studies have found that KANK1 is a tumour suppressor, and its expression is downregulated in such cancers as kidney cancer, bladder cancer, prostate cancer, lung cancer and breast cancer, and glioma. By analysing methylation and RNA-Seq data, we found that KANK1 was hypermethylated and under-expressed in A549-T. Therefore, we speculate that targeting KANK1 may lead to the development of an effective new therapeutic strategy to prevent or reduce drug resistance to paclitaxel in chemotherapy for lung adenocarcinoma. We observed that silencing KANK1 can reduce apoptosis and increase migration, to significantly restore tolerance to paclitaxel. This study revealed a new links between acquired resistance to paclitaxel and KANK1, providing a basis for overcoming resistance to paclitaxel by inhibiting the expression of KANK1.
We analysed the correlation between KANK1 expression and the DFS of patients with lung adenocarcinoma using data from the TCGA database. In patients with lung cancer, the survival of patients with high KANK1 expression was significantly higher than that of patients with low expression (p < .05), consistent with our findings. Therefore, we believe that the expression of KANK1 leads to an increase in paclitaxel resistance, resulting in treatment difficulties and shortening the survival period of patients.
In conclusion, we provide evidence that KANK1 expression is decreased in A549-T cells. This is the first study supporting an association between KANK1 and paclitaxel resistance in lung cancer chemotherapy. Six novel biomarkers, KANK1, GALNT14, LRG1, ALDH3A1, PIK3R3, and WEE2, were identified in our study. This study also provides new targets for subsequent research into drug resistance to chemotherapy for lung cancer. Our study provides a new perspective for studying the mechanism of paclitaxel acquired drug resistance and potential targets in lung cancer cells.
Acknowledgments
The authors are very grateful to National Engineering Research Centre for Miniaturised Detection Systems for providing excellent data analysis equipment. We would like to acknowledge all those who contributed to the development of this research.
Disclosure statement
No potential conflict of interest was reported by the author(s).
Additional information
Funding
References
- Roth JA, Carlson JJ. Prognostic role of ERCC1 in advanced non-small-cell lung cancer: a systematic review and meta-analysis. Clin Lung Cancer. 2011;12(6):393–401.
- de Castro J, Rodriguez MC, Martinez-Zorzano VS, et al. Erythrocyte fatty acids as potential biomarkers in the diagnosis of advanced lung adenocarcinoma, lung squamous cell carcinoma, and small cell lung cancer. Am J Clin Pathol. 2014;142:111–120.
- Herbst RS, Morgensztern D, Boshoff C. The biology and management of non-small cell lung cancer. Nature. 2018;553(7689):446–454.
- Jemal A, Bray F, Center MM, et al. Global cancer statistics. CA Cancer J Clin. 2011;61:69–90.
- Wu K, Li J, Qi Y, et al. SNHG14 confers gefitinib resistance in non-small cell lung cancer by up-regulating ABCB1 via sponging miR-206-3p. Biomed Pharmacother. 2019;116:108995.
- Yuan H, Sun B, Gao F, et al. Synergistic anticancer effects of andrographolide and paclitaxel against A549 NSCLC cells. Pharm Biol. 2016;54(11):2629–2635.
- Orr GA, Verdier-Pinard P, McDaid H, et al. Mechanisms of Paclitaxel resistance related to microtubules. Oncogene. 2003;22(47):7280–7295.
- Gottesman MM. Mechanisms of cancer drug resistance. Annu Rev Med. 2002;53(1):615–627.
- Blagosklonny MV, Fojo T. Molecular effects of paclitaxel: myths and reality (a critical review). Int J Cancer. 1999;83(2):151–156.
- Dumontet C, Sikic BI. Mechanisms of action of and resistance to antitubulin agents: microtubule dynamics, drug transport, and cell death. J Clin Oncol . 1999;17(3):1061–1070.
- Kelly AD, Issa JJ. The promise of epigenetic therapy: reprogramming the cancer epigenome. Curr Opin Genet Dev. 2017;42:68–77.
- Bogdanovic O, Lister R. DNA methylation and the preservation of cell identity. Curr Opin Genet Dev. 2017;46:9–14.
- Portela A, Esteller M. Epigenetic modifications and human disease. Nat Biotechnol. 2010;28(10):1057–1068.
- Wong KM, Hudson TJ, McPherson JD. Unraveling the genetics of cancer: genome sequencing and beyond. Annu Rev Genom Hum Genet. 2011;12(1):407–430.
- Toh TB, Lim JJ, Chow EK. Epigenetics in cancer stem cells. Mol Cancer. 2017;16(1):29.
- Luo FY, Xiao S, Liu ZH, et al. KANK1 reexpression induced by 5-Aza-2′-deoxycytidine suppresses nasopharyngeal carcinoma cell proliferation and promotes apoptosis. Int J Clin Exp Path. 2015;8(2):1658–1665.
- Catic A, Kurtovic-Kozaric A, Johnson SH, et al. A novel cytogenetic and molecular characterization of renal metanephric adenoma: Identification of partner genes involved in translocation t(9;15)(p24;q24). Cancer Genetics. 2017;214-215:9–15.
- Chen T, Wang K, Tong X. In vivo and in vitro inhibition of human gastric cancer progress by upregulating KANK1 gene. Oncology Reports. 2017;38(3):1663–1669.
- Cui Z, Shen Y, Chen KH, et al. KANK1 inhibits cell growth by inducing apoptosis though regulating CXXC5 in human malignant peripheral nerve sheath tumors. Sci Rep. 2017;7(1):40325.
- Xu Y, Zhang C, Liang H, et al. Dishevelled 1, a pivotal positive regulator of the Wnt signalling pathway, mediates 5-fluorouracil resistance in HepG2 cells. Artif Cells Nanomed Biotechnol. 2018;46(sup2):192–200.
- Liang H, Xu Y, Zhang Q, et al. MiR-483-3p regulates oxaliplatin resistance by targeting FAM171B in human colorectal cancer cells. Artif Cells Nanomed Biotechnol. 2019;47(1):725–736.
- Romualdi C, Bortoluzzi S, D’Alessi F, et al. IDEG6: a web tool for detection of differentially expressed genes in multiple tag sampling experiments. Physiolog Genom. 2003;12(2):159–162.
- Tang Z, Li C, Kang B, et al. GEPIA: a web server for cancer and normal gene expression profiling and interactive analyses. Nucleic Acids Res. 2017;45(W1):W98–W102.
- Zhang S, Wang Y, Chen M, et al. CXCL12 methylation-mediated epigenetic regulation of gene expression in papillary thyroid carcinoma. Sci Rep. 2017;7(1):44033.
- Clevers H. Wnt/beta-catenin signaling in development and disease. Cell. 2006;127(3):469–480.
- Pappa A, Chen C, Koutalos Y, et al. ALDH3A1 protects human corneal epithelial cells from ultraviolet- and 4-hydroxy-2-nonenal-induced oxidative damage. Free Radic Biol Med. 2003;34:1178–1189.
- Soria JC, Mark Z, Zatloukal P, et al. Randomized phase II study of dulanermin in combination with paclitaxel, carboplatin, and bevacizumab in advanced non-small-cell lung cancer. J Clin Oncol. 2011;29(33):4442–4451.
- Mayer IA, Arteaga CL. The PI3K/AKT pathway as a target for cancer treatment. Annu Rev Med. 2016;67(1):11–28.
- Zhang Y, Luo Q, Wang N, et al. LRG1 suppresses the migration and invasion of hepatocellular carcinoma cells. Med Oncol. 2015;32(5):146.
- Han SJ, Chen R, Paronetto MP, et al. Wee1B is an oocyte-specific kinase involved in the control of meiotic arrest in the mouse. Curr. Biol. 2005;15(18):1670–1676.
- Suzuki JI, Roy BC, Ogaeri T, et al. Depletion of tumor suppressor KANK1 induces centrosomal amplification via hyperactivation of RhoA. Exp Cell Res. 2017;353(2):79–87.
- Medves S, Duhoux FP, Ferrant A, et al. KANK1, a candidate tumor suppressor gene, is fused to PDGFRB in an imatinib-responsive myeloid neoplasm with severe thrombocythemia. Leukemia. 2010;24(5):1052–1055.
- Turner NC, Reis-Filho JS. Genetic heterogeneity and cancer drug resistance. Lancet Oncol. 2012;13(4):e178–185.
- Wu J, Chen X, Bao Q, et al. Osterix decreases the chemosensitivity of breast cancer cells by upregulating GALNT14. Cell Physiol Biochem. 2017;44(3):998–1010.
- Parajuli B, Fishel ML, Hurley TD. Selective ALDH3A1 inhibition by benzimidazole analogues increase mafosfamide sensitivity in cancer cells. J Med Chem. 2014;57(2):449–461.
- Guo X, Fan W, Bian X, et al. Upregulation of the KANK1 gene-induced brain glioma apoptosis and blockade of the cell cycle in G0/G1 phase. Int J Oncol. 2014;44(3):797–804.
- Tomiyama A, Tachibana K, Suzuki K, et al. MEK-ERK-dependent multiple caspase activation by mitochondrial proapoptotic Bcl-2 family proteins is essential for heavy ion irradiation-induced glioma cell death. Cell Death Dis. 2010;1:e60.
- Gu Y, Zhang M. Upregulation of the KANK1 gene inhibits human lung cancer progression in vitro and in vivo. Oncol Rep. 2018;40:1243–1250.